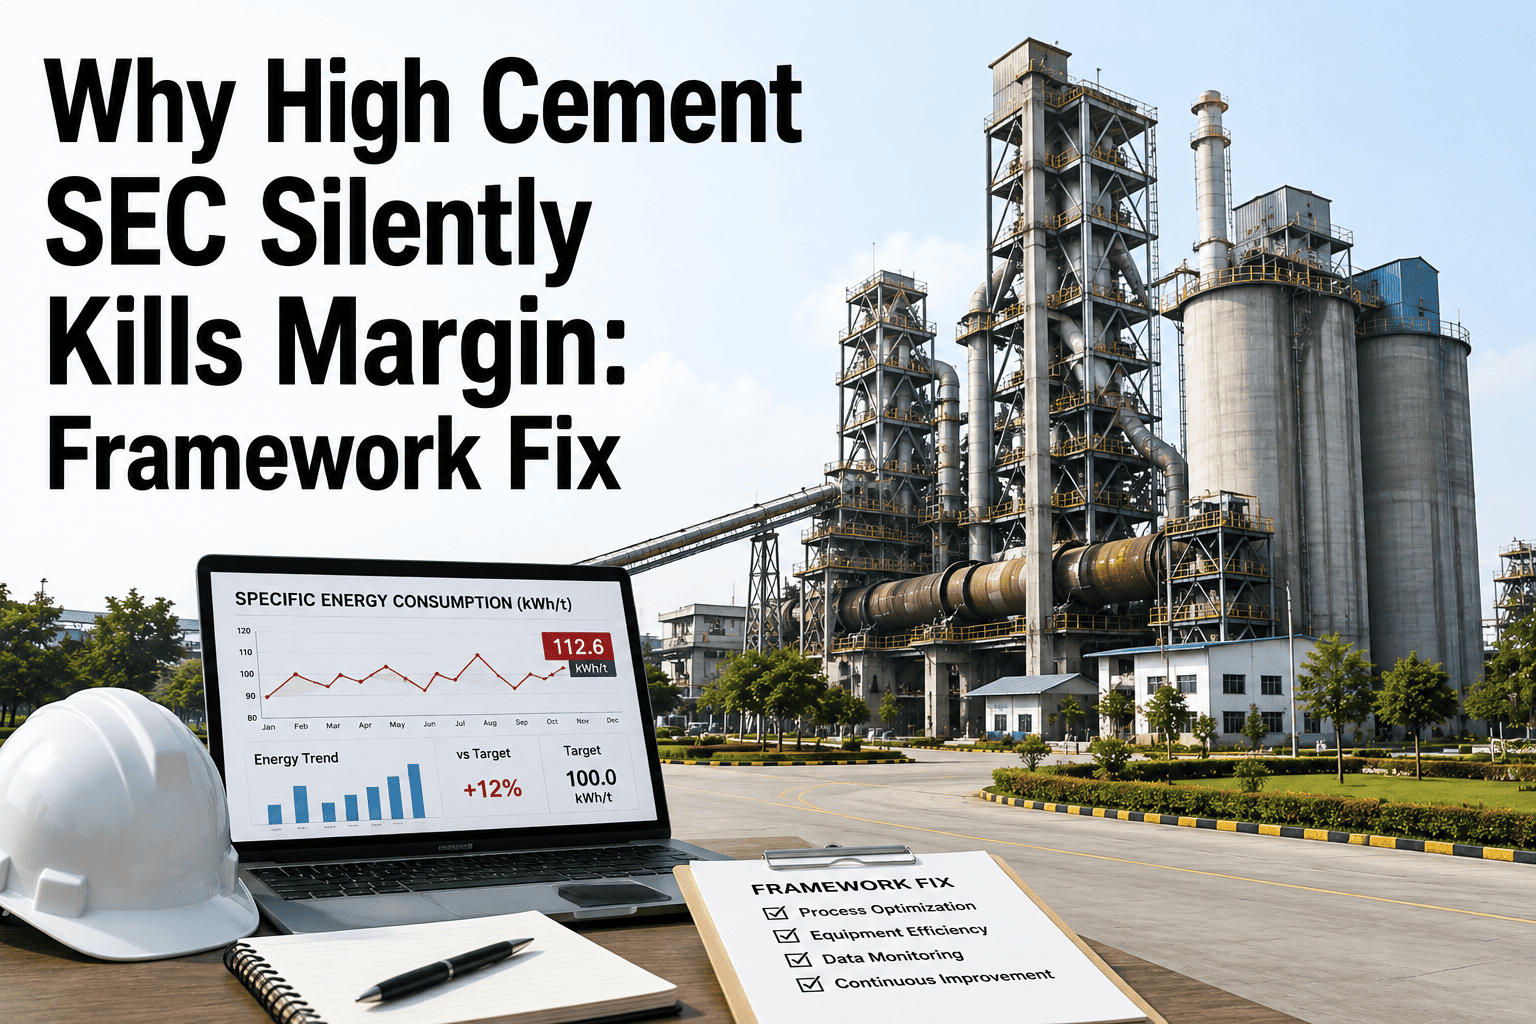
Grinding is the single largest electrical draw in a cement plant, consuming 40–45% of total plant power before a single bag of cement ships. That makes it the one circuit where a slow, invisible drift in specific energy consumption compounds into real margin loss month after month — long before throughput or quality ever visibly suffers. Offline energy audits catch this drift once or twice a year, by which point tens of thousands of dollars have already gone into the switchgear. This framework walks through the six variables that quietly push grinding kWh/t above design, and how a CMMS-linked monitoring rhythm catches the drift while it is still cheap to fix.
Your grinding circuit is 60% of plant power — when did you last verify it's running at design efficiency?
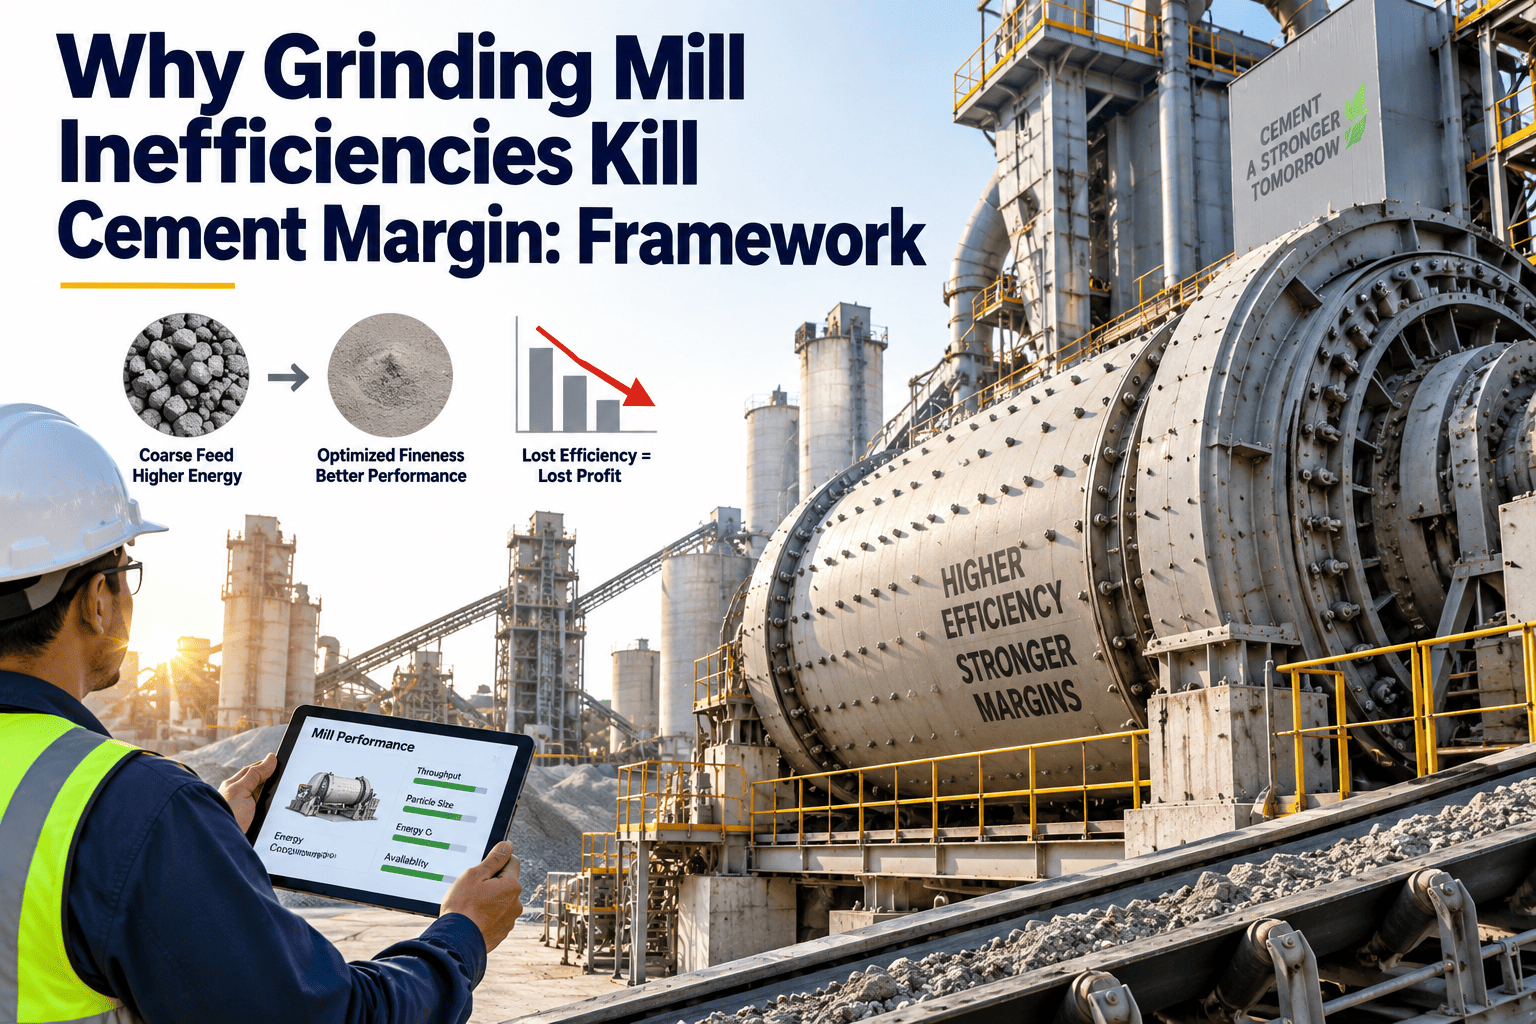
Specific energy consumption creeps upward between shutdowns as liners wear, separators drift, and ball charge depletes — and most plants only measure it during the next planned outage.
Grinding drift never shows up as a single alarming event
A tripped kiln or a failed fan bearing is impossible to miss. A mill running 1.5 kWh/t above baseline is not — throughput holds, Blaine holds, and the extra cost simply disappears into the monthly power bill as a rounding error nobody investigates.
- 01Specific energy consumption is usually reviewed monthly at best, and often only at the department level, not per mill
- 02Liner wear, separator condition, and ball charge are tracked — if at all — in separate maintenance logs, never against the kWh/t trend
- 03Offline energy audits happen once or twice a year, well after the drift has already cost six figures
Six interdependent factors control your grinding kWh/t
Specific energy consumption is not controlled by the mill motor alone — it is the sum of six variables that degrade independently and compound together.
Liner profile & wear
Worn shell and classifying liners change ball trajectory, cutting impact efficiency and pushing consumption up 8–14%.
Ball charge level
Media depletion at 40–55 g/tonne, left untracked, costs 6–11% throughput and drops fineness below target.
Separator efficiency
A degraded rotor increases bypass and recirculating load by 30–45%, inflating grinding work for the same finished tonne.
Diaphragm condition
Blocked or worn diaphragm slots restrict material flow between chambers, forcing the mill to work harder for the same output.
Bearing & drive friction
Rising bearing temperatures and drive-train friction losses add parasitic kWh that never shows up in a Blaine test.
Feed variability
Inconsistent clinker feed is frequently blamed for efficiency loss that is actually a symptom of worn internals — masking the real root cause.
What unmonitored drift looks like between shutdowns
Without a tracking rhythm tied to the maintenance record, specific energy consumption climbs steadily and predictably from the post-shutdown baseline.
| Timeline | Specific energy | Drift from baseline |
|---|---|---|
| Month 0 — post-shutdown | 32.0 kWh/t | Fresh liners, new media, clean diaphragms |
| Month 2 | 33.5 kWh/t | +4.7% — media wear reduces impact energy |
| Month 4 | 34.6 kWh/t | +8.1% — separator bypass increasing |
| Month 6 | 36.2 kWh/t | +13.1% — liner wear compounding with bearing losses |
On a 2.4 MTPA plant paying $0.09/kWh, this six-month drift alone represents roughly $700K in avoidable power spend — recoverable through liner, separator, and diaphragm work timed to the trend line rather than the calendar.
Where your circuit sits against design-basis energy targets
| Grinding technology | Specific energy at 3,200–3,500 Blaine | vs. ball mill baseline |
|---|---|---|
| Ball mill, closed circuit | 33–40 kWh/t | Baseline |
| Hybrid HPGR + ball mill | ~28 kWh/t | −25% |
| Vertical roller mill (VRM) | 20–23 kWh/t | −38% |
| Standalone HPGR | ~11 kWh/t | −72% |
Find out where your mills sit on the drift curve today
A clean 72-hour baseline at target throughput and Blaine is the first step — most plants have never measured it at the motor terminal.
Turning six hidden variables into one trend a supervisor checks daily
Link condition data to the mill asset record
Liner wear percentage, ball charge inspections, and separator condition get logged against the same asset as its energy reading.
Trend specific energy consumption per mill
A daily or shift-level kWh/t calculation replaces the monthly department-wide average with a mill-specific number.
Trigger inspection work orders on drift, not the calendar
When kWh/t crosses a threshold, a condition-based work order opens automatically instead of waiting for the next planned outage.
Correlate root cause before ordering parts
Cross-referencing liner age, media consumption rate, and separator maintenance history shows which of the six variables actually moved.
Cement grinding margin — five common questions
What is a realistic specific energy consumption target for a cement ball mill?
A well-maintained closed-circuit ball mill typically runs 33–40 kWh/t for OPC at 3,200–3,500 Blaine; a VRM circuit should sit closer to 20–23 kWh/t at the same fineness.
How often should specific energy consumption be measured?
Daily or per-shift tracking catches drift within weeks. A single annual audit only confirms the damage after it has already accumulated.
Is feed variability usually the real cause of efficiency loss?
It's often blamed first, but liner wear, separator bypass, and ball charge depletion are more frequently the actual root cause once condition data is checked against the energy trend.
Can grinding energy be improved without a capital equipment upgrade?
Yes. Liner replacement timing, separator calibration, and ball charge top-up are maintenance-driven levers that typically recover 8–15% without touching clinker factor or quality.
How do I start tracking this if I have no baseline today?
Run a clean 72-hour measurement at target throughput and Blaine, then log it against your mill asset. Book a Demo and we'll help you set the baseline.
Turn grinding drift into a tracked, actionable trend
Link liner wear, ball charge, and separator condition to your kWh/t trend, and catch the drift while a liner swap is still cheaper than a quarter of excess power.
Free trial · No credit card required