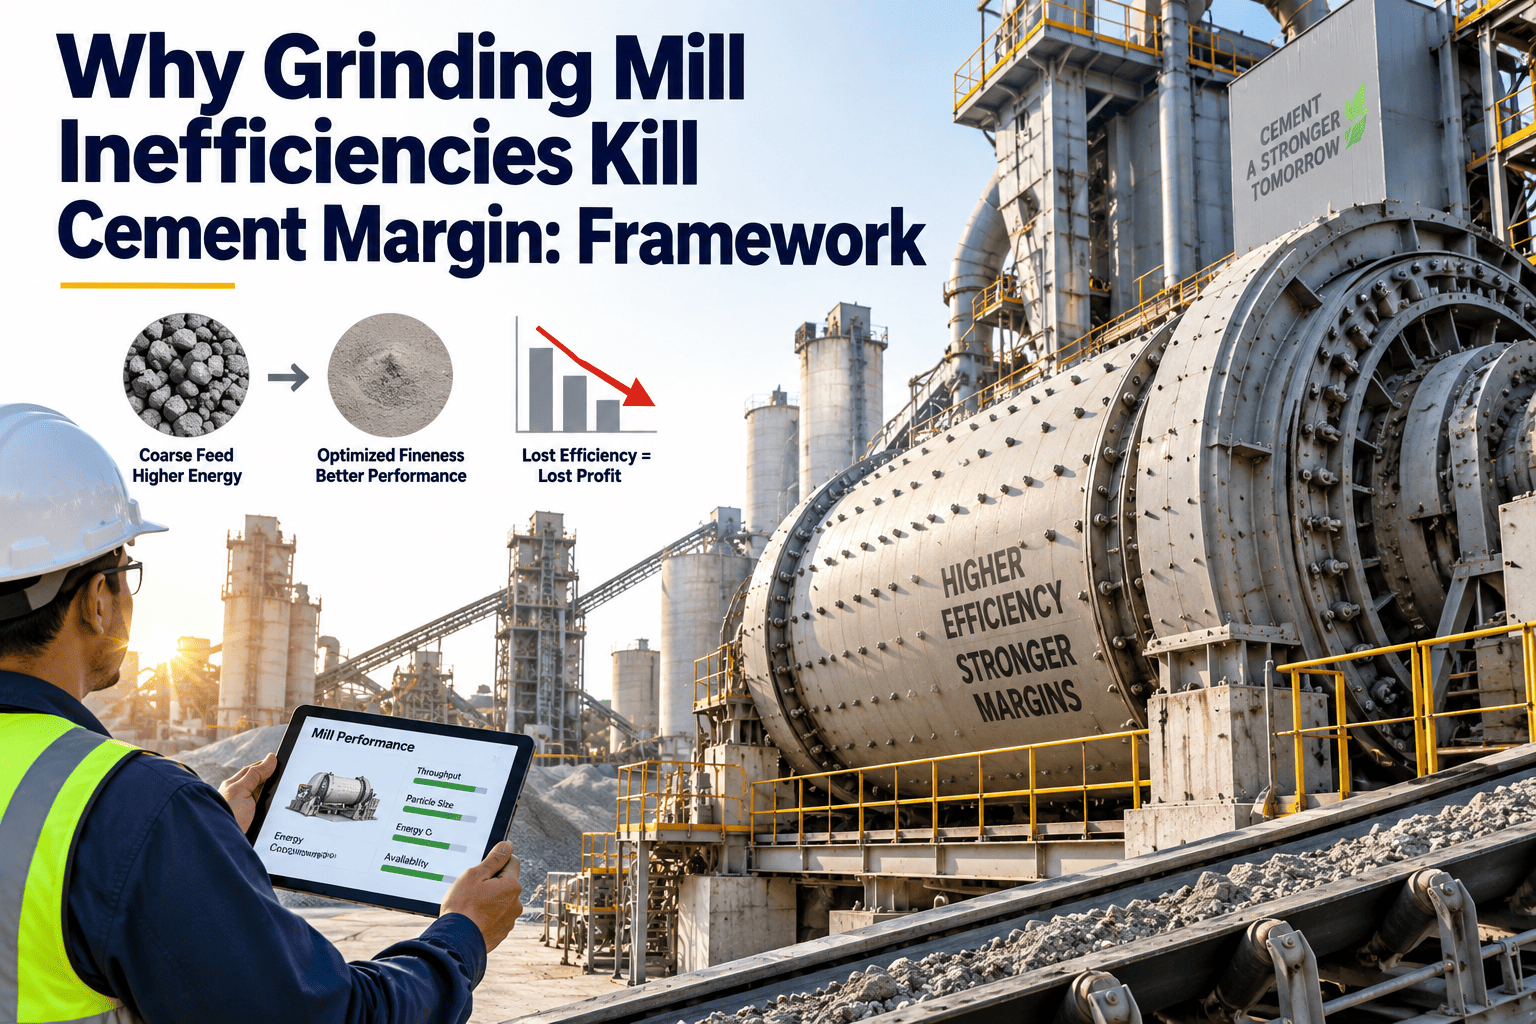
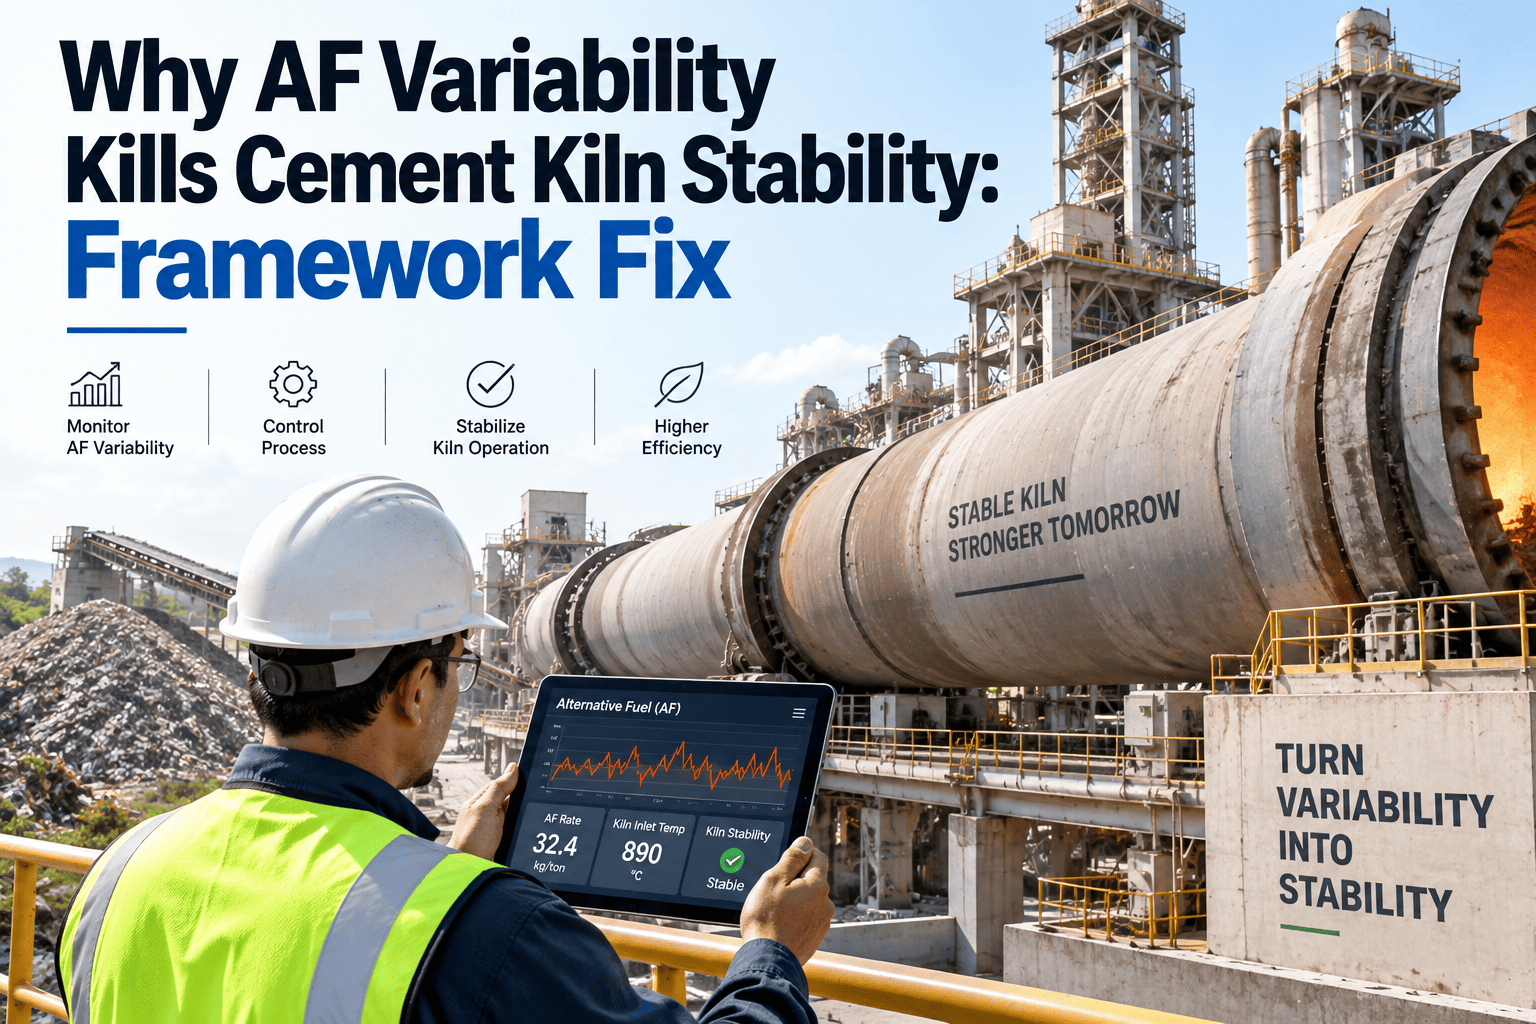
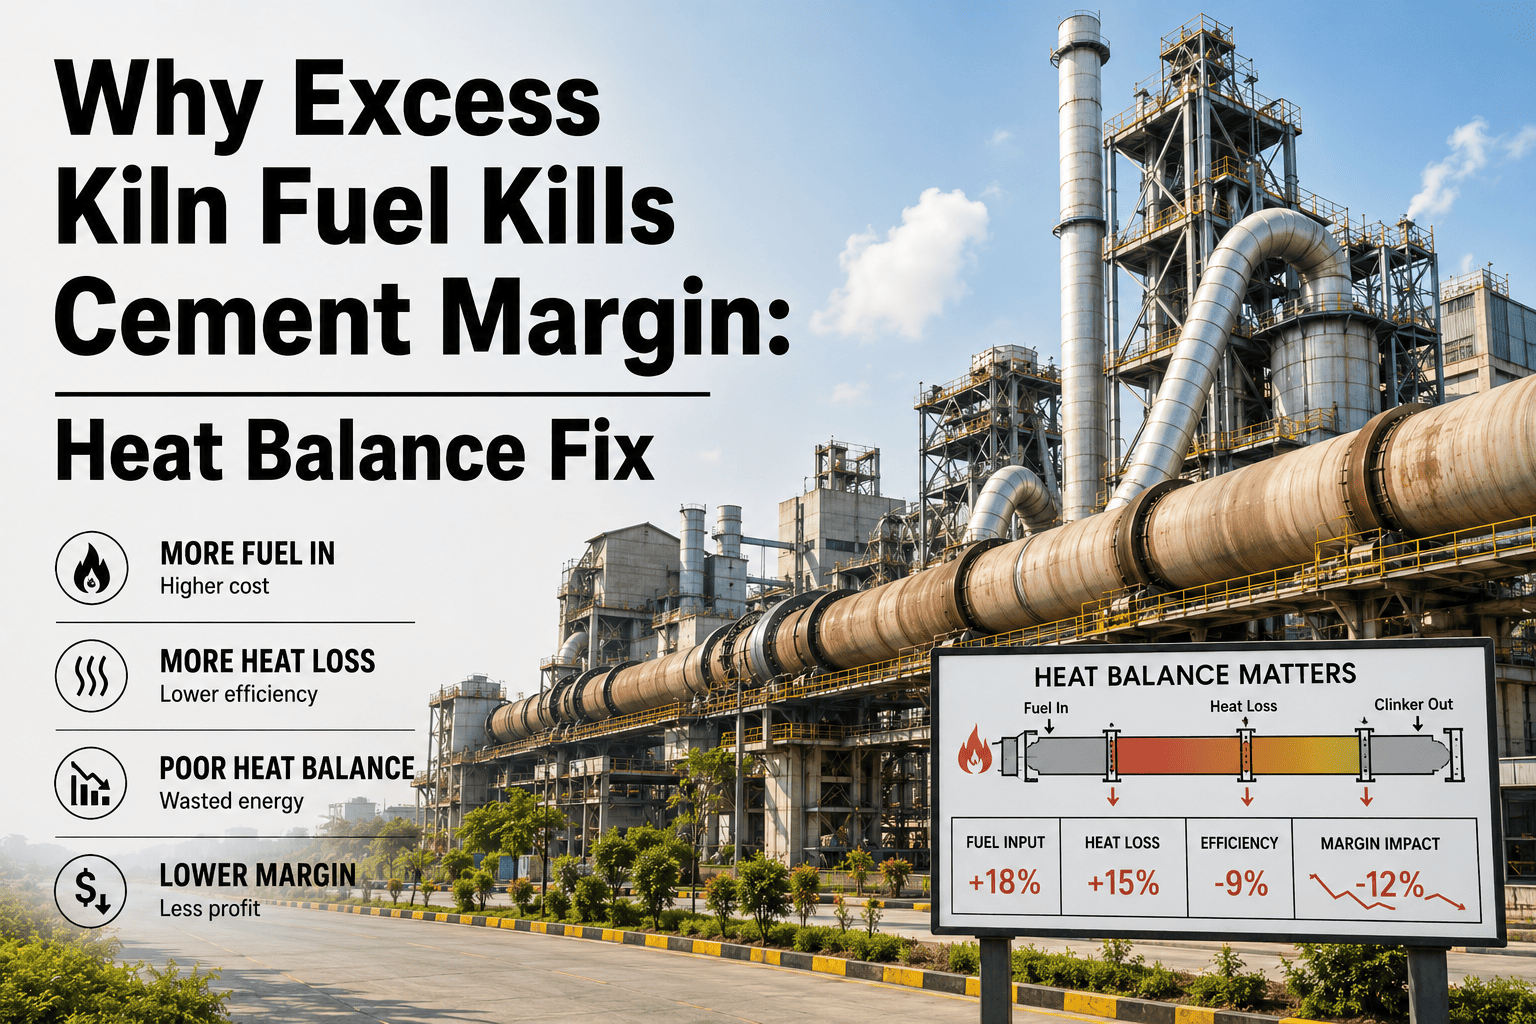
Cement plants track kiln uptime, clinker output, and fuel deliveries obsessively, yet specific energy consumption is usually reviewed once a month — long after the margin tied to it has already leaked away. A kiln burning 750 kcal/kg clinker against a realistic benchmark of 680 kcal/kg is not failing an audit, it is quietly costing six or seven figures a year in fuel that never appears on a single work order. Grinding circuits behave the same way: a mill drawing 15 to 20 percent more power per tonne than its design spec looks completely normal on a shift log because nobody compares today's reading against yesterday's baseline. Book a demo to see how a connected CMMS catches SEC drift before it eats next quarter's margin.
Energy & Margin
Why High Cement SEC Silently Kills Margin
7 min read
680–950
kcal/kg clinker — the spread between best-practice kiln thermal SEC and what underperforming kilns actually burn
40–80
kcal/kg of excess fuel a typical plant accumulates from deferred maintenance alone between shutdowns
$0.6–1.2M
estimated annual fuel cost of that excess consumption — cost that never shows up as a maintenance line item
15–20%
extra kWh per tonne a grinding mill draws once liners are worn and media charge drifts off spec
Two Channels, One Margin Problem
Every cement plant loses margin through two separate energy channels at once — thermal SEC inside the kiln system and electrical SEC across the grinding circuit. They drift for different reasons and need different fixes, but both hide inside normal-looking shift data.
Kiln & Preheater System
680–750
Best-Practice kcal/kg
3
kcal/kg per 1% False Air
Thermal SEC drifts through false air ingress at expansion joints and cyclone walls, secondary air temperature loss from worn cooler grates, and refractory thinning that raises shell radiation loss. None of these trip an alarm — they show up only when exhaust and shell temperature trends are tracked against a fixed baseline.
Root causes: false air, cooler grate wear, refractory loss
Grinding & Auxiliary Systems
85–95
Best-Practice kWh/t
110–120
Global Average kWh/t
38–42%
Share of Plant Power
Grinding alone accounts for 38 to 42 percent of a plant's electrical bill. Once liner profile and grinding media charge drift from design, the same mill can draw 15 to 20 percent more power per tonne with no visible change in product quality or output rate.
Root causes: worn liners, media charge drift, separator inefficiency
SEC Loss Points: Asset by Asset
Preheater Shell & Joints
False Air
Thermal
Worn expansion joints and cracked cyclone walls let cold air into the string. Plants typically accumulate 5 to 8 percent false air between shutdowns, each point adding roughly 3 kcal/kg to exhaust heat loss.
Fix: seal inspection every shutdown
Clinker Cooler Grate
Thermal
Recovery
Grate plate and air beam wear cuts heat recovery, lowering secondary air temperature into the kiln. A 50°C drop raises fuel use by roughly 8 to 12 kcal/kg.
Fix: grate wear measurement each inspection
Grinding Mill Liners
Electrical
Wear
Worn liners and off-spec media charge can push mill power 15 to 20 percent above design kWh/tonne with no visible change in output.
Fix: liner and charge audit on schedule
Kiln Refractory & Shell
Thermal
Radiation
Thinning refractory raises shell surface temperature and radiant heat loss — rarely alarmed, but clear once shell temperature is tracked against baseline.
Fix: thermal scan trend tracking
Burner & Combustion Air
Thermal
Combustion
Burner misalignment and excess combustion air raise exhaust heat loss well before flame shape looks visibly wrong on a routine inspection.
Fix: excess air and flame audit
Separator & Fan System
Electrical
Airflow
Separator inefficiency and fan damper drift force mills to over-grind and re-circulate material, adding kWh per tonne without adding capacity.
Fix: separator efficiency check
The SEC Diagnostic Stack: How Leaks Get Fixed
01
Capture an Asset-Specific Baseline
Record kiln thermal SEC, mill power draw, and cooler heat recovery for 60 to 90 days of normal operation — this baseline is what every future reading gets measured against.
02
Track SEC Continuously, Not Monthly
Daily exhaust temperature, mill kWh/tonne, and cooler discharge temperature reveal drift in days rather than weeks, before it compounds into a full percentage-point loss.
03
Link Deviation Directly to a Work Order
A reading that crosses the baseline threshold should generate a task automatically — refractory inspection, liner check, seal replacement — instead of sitting in a spreadsheet.
04
Report the Margin Impact, Not Just the Metric
Translate every kcal/kg and kWh/tonne deviation into a cost figure so energy performance is discussed in the same terms as production cost.
SEC Benchmark Reference by Process Stage
| Process Stage |
Industry Benchmark |
Typical Underperformer |
Margin Impact |
| Kiln thermal SEC |
680–750 kcal/kg clinker |
850–950 kcal/kg clinker |
High — direct fuel cost |
| Cement/raw mill power |
32–38 kWh/t (VRM) |
70–85 kWh/t (worn ball mill) |
High — 38–42% of electrical bill |
| Cooler heat recovery |
Secondary air near design temp |
50°C+ below design |
Medium — 8–12 kcal/kg per 50°C |
| False air level |
Under 3% at preheater |
5–8% between shutdowns |
Medium — compounding heat loss |
How Oxmaint Closes the SEC Gap
Platform Overview
Four capabilities separate plants that catch SEC drift early from plants that discover it on a monthly report — continuous baseline tracking, automatic threshold-to-work-order routing, cross-asset condition history, and cost translation that speaks the plant manager's language. Oxmaint delivers all four through one connected asset record.
Asset-Specific Baselines
Auto Work Orders
Condition History
Cost-Per-Tonne Reporting
01
Continuous Baseline Tracking
60–90 day baseline · statistically calibrated per asset
Oxmaint records normal operating signatures for each kiln, mill, and cooler individually, so deviation alerts are based on that asset's own history rather than a generic industry threshold.
02
Automatic Work Order Generation
Under 8 minutes · anomaly to assigned task
A threshold breach on kiln exhaust temperature or mill power draw routes straight to a work order with full asset history attached — no manual translation from a reading to an action.
03
Cross-Asset Condition History
One record per asset · sensor and maintenance combined
Vibration, thermal, and oil analysis readings sit next to the maintenance log for the same asset, so a technician sees the full context before responding to an alert.
04
Cost-Per-Tonne Reporting
kcal/kg and kWh/t translated into dollars
Every SEC deviation is reported alongside its estimated cost impact, so plant managers can prioritize fixes the same way they prioritize any other capital decision.
Savings Potential From Maintenance-Driven Correction
False air sealing at every shutdown
6–8%
Cooler grate and air beam maintenance
8–10%
Mill liner and media renewal on schedule
10–12%
Full maintenance-driven SEC program combined
10–15%
Frequently Asked Questions
Why does SEC drift stay hidden for so long on a normal shift log?
Is SEC really a maintenance issue rather than an energy management issue?
Most SEC drift traces back to a physical cause — worn liners, degraded refractory, leaking seals, fouled cyclones — so fixing the number usually means fixing the equipment condition behind it.
How quickly can a plant start tracking SEC against a real baseline?
A 60 to 90 day monitoring window is enough to establish an asset-specific baseline for kiln thermal SEC and mill power draw, after which deviation alerts can generate work orders automatically.
Does this require new sensors, or can existing instrumentation be used?
What is a realistic SEC improvement target for a plant new to this approach?
Plants starting a maintenance-driven SEC program typically see a 10 to 15 percent reduction in unplanned energy waste within 12 to 18 months, concentrated in false air, cooler recovery, and grinding efficiency.
SEC Is a Maintenance Number Before It Is an Energy Number
Oxmaint connects kiln, mill, and cooler condition data to a live SEC baseline — turning fuel and power drift into a scheduled work order instead of a line in next month's report.