Delivery companies live and die by two numbers: SLA compliance and vehicle uptime. Miss your delivery windows and you lose contracts. Lose a vehicle to an unplanned breakdown and you lose both. The frustrating truth is that most fleet operators have all the data they need to prevent these failures — they just lack the system to turn it into decisions. AI fleet analytics closes that gap, converting raw telematics, maintenance records, and route data into real-time intelligence that keeps vehicles running and SLAs met, every single day.
Commercial + Analytics · Delivery Operations Management
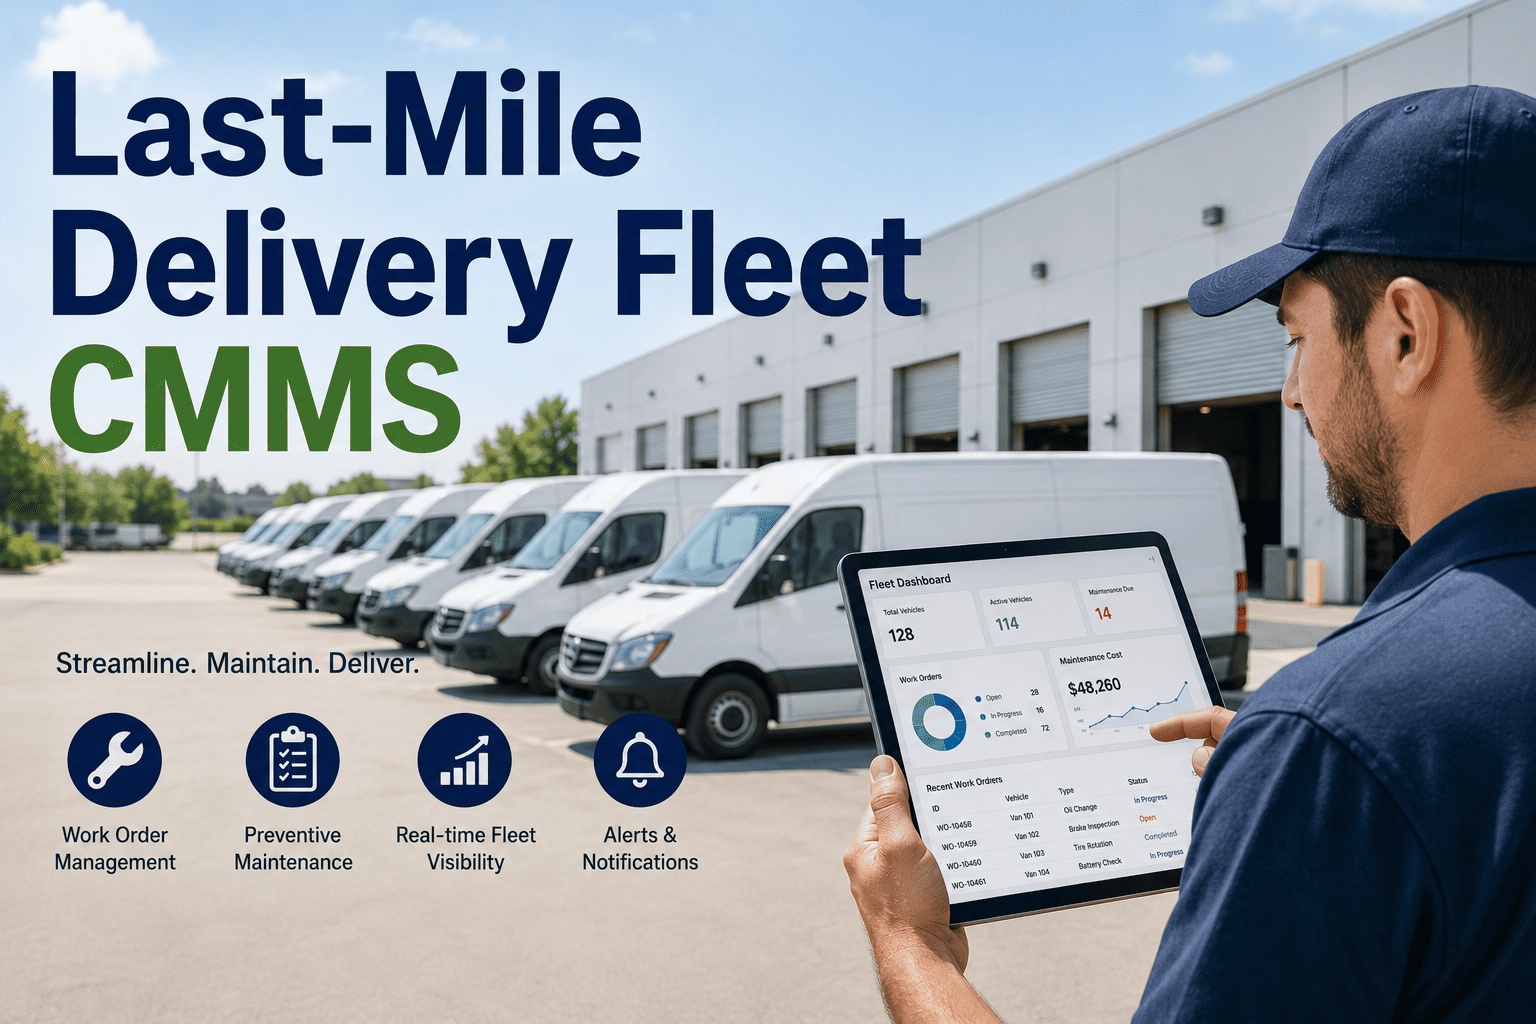
AI Fleet Analytics for Delivery Companies: Improve SLA and Uptime
How delivery operations use AI-powered fleet analytics to predict failures before they happen, optimize routes in real time, and hit SLA targets consistently — at any fleet size.
23%
Average SLA improvement for fleets using AI-driven analytics vs. manual dispatch
$260B
Annual cost of logistics inefficiency in the US delivery sector
41%
Reduction in unplanned vehicle downtime with predictive fleet analytics
18%
Average fuel cost reduction through AI route and load optimization
Why Traditional Fleet Management Falls Short on SLA
01
Reactive breakdowns kill SLA windows
When a vehicle fails mid-route, the delivery window is already missed. No dispatch scramble can recover a late SLA once the clock has run. Traditional fleet management has no mechanism to see failures coming — so it responds after the damage is done.
02
Static routes ignore real-world conditions
Pre-planned routes are built on yesterday's data. Traffic incidents, weather delays, unexpected stops, and delivery time changes happen hourly — but static dispatch systems cannot adapt in real time across a fleet of dozens or hundreds of vehicles.
03
No visibility across the whole fleet at once
Fleet managers using dashboards, spreadsheets, and phone calls cannot see every vehicle's real-time status simultaneously. Decisions get made on incomplete information — and the SLA misses pile up in the gaps between what managers know and what is actually happening on the road.
04
Maintenance records disconnected from operations
When maintenance data lives in a separate system from dispatch — or on paper — no one can connect the dots between a vehicle's service history and its reliability on today's route. The result is high-risk vehicles getting dispatched because no one had the context to flag them.
The data to fix this already exists in your fleet
OxMaint centralizes maintenance records, vehicle condition data, and inspection history — giving AI analytics the foundation it needs to predict failures and protect your SLA commitments.
What AI Fleet Analytics Actually Does
Data Inputs
Vehicle telematics — GPS, speed, idle, fuel
IoT engine sensors — temp, vibration, oil, brakes
Maintenance records and service history
Driver behavior — acceleration, braking, cornering
Route completion data and delivery timestamps
Traffic, weather, and external condition feeds
AI Analytics Engine
Pattern recognition · Predictive modeling · Real-time optimization
Continuous processing
Intelligence Delivered
Failure prediction — 1 to 4 weeks ahead
Dynamic route adjustment in real time
SLA risk alerts before windows are missed
Automated PM work orders on condition triggers
Driver performance scores and coaching flags
Fleet uptime and cost forecasting by vehicle
The Five AI Analytics Capabilities That Directly Impact SLA
01
Predictive Maintenance Alerts
AI analyzes sensor data from each vehicle to identify degradation patterns that precede failure — brake wear, bearing vibration, coolant temperature drift, oil viscosity change. Alerts are generated days or weeks before a failure event, allowing maintenance to be scheduled during off-peak hours rather than interrupting active delivery routes.
SLA impact: Eliminates mid-route breakdowns that make SLA recovery impossible
02
Real-Time Route Optimization
The analytics engine continuously recalculates optimal routes across the entire fleet as conditions change — traffic incidents, weather, delivery time updates, and vehicle capacity. Rerouting happens automatically, pushing updated instructions to affected drivers before the delay impacts the delivery window.
SLA impact: Recovers time before windows close, not after
03
SLA Risk Scoring per Delivery
Every active delivery receives a real-time SLA risk score based on current vehicle position, traffic conditions, remaining stops, driver pace, and time window. Deliveries approaching SLA risk thresholds are flagged automatically — giving dispatchers the alert and context needed to intervene before a miss is recorded.
SLA impact: Turns missed SLAs from surprises into preventable events
04
Fleet Uptime Forecasting
AI models the remaining useful life of major components across every vehicle simultaneously — generating a forward-looking uptime forecast that tells fleet managers which vehicles are high-risk for the next 30, 60, and 90 days. Dispatch decisions incorporate reliability probability, not just availability.
SLA impact: High-risk vehicles are proactively serviced before being put on SLA-critical routes
05
Driver Performance Analytics
The platform scores each driver on fuel efficiency, route adherence, delivery timing accuracy, braking behavior, and stop time. Underperformance patterns that consistently produce SLA misses are identified automatically — making coaching conversations data-driven rather than anecdotal.
SLA impact: Human behavior patterns causing delivery delays are identified and corrected
SLA Performance: Before vs. After AI Fleet Analytics
| Performance Metric | Without AI Analytics | With AI Fleet Analytics |
|---|---|---|
| On-Time Delivery Rate | 72–81% (industry average) | 92–96% consistently |
| Unplanned Breakdowns per Month | 4–8 events per 50-vehicle fleet | Under 1 event per 50-vehicle fleet |
| SLA Breach Response Time | After customer complaint — too late | Flagged 30–90 minutes before breach |
| Fuel Cost per Route | Based on static pre-planned routes | Continuously optimized — 15–20% lower |
| Maintenance Cost per Vehicle | Reactive — highest cost per repair | Predictive — 25–35% lower annually |
| Fleet Manager Decision Speed | Hours — limited by manual data gathering | Seconds — AI surfaces the right data instantly |
The Fleet Analytics Maturity Model
Level 1
Descriptive
What happened? GPS tracking, mileage logs, basic delivery records. No predictive value — tells you where things went wrong after the fact.
Reactive only
Level 2
Diagnostic
Why did it happen? Reporting dashboards that identify patterns — which vehicles fail most, which routes miss SLA, which drivers lag. Still backward-looking.
Pattern identification
Level 3
Predictive
What will happen? ML models predict failures, SLA risk, and uptime windows before they occur. Maintenance is condition-triggered. Dispatch becomes risk-informed.
Most impactful leap
Level 4
Prescriptive
What should we do? AI recommends the optimal action — which vehicle to dispatch, which route to adjust, which maintenance to prioritize — across the full fleet simultaneously.
Decision automation
Level 5
Autonomous
AI acts. Work orders auto-generated, routes dynamically adjusted, dispatch optimized — without manual input. Human oversight governs strategy, not daily decisions.
Self-optimizing fleet
Where Most Fleets Are Today
The majority of delivery fleets operate at Level 1 or Level 2. The jump from diagnostic to predictive delivers the highest single ROI of any analytics investment — but it requires clean, centralized maintenance and telematics data as the foundation. That foundation starts with a digitized fleet CMMS.
Key Analytics KPIs Every Delivery Fleet Should Track
SLA Compliance Rate
Target: 95%+
Percentage of deliveries completed within the contracted time window. The primary commercial metric — SLA breaches trigger penalties, contract reviews, and customer churn. AI analytics targets this directly through predictive rerouting and failure prevention.
Fleet Uptime Percentage
Target: 97%+
Percentage of scheduled operating hours that vehicles are available and operational. Every percentage point of uptime lost translates directly to missed deliveries and route coverage gaps. Predictive maintenance is the primary driver of uptime improvement.
Mean Time Between Failures (MTBF)
Target: Increasing YoY
Average operating time between unplanned mechanical failures per vehicle. Rising MTBF confirms that predictive maintenance is extending vehicle reliability. Declining MTBF signals aging fleet, inadequate PM, or increasing demand intensity.
Cost per Delivery
Target: Decreasing YoY
Total operating cost — fuel, maintenance, driver time, overhead — divided by delivery volume. AI route optimization and predictive maintenance together directly reduce both numerator components, compounding cost improvement over time.
Planned vs. Unplanned Maintenance Ratio
Target: 90%+ planned
Emergency repairs cost 40–65% more than scheduled maintenance and pull vehicles from active routes with no warning. This ratio is the clearest indicator of how effectively predictive analytics is preventing reactive breakdowns across the fleet.
First-Attempt Delivery Rate
Target: 92%+
Percentage of deliveries completed successfully on the first attempt. Failed first attempts double the cost of that delivery and frequently trigger SLA breaches. AI analytics improves this through delivery window optimization and real-time driver guidance.
ROI Snapshot: 50-Vehicle Delivery Fleet, 12 Months
SLA Penalty Avoidance
$280K in annual contract penalties
$22K after AI analytics deployment
$258,000 saved
Maintenance Cost Reduction
$420K reactive maintenance spend
$290K with predictive scheduling
$130,000 saved
Fuel Optimization
$680K annual fuel spend
$560K with route optimization
$120,000 saved
Breakdown Downtime
6.2 breakdown events per month
0.8 events per month
87% reduction
Total Annual Net Benefit
$508,000+
Against typical platform investment of $18,000–$36,000 per year for a 50-vehicle fleet
Key Takeaways: AI Fleet Analytics for Delivery Operations
SLA misses are predictable and preventable: Real-time SLA risk scoring gives dispatchers 30–90 minutes of lead time before a breach — enough to reroute, reallocate, or contact the customer proactively instead of explaining a failure.
Uptime and SLA are the same problem: Every unplanned breakdown during an active route is both a maintenance failure and an SLA failure. Predictive analytics addresses both simultaneously by preventing the breakdown before it disrupts the delivery.
The foundation is clean fleet data — not the analytics platform itself: AI models are only as accurate as the maintenance history, telematics, and inspection data they learn from. Digitizing your fleet CMMS is the prerequisite, not an afterthought.
The ROI compounds at scale: For a 50-vehicle fleet, AI analytics delivers over $500K in annual benefit. For a 200-vehicle fleet, that scales proportionally — and the intelligence improves as more fleet data trains the models over time.
Your Fleet's SLA Performance Starts With the Right Data Foundation
OxMaint gives delivery fleets the maintenance management backbone that AI analytics requires — digitized work orders, vehicle condition history, automated PM scheduling, and real-time inspection logging. Build the data layer that turns your fleet from reactive to intelligent.
Condition-based predictive maintenance
Automated PM by mileage or calendar
Real-time fleet status dashboard
Full analytics-ready maintenance history
Frequently Asked Questions
What is AI fleet analytics for delivery companies?
AI fleet analytics is a data platform that ingests telematics, sensor, maintenance, and delivery records from a delivery fleet — then uses machine learning to identify patterns, predict failures, optimize routes, and score SLA risk in real time. Unlike basic GPS tracking or reporting dashboards, AI fleet analytics is forward-looking: it tells fleet managers what is going to happen and what to do about it before it affects delivery performance or vehicle availability.
How does AI fleet analytics improve SLA compliance rates?
AI analytics improves SLA compliance through three mechanisms working simultaneously. First, predictive maintenance prevents the mid-route breakdowns that make SLA recovery impossible. Second, real-time route optimization continuously recalculates paths to keep active deliveries within their windows despite traffic, weather, and stop-time variability. Third, per-delivery SLA risk scoring alerts dispatchers to at-risk deliveries 30–90 minutes before a breach — providing enough lead time to intervene, reroute, or communicate proactively with the customer.
What data does AI fleet analytics require to function effectively?
Effective AI fleet analytics requires three categories of data: real-time telematics (vehicle GPS, speed, fuel consumption, engine status), IoT sensor feeds (brake wear, vibration, temperature, oil pressure), and historical maintenance records from a fleet CMMS. The maintenance history component is critical and often the bottleneck — fleets without a digitized maintenance management system lack the baseline data that AI models need to learn accurate failure prediction patterns. Starting with a fleet CMMS is the first step toward analytics readiness.
How much does AI fleet analytics reduce vehicle downtime?
Delivery fleets deploying AI-powered predictive maintenance and analytics typically report 35–50% reductions in unplanned vehicle downtime within the first year. For a 50-vehicle fleet averaging 6 unplanned breakdown events per month, this typically means reducing to under 1 event per month — eliminating the route disruptions, emergency towing costs, and SLA failures that each breakdown generates. The reduction compounds over time as the AI model improves its accuracy from accumulated fleet data.
Can smaller delivery fleets under 30 vehicles benefit from AI fleet analytics?
Yes. For smaller fleets, the highest-value capabilities are predictive maintenance and SLA risk alerting — not the enterprise-scale route optimization features designed for 200+ vehicle operations. A 20-vehicle delivery fleet that eliminates 2–3 unplanned monthly breakdowns, reduces maintenance costs by 25%, and improves on-time delivery from 80% to 93% generates ROI well above platform cost. The starting point for any fleet size is the same: digitize maintenance records into a CMMS and start building the data foundation that AI analytics learns from.