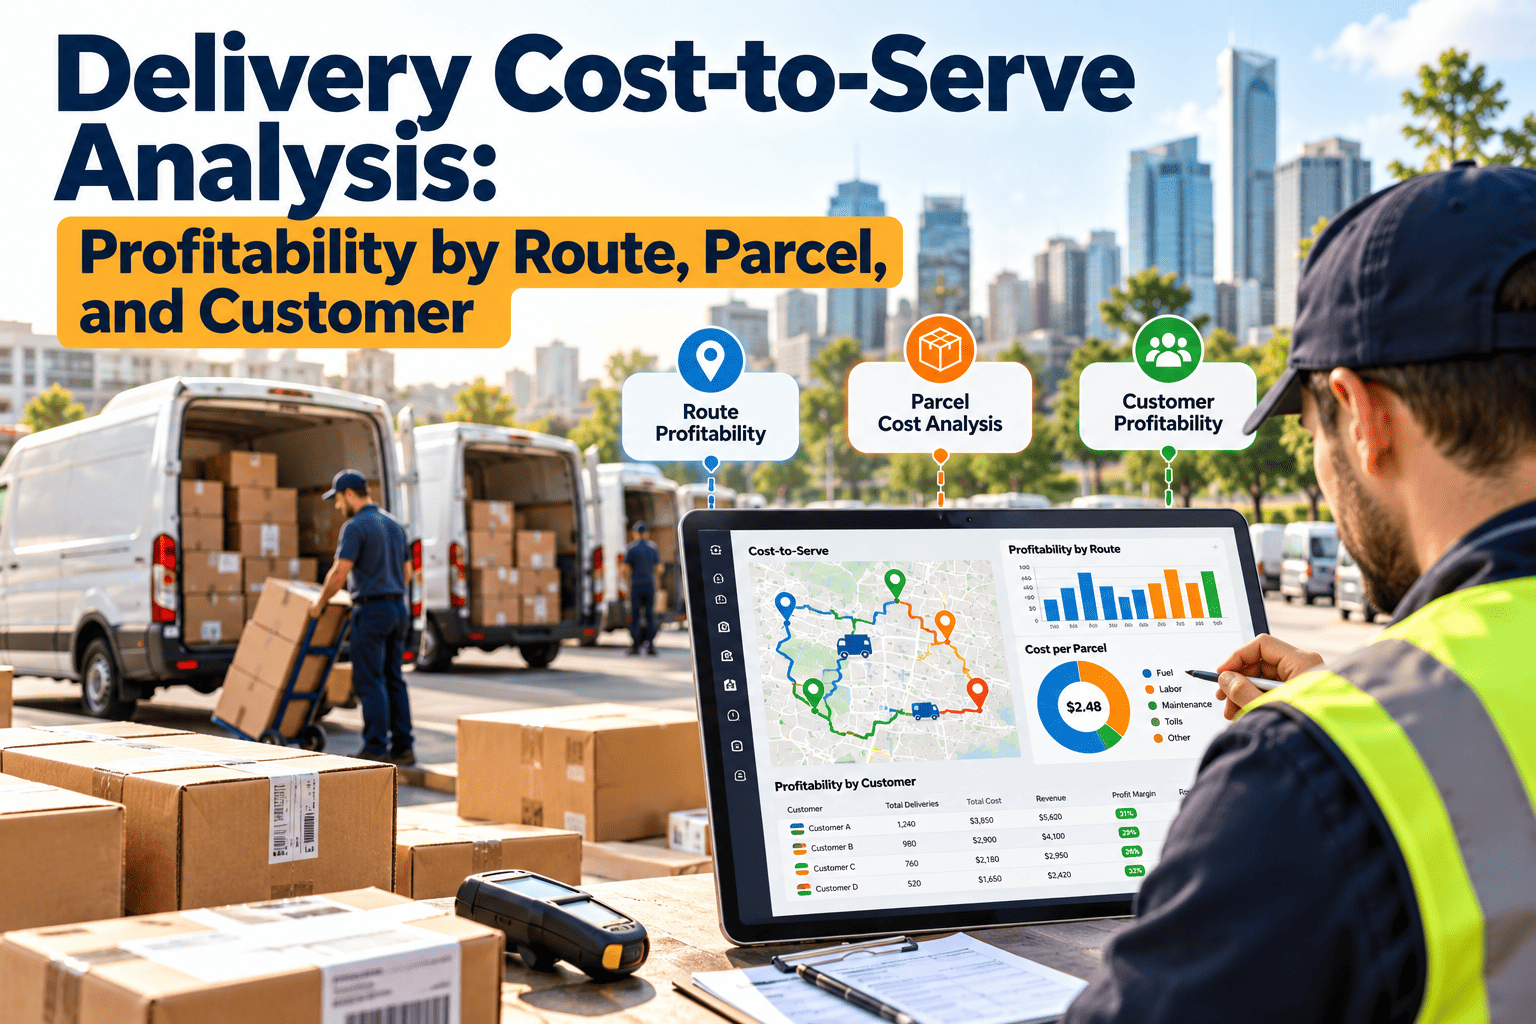
Average cost per delivery is a comfortable number and a misleading one. It hides the long rural route, the high-return customer, the oversized parcel, and the window that forces a half-empty van onto the road. Cost-to-serve analysis breaks the average apart so you can see which routes, parcels, and customers earn a margin and which quietly lose it. This guide explains how to build a delivery cost-to-serve model, segment profitability, and act on the result, including how maintenance management software supplies the vehicle cost data the model needs.
Delivery Cost-to-Serve Analysis: Profitability by Route, Parcel, and Customer
Find the routes, customers, and orders that lose money, and decide what to change with a cost model built on real activity data.
Average Cost Versus True Cost to Serve
Cost to serve measures the full cost of delivering to a specific customer, route, or order. It assigns cost to the activities each one actually causes, not to an even share of the total.
The gap between the two is where cross-subsidy lives. Profitable customers silently pay for unprofitable ones until someone measures it.
The Three Levels of Analysis
Start at the route level, where data is easiest to obtain, then add parcel and customer detail as the model matures.
Why Some Deliveries Lose Money
| Cost driver | What causes it | Typical symptom |
|---|---|---|
| Low delivery density | Remote or scattered addresses | High cost per stop and long drive time |
| Narrow time windows | Customer-specified slots that fragment routes | Part-loaded vans and idle time |
| Failed first attempts | Access issues, absent recipients, poor address data | Repeat visits and extra contacts |
| High returns | Fit, quality, or expectation gaps | Reverse logistics cost exceeds forward cost |
| Bulky or heavy parcels | Two-person handling, special vehicles | Slow stops and higher damage risk |
| Heavy customer contact | Many status requests or changes | Support cost per order is high |
| Special handling terms | Signature, scheduled calls, building rules | Longer service time per stop |
| Vehicle downtime | Breakdowns and unplanned repairs | Rescue runs and overtime |
Add Reliable Vehicle Cost Data to Your Model
Vehicle repairs, downtime, and service history belong in your cost to serve. Track them per asset with Oxmaint.
Building a Delivery Cost-to-Serve Model
Allocation Methods Compared
| Method | How it works | Strength | Limit |
|---|---|---|---|
| Simple average | Total cost divided by total deliveries | Easy and fast | Hides all variation |
| Zone-based average | Average cost within each delivery zone | Captures geography | Misses customer and parcel differences |
| Time-based | Cost allocated by minutes spent on each stop | Reflects service effort | Needs reliable stop timestamps |
| Activity-based costing | Each activity costed by its own driver | Most detailed and actionable | Needs more data and upkeep |
Most operations get good results by starting with zone and time-based allocation, then refining only where the numbers suggest large differences.
Data Sources You Will Need
Segmenting Customers by Profitability
Plot customers by order volume and margin after cost to serve. Each quadrant suggests a different response.
Turning Analysis Into Action
| Finding | Possible response | Trade-off |
|---|---|---|
| Remote zone loses money | Surcharge, scheduled delivery days, or pickup points | May reduce volume in that zone |
| Customer with high failed attempts | Improve address data, add notifications, change delivery method | Needs customer cooperation |
| High-return account | Review return policy or add return fees | Can affect customer relationship |
| Narrow windows fragment routes | Price premium windows or offer flexible discounts | Customers may resist change |
| Bulky parcels underpriced | Add size-based pricing | Requires contract updates |
| Vehicle downtime inflating route cost | Improve preventive maintenance and replace problem assets | Needs maintenance investment |
| Network inefficiency | Redesign zones, depots, or carrier allocation | Longer-term project |
Treat each response as a test. Change one variable, measure again, and keep what improves margin without damaging service.
Maintenance Cost Is Part of Cost to Serve
Vehicle upkeep is often spread across the fleet as a single overhead line. That hides which routes and which vehicles drive repair spend.
- Repair cost split evenly across routes
- Old vans look the same as new ones
- Downtime cost is invisible
- No link between route type and wear
- Repair and service cost tied to each vehicle
- Costly vehicles identified for replacement
- Downtime hours available for route cost
- Rough routes matched with higher wear
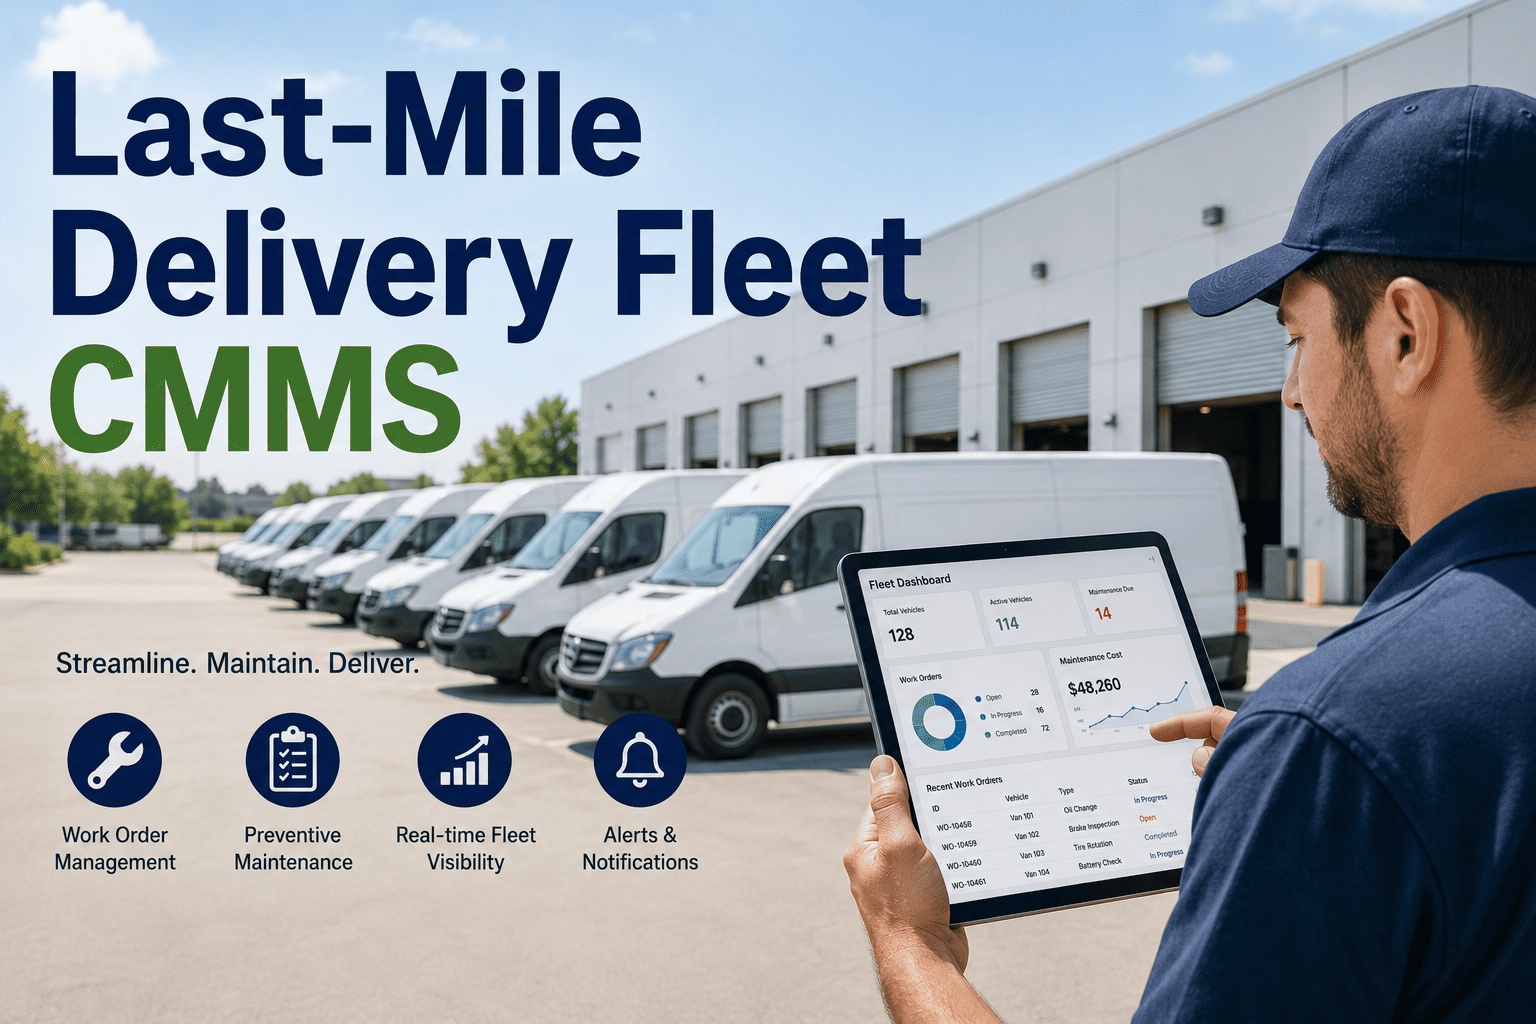
Oxmaint is maintenance management software, so it supplies this vehicle cost layer to your model. It does not calculate customer profitability.
- Asset records with repair and service history for every vehicle.
- Work orders capturing labor, parts, and downtime for each repair.
- Preventive maintenance schedules that reduce unplanned breakdowns.
- Inspection records that show recurring faults before they cause route disruption.
- Reports on maintenance cost per vehicle that finance can allocate to routes.
KPIs for a Cost-to-Serve Program
| KPI | Purpose |
|---|---|
| Cost to serve per stop, by zone | Shows geographic profitability |
| Margin per customer after delivery cost | Identifies accounts to renegotiate |
| Failed-attempt cost per order | Quantifies waste from access and data problems |
| Return cost as a share of revenue | Flags high-return segments |
| Share of customers with negative margin | Measures size of the cross-subsidy |
| Maintenance cost per route kilometer | Links asset cost to route cost |
Common Pitfalls
Cost-to-Serve Questions
A Small Worked Example
The numbers below are hypothetical and only show the mechanics. Two customers place the same number of orders each month, yet their economics differ.
| Item (per month) | Customer A: urban, one drop point | Customer B: remote, many attempts |
|---|---|---|
| Orders | 100 | 100 |
| Net revenue | 1,500 | 1,500 |
| Product and handling cost | 900 | 900 |
| Route cost per order | 2.00 | 6.50 |
| Failed attempts and redeliveries | 0.20 per order | 1.40 per order |
| Support contacts cost per order | 0.10 | 0.60 |
| Margin after delivery cost | Positive, about 3.70 per order | Negative, about 6.50 per order lost |
Both look identical on an average-cost report. Only an activity-based view separates them, and only then can pricing or terms be addressed for Customer B.
Cost to Serve by Delivery Channel
Channel choice changes cost to serve more than almost any other lever. Compare channels on the same basis.
| Channel | Cost strengths | Cost risks |
|---|---|---|
| Home delivery | Convenient, flexible for customers | High stop cost, failed attempts, narrow windows |
| Parcel locker or pickup point | Consolidates stops, reduces failures | Locker upkeep, customer collection behavior |
| Scheduled neighborhood day | Raises density | Less flexibility for customers |
| Carrier or partner network | Reduces fixed cost | Less control, harder to see cost drivers |
| Store or hub collection | Uses existing locations | Handling cost at the site |
Shifting a share of orders to lower-cost channels can improve margin, as long as customers still accept the option.
Allocating Shared Costs Fairly
Some costs cannot be traced to one route or customer. A clear rule prevents arguments later.
- Depot rent and utilities: allocate by volume handled or floor space used.
- Dispatch and planning labor: allocate by number of routes or stops planned.
- Technology and software: allocate by active users or transactions.
- Fleet overhead and insurance: allocate by vehicle days or distance, then by route.
- Management overhead: keep it separate from route cost unless leadership wants a fully loaded figure.
Write the rules down and review them annually. Consistency matters more than perfection when comparing periods.
Who Owns the Model
A named owner and a monthly review meeting keep the model from becoming a one-time project.
Presenting Results to Leadership
- Show the average cost per delivery first, so everyone starts from the familiar number.
- Reveal the spread: best and worst zones, customers, and parcel types.
- Quantify the cross-subsidy as the margin earned by profitable segments that is lost by unprofitable ones.
- Propose three actions, each with an owner, an expected effect, and a way to measure it.
- Agree a review date and the data that will show whether the change worked.
Leaders respond to specific, testable proposals more than to a long list of findings.
Data Quality Checklist Before You Trust the Numbers
- Every stop has a timestamp for arrival and completion, not only for route start and end.
- Failed attempts are coded with a reason, such as no access, absent recipient, or wrong address.
- Returns are linked to the original order and customer.
- Carrier invoices are matched to delivered parcels, including surcharges and adjustments.
- Vehicle costs are recorded against the correct asset and month.
- Customer identifiers are consistent across order, delivery, and support systems.
Fix the weakest data source first. One poor input, such as missing stop times, can distort every route comparison.
Quick Wins in the First 30 Days
Trends Changing Delivery Cost Analysis
- More granular data: route and stop events are now available in near real time, which allows daily cost views.
- Customer pressure on delivery fees: shoppers compare shipping charges, which makes accurate cost knowledge valuable in pricing.
- Returns growth: reverse logistics is becoming a major cost driver in many parcel segments.
- Channel diversification: lockers, pickup points, and carrier partners all need separate cost lines.
- Fleet electrification: charging, battery, and maintenance costs change vehicle cost per kilometer and must be added to the model.
- Sustainability reporting: distance and emissions per delivery are increasingly reported, and the same route data can serve both cost and carbon analysis.
- Service differentiation: operators use cost-to-serve results to design paid premium options, such as narrow windows, instead of absorbing their cost.
Give Your Cost Model Real Vehicle Data
Cost to serve is only as accurate as its inputs. Use Oxmaint to track repairs, downtime, and preventive maintenance for every vehicle behind your routes.