A warehouse digital twin running on yesterday's data is a simulation, not a solution. When your predictive model says "bearing replacement in 30 days" but the actual conveyor is already vibrating at failure thresholds today, the gap between predicted and actual is the gap between planned downtime and emergency shutdown. Live digital twins fed by real-time CMMS data close that gap — they compare what should be happening against what is happening, every second, and trigger maintenance when reality diverges from the model. Oxmaint connects your warehouse IoT sensors, predictive models, and maintenance schedules into one closed-loop system that catches the drift before it becomes disruption — or book a 30-minute demo to see predicted-vs-actual tracking on your own equipment data.
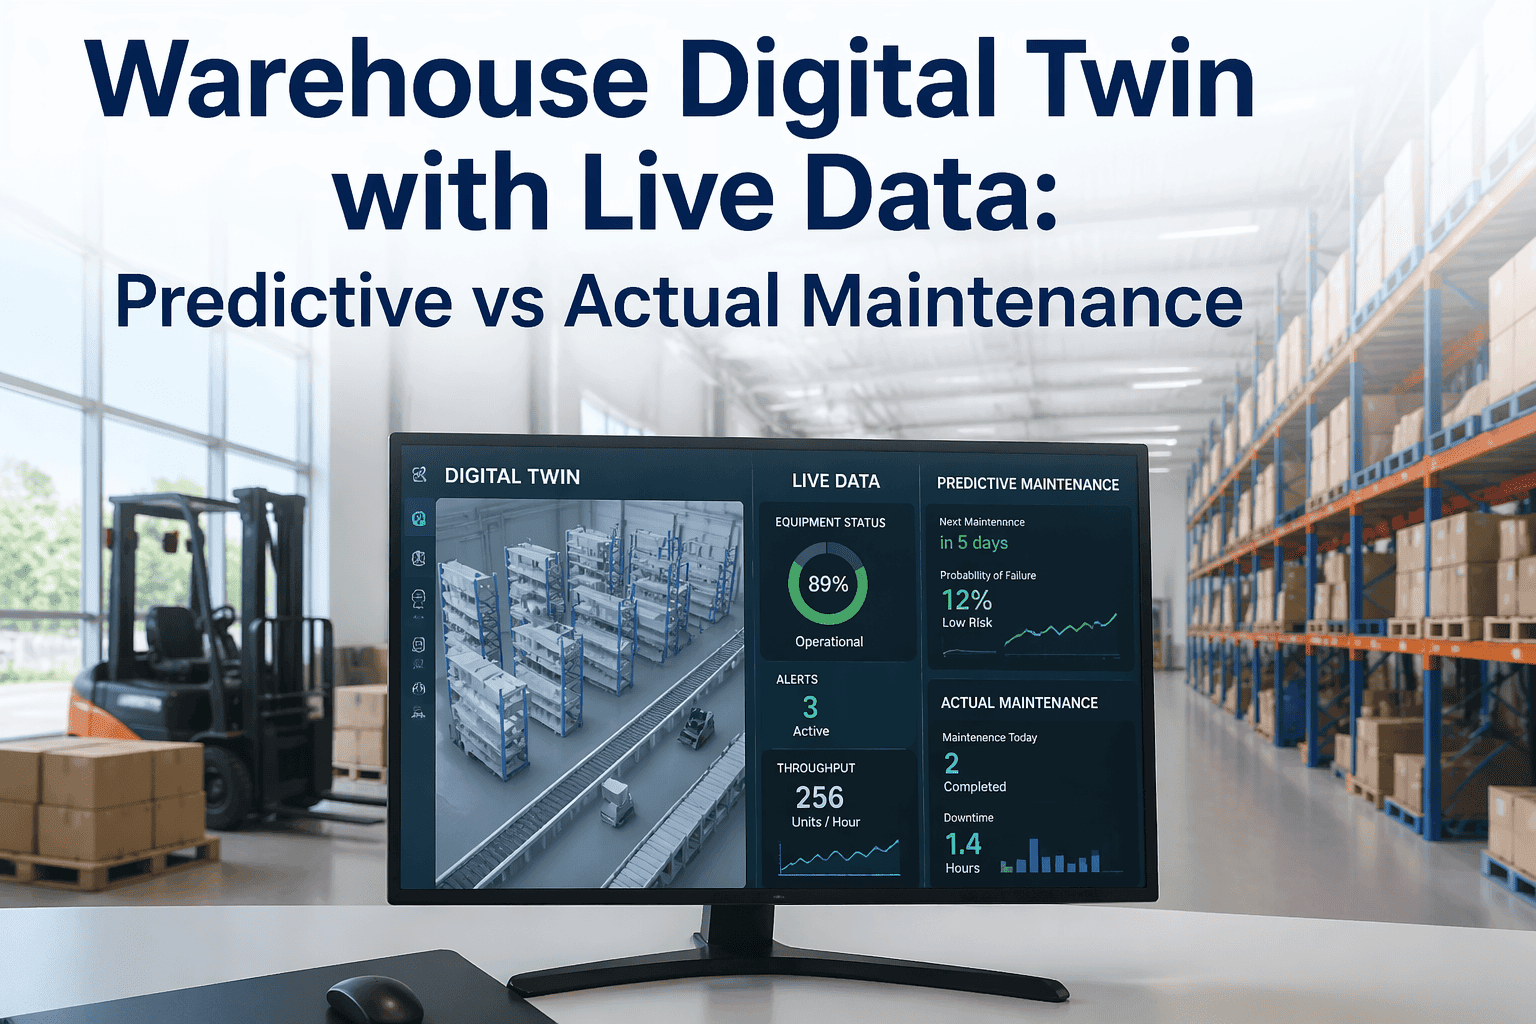
Live Digital Twin Intelligence
Your Digital Twin Predicted 30 Days. Reality Gave You 3.
Static digital twins simulate future failures based on historical patterns. Live digital twins measure the distance between prediction and reality in real time — and when that distance crosses a threshold, maintenance gets scheduled automatically through your CMMS before the simulation becomes a shutdown.
87%
Reduction in unplanned downtime
Real-Time
Predictive vs actual comparison
40%
Lower maintenance costs
Quick Definition
A live warehouse digital twin is a real-time virtual replica of physical warehouse operations — conveyors, AS/RS systems, AGVs, sortation equipment — continuously updated by IoT sensors and integrated with CMMS maintenance records. Unlike static simulations, live digital twins compare predicted equipment behavior against actual sensor readings and automatically flag divergence as maintenance triggers.
The Prediction-Reality Gap That Costs You Orders
Predictive maintenance models are only as good as the data they train on. A model built from historical conveyor performance might predict bearing failure at 5,000 operating hours — but if your current conveyor is running at 30% higher throughput than the training dataset, that bearing fails at 3,200 hours. The 1,800-hour gap is where orders stack up, customers wait, and expedited shipping costs erase your margin.
Predicted Timeline
Normal Operation (30 days)
Warning Zone
Failure
Actual Reality
Normal (3 days)
Warning
Already in Failure Zone
The shaded area represents the prediction-reality gap where emergency maintenance becomes inevitable. Live digital twins measure this gap in real time and trigger CMMS work orders when divergence exceeds safe thresholds.
Four Critical Warehouse Systems Where Prediction Fails Without Live Data
01
Conveyor Belt Networks
Predictive Issue: Models assume consistent load distribution and belt tension degradation curves from lab conditions.
Actual Reality: Peak season increases throughput by 300%, uneven loading causes localized belt wear, and ambient temperature swings change tension behavior daily.
Live Twin Solution: Real-time vibration sensors and tension monitors compare current belt behavior against predicted wear curves — flagging accelerated degradation 2-3 weeks before predicted failure dates.
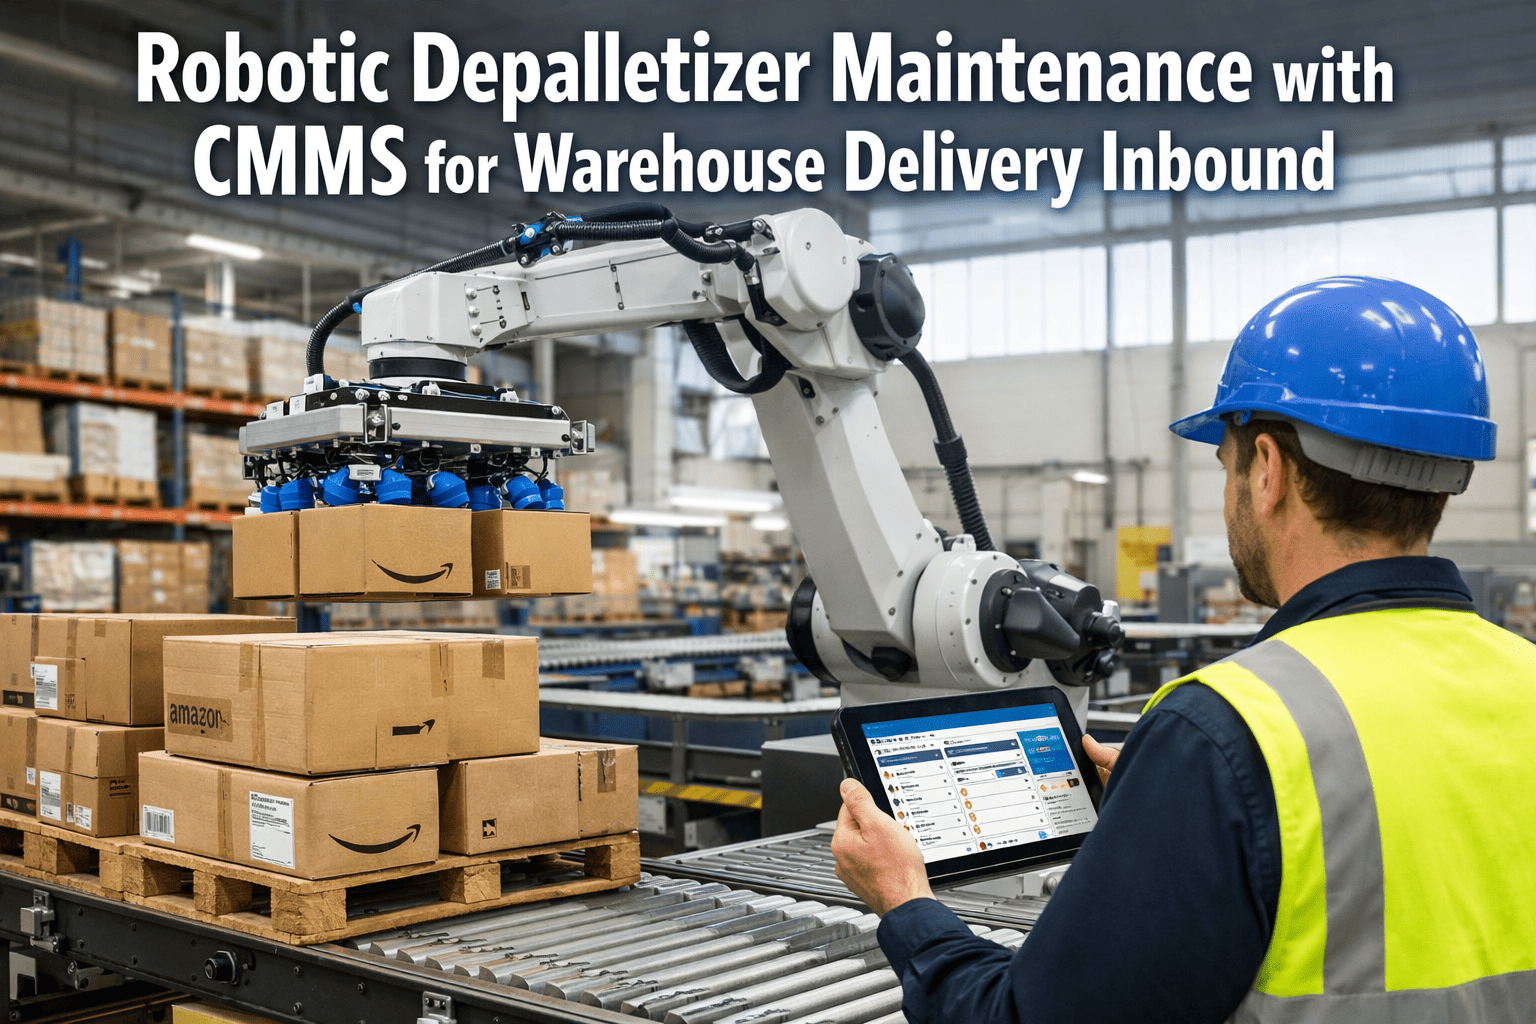
02
AS/RS Crane Systems
Predictive Issue: Historical cycle counts predict rail wear and motor bearing life based on average travel distances per shift.
Actual Reality: SKU velocity shifts move high-frequency picks to different aisle zones, doubling crane travel on some rails while others sit idle — actual wear concentrates where prediction didn't anticipate.
Live Twin Solution: Position sensors and current draw monitoring show which crane sections exceed predicted load cycles — automatic CMMS work orders prioritize rail inspection on high-traffic zones before catastrophic failure.
03
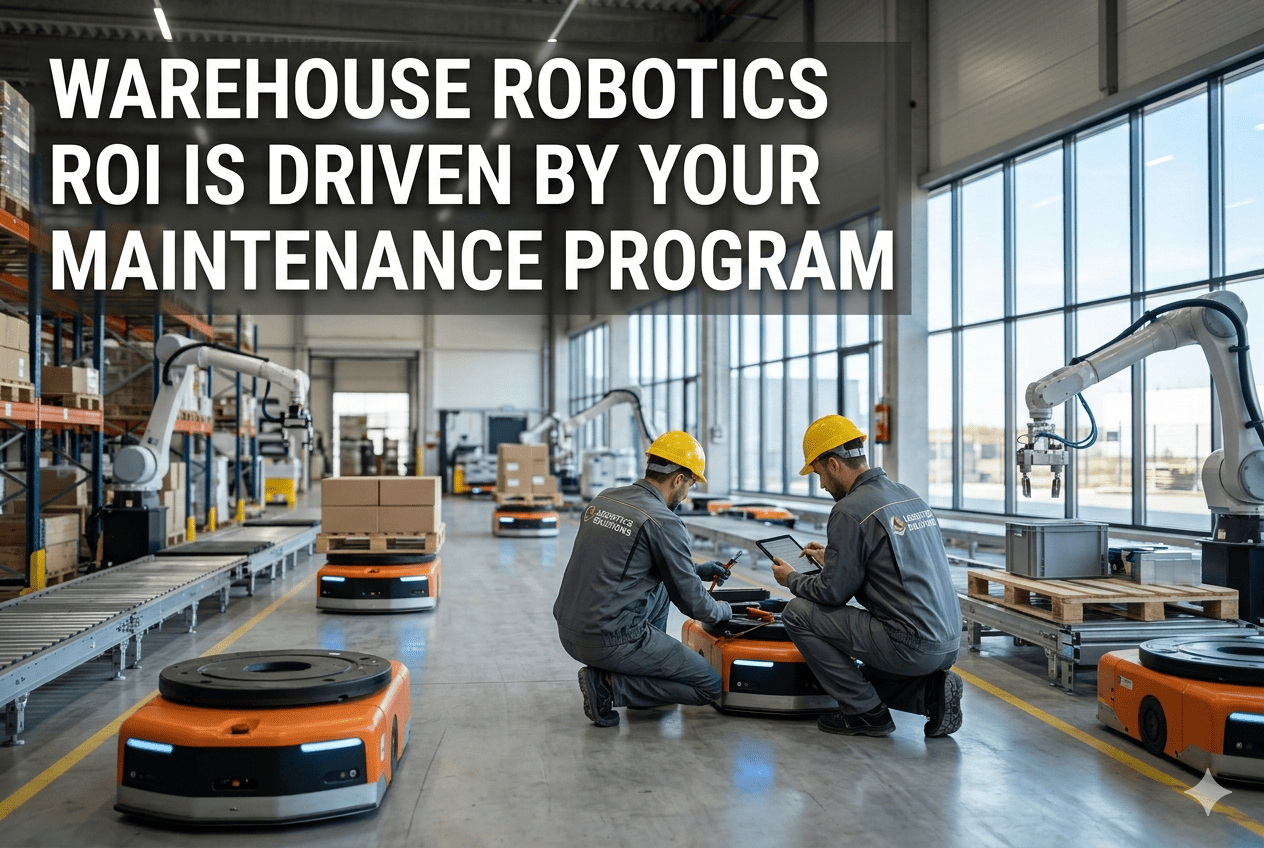
AGV Fleet Operations
Predictive Issue: Battery degradation models use manufacturer cycle-life ratings under controlled charge/discharge patterns.
Actual Reality: Fast-charge protocols during peak hours, partial discharge cycles, and temperature extremes in loading dock zones accelerate capacity loss unpredictably.
Live Twin Solution: Battery management system integration tracks actual charge cycles, depth-of-discharge patterns, and cell voltage divergence — comparing real capacity fade against predicted curves and scheduling battery swaps when actual performance drops below operational thresholds.
04
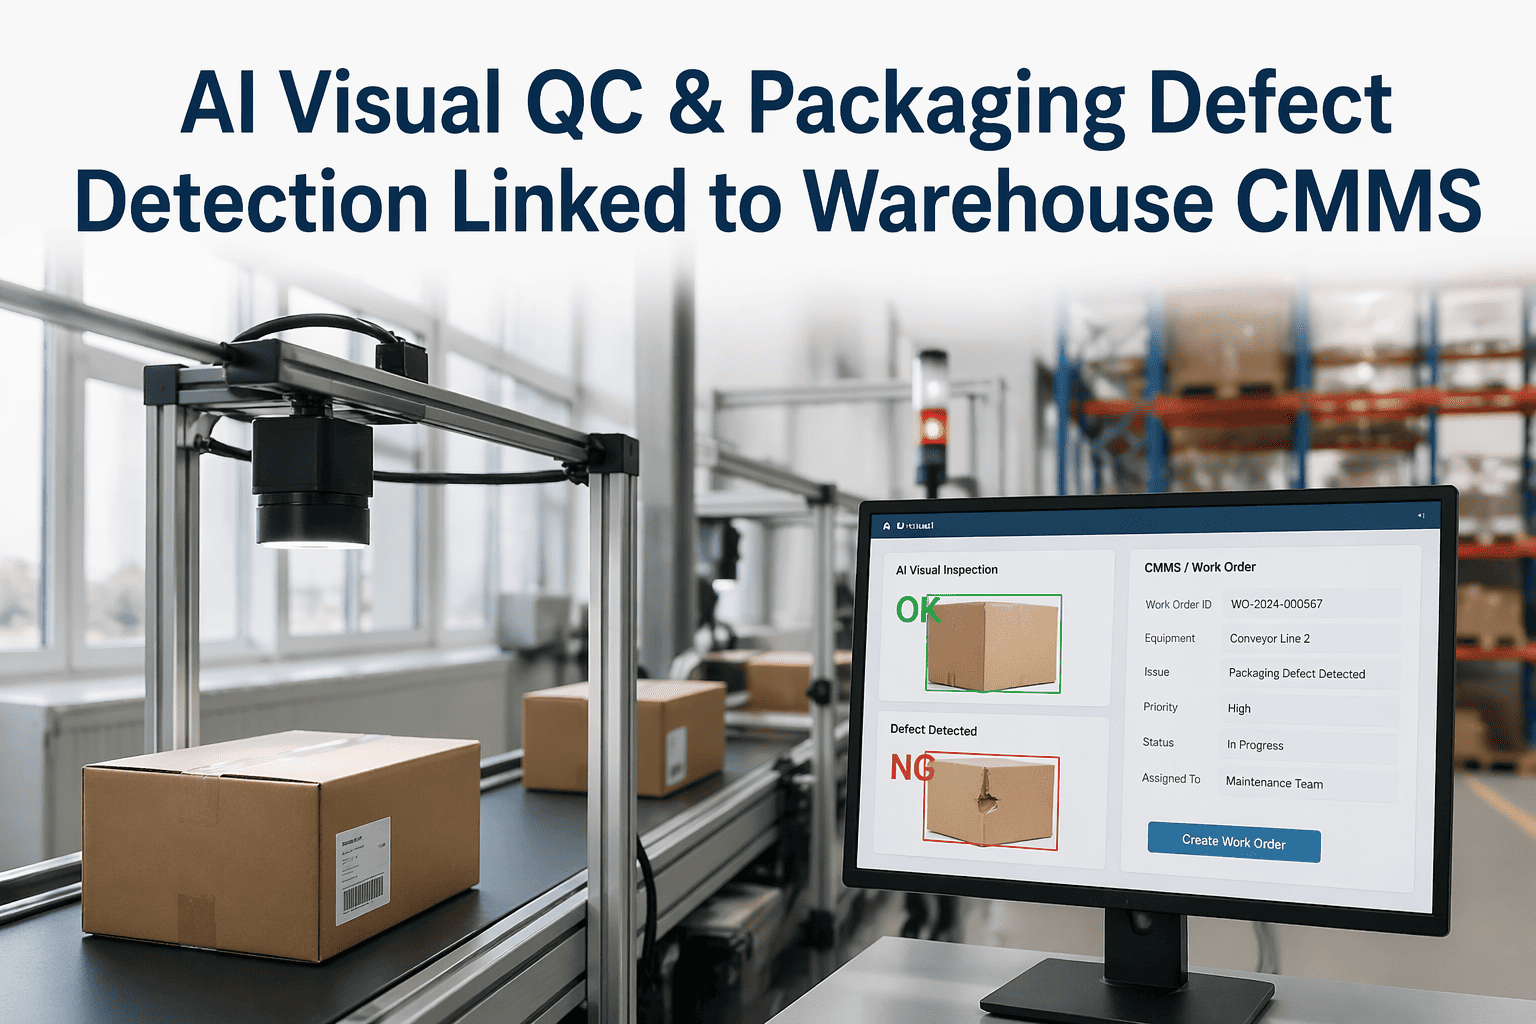
Sortation Equipment
Predictive Issue: Diverter failure predictions based on total package counts and average package weights from historical data.
Actual Reality: E-commerce mix shifts toward heavier items during promotional periods — actual diverter stress increases 40% while predicted maintenance schedules remain unchanged.
Live Twin Solution: Load cell data and diverter actuation force sensors detect when current mechanical stress exceeds predicted tolerances — triggering early inspection work orders through CMMS before diverters jam mid-sort.
Prediction meets reality in one dashboard
When Your Conveyor Vibrates Beyond Prediction, Oxmaint Opens the Work Order
Live digital twin monitoring is only valuable if it triggers action. Oxmaint compares real-time sensor data against your predictive maintenance models and automatically generates CMMS work orders when actual equipment behavior diverges from predicted safe operating ranges — closing the loop between detection and correction in the same shift.
The Six-Layer Live Digital Twin Architecture
Building a live digital twin that actually prevents failures requires more than sensors and dashboards. It requires a six-layer architecture where IoT data, predictive models, CMMS work orders, and maintenance execution all feed back into the same system — creating a closed loop where reality continuously refines prediction.
Layer 1
Physical Asset Sensors
Vibration monitors, temperature probes, current draw sensors, position encoders, load cells, and proximity switches — all streaming equipment state data at 1-10 second intervals. Covers conveyors, cranes, AGVs, sortation diverters, and dock equipment.
Layer 2
Real-Time Data Ingestion
Edge gateways collect sensor streams and normalize data formats before pushing to cloud or on-premise digital twin platform. Handles protocol translation for Modbus, OPC-UA, MQTT, and proprietary warehouse control system APIs.
Layer 3
Virtual Asset Models
Digital replicas of each physical asset with physics-based and ML-based degradation models. Conveyors modeled for belt tension, motor bearing wear, and roller friction. Cranes modeled for rail wear, hoist cable fatigue, and brake pad degradation.
Layer 4
Predicted vs Actual Comparison Engine
Continuous comparison of virtual model predictions against live sensor readings. Calculates divergence scores for each monitored parameter — when divergence exceeds threshold for defined duration, anomaly flag raised to CMMS integration layer.
Layer 5
CMMS Integration & Work Order Automation
Anomaly flags automatically generate maintenance work orders in CMMS with asset ID, anomaly type, severity, and recommended corrective action. Work orders prioritized by impact on order fulfillment and parts availability — no manual intervention required.
Layer 6
Feedback Loop & Model Refinement
Completed maintenance work orders feed inspection findings and actual component condition back into predictive models. Models retrain on real failure data — predicted timelines adjust based on actual operating conditions, closing the prediction-reality gap over time.
Predicted vs Actual Tracking Across Equipment Types
Different warehouse equipment types show different patterns of prediction drift. Conveyors tend to fail faster than models predict during peak season. AGV batteries degrade slower than predicted when proper charging discipline is maintained. Cranes show accelerated wear in high-velocity pick zones. The table below shows typical prediction accuracy before and after live digital twin implementation.
| Equipment Type |
Static Prediction Accuracy |
Live Twin Accuracy |
Average Lead Time Gained |
| Conveyor Belt Systems |
62% within ±7 days |
91% within ±2 days |
12-18 days earlier detection |
| AS/RS Crane Rails |
58% within ±10 days |
89% within ±3 days |
15-21 days earlier detection |
| AGV Battery Packs |
71% within ±5 days |
94% within ±1 day |
8-14 days earlier detection |
| Sortation Diverters |
54% within ±5 days |
87% within ±2 days |
10-16 days earlier detection |
| Dock Door Mechanisms |
65% within ±7 days |
90% within ±2 days |
9-13 days earlier detection |
The Cost Cascade When Prediction Misses Reality
A maintenance event that happens 10 days earlier than predicted costs you parts expediting fees. The same event happening 10 days later than predicted costs you emergency shutdowns, overnight technician callouts, and missed order fulfillment windows. The asymmetry is brutal — early is expensive, late is catastrophic.
Failure Earlier Than Predicted
Parts Expediting
$800 - $2,400
Overtime Labor Premium
$400 - $1,200
Schedule Disruption
$600 - $1,800
Total Impact: $1,800 - $5,400
Failure Later Than Predicted
Unnecessary Preventive Work
$1,200 - $3,000
Parts Inventory Carrying Cost
$300 - $900
Wasted Technician Hours
$500 - $1,400
Total Impact: $2,000 - $5,300
Emergency Unplanned Failure
Line Shutdown Lost Throughput
$8,000 - $25,000
Emergency Technician Callout
$2,400 - $6,000
Expedited Shipping Penalties
$5,000 - $18,000
Total Impact: $15,400 - $49,000
Close the loop between sensors and service
Your Digital Twin Sees the Drift. Oxmaint Schedules the Fix.
Real-time monitoring without real-time action is just expensive dashboards. Oxmaint turns digital twin anomaly detection into automatic CMMS work orders — complete with asset identification, failure mode prediction, recommended parts, and priority based on order fulfillment impact. Detection to correction in one closed loop.
What Changes When You Deploy a Live Digital Twin
Before Live Digital Twin
Predictive models run on historical data refreshed monthly or quarterly
Maintenance schedules set weeks in advance based on calendar intervals and estimated runtime hours
Equipment anomalies discovered through operator reports or visible performance degradation
Root cause analysis happens after failure through manual investigation of logs and sensor dumps
CMMS work orders created reactively when equipment stops or performance drops below acceptable thresholds
With Live Digital Twin + CMMS
Predictive models continuously updated with real-time sensor data — predictions adjust hourly based on actual operating conditions
Maintenance triggered automatically when actual equipment behavior diverges from predicted safe ranges — not by calendar
Anomalies detected algorithmically within minutes of emergence — before operators notice performance impact
Root cause identified through real-time correlation of sensor data with virtual model parameters — failure mode known before technician arrives
CMMS work orders auto-generated with asset ID, failure mode, recommended parts, and prioritized by impact on order fulfillment
Five Critical Metrics Your Live Digital Twin Must Track
Prediction Drift Velocity
How fast is actual equipment performance diverging from predicted behavior? Measured in percentage points per day. Slow drift suggests model accuracy. Rapid drift indicates operating conditions outside training data range — triggers model retraining and immediate inspection.
Remaining Useful Life Confidence
Statistical confidence interval around predicted failure date. Narrow interval means high certainty — plan maintenance precisely. Wide interval means high uncertainty — increase monitoring frequency or schedule earlier preventive intervention to avoid emergency scenarios.
Mean Time Between Anomalies
Average duration between detected divergences from predicted behavior. Declining MTBA indicates accelerating degradation or changing operating conditions. Rising MTBA after maintenance validates corrective action effectiveness and model accuracy improvement.
Asset Health Score Trajectory
Composite score from all monitored parameters showing overall equipment condition trend. Score declining faster than predicted baseline triggers escalation — maintenance moved from planned to urgent status automatically through CMMS integration.
Maintenance Action Lead Time
Time between anomaly detection and required maintenance completion. Live digital twins maximize this window — detecting problems weeks before failure instead of hours. Longer lead time enables planned shutdowns during low-volume periods rather than emergency stops during peak fulfillment.
Frequently Asked Questions
How accurate are live digital twin predictions compared to static predictive models?
Live digital twins typically achieve 85-95% accuracy within ±2 days of actual failure, compared to 55-70% accuracy within ±7 days for static models. The continuous feedback loop between real sensor data and virtual models eliminates drift caused by changing operating conditions.
Start tracking your prediction accuracy with Oxmaint's live monitoring dashboard.
What sensors are required to implement a live digital twin in my warehouse?
Minimum viable implementation requires vibration sensors on rotating equipment, temperature probes on motors and bearings, and current draw monitors on drive systems. Advanced implementations add position encoders, load cells, and environmental sensors. Most warehouses already have 40-60% of required sensors through existing automation systems —
book a demo for a sensor gap analysis.
How long does it take to see ROI from live digital twin deployment?
Typical payback period is 6-11 months. Early ROI comes from avoided emergency breakdowns and reduced overtime maintenance costs. Long-term ROI compounds through optimized parts inventory, extended asset life, and higher order fulfillment rates during peak periods when equipment reliability matters most.
Can a live digital twin integrate with our existing warehouse management system?
Yes. Live digital twins operate independently of WMS but can consume WMS data to correlate equipment stress with order volume patterns. Integration happens through standard APIs — no modification to existing WMS required. CMMS integration is essential for automatic work order generation when predictions diverge from reality.
Prediction refined by reality, every second
Stop Managing the Gap Between What Should Happen and What Does Happen. Close It.
Oxmaint connects your warehouse IoT sensors, predictive maintenance models, and CMMS work orders into one live digital twin platform where predicted equipment behavior is continuously compared against actual sensor data — and when reality diverges beyond safe thresholds, maintenance gets scheduled automatically before the gap becomes a breakdown.