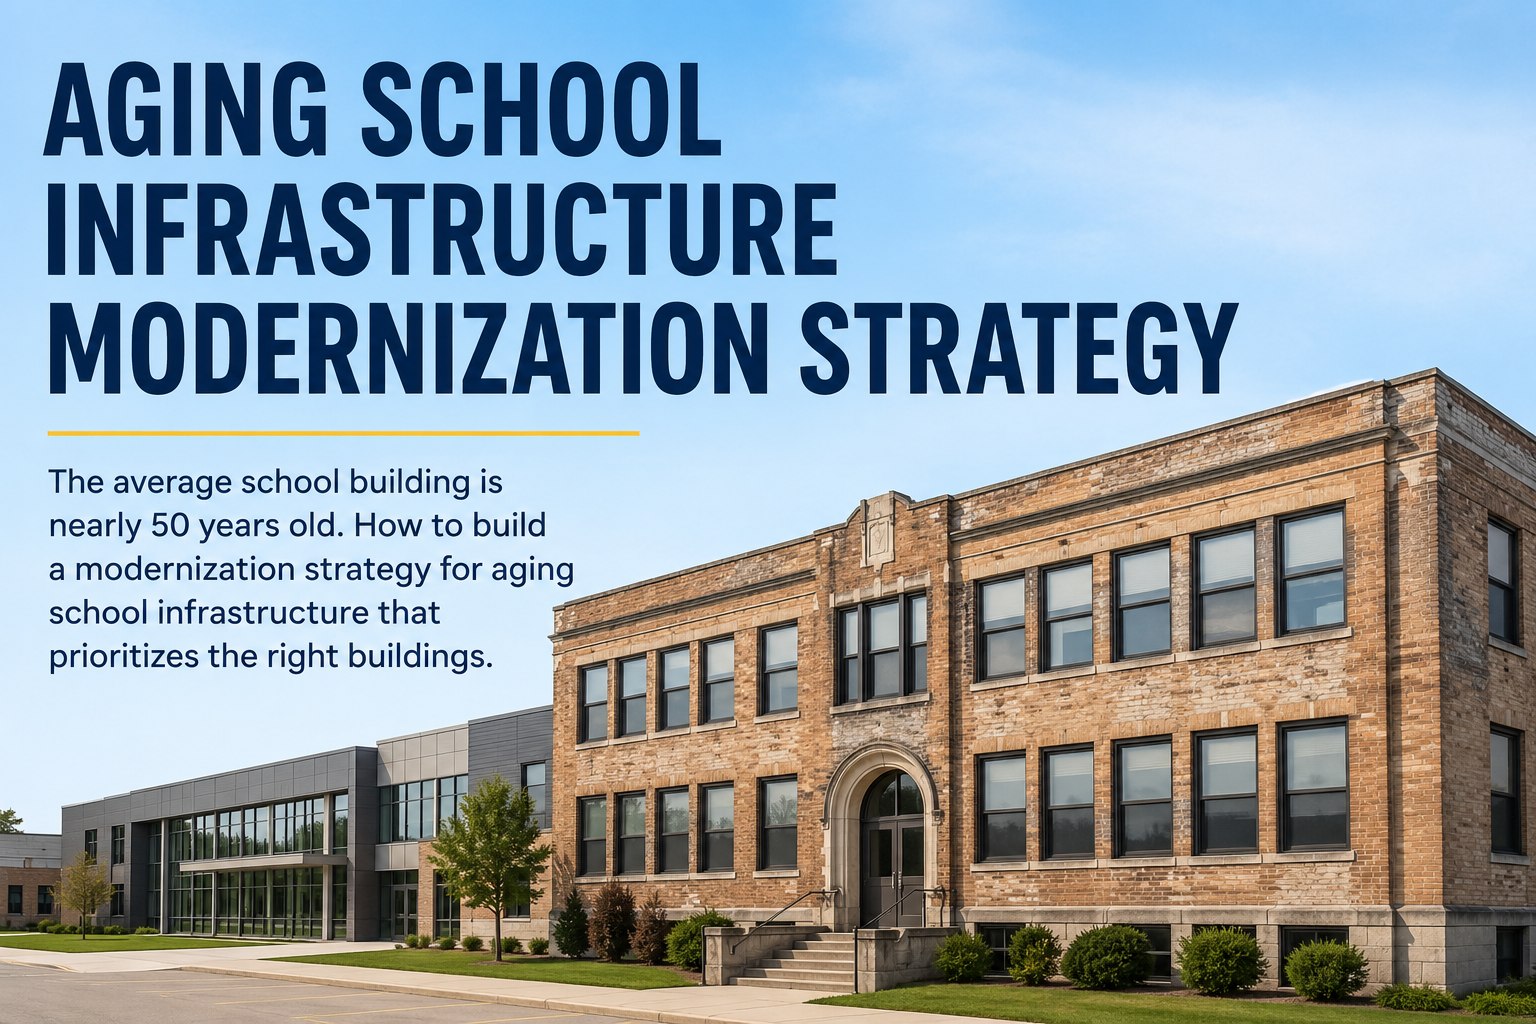
The average American school building is nearly 50 years old, and the national deferred maintenance backlog has climbed past $2 trillion — a figure that grows every year a district delays action. Modernizing aging education infrastructure is no longer about cosmetic upgrades; it is about safety, energy performance, classroom air quality, and the basic continuity of learning. A documented, phased strategy is what separates districts that secure bond funding from those that return empty-handed year after year. This guide walks through a modernization playbook built around condition-based prioritization, board-facing capital narratives, and the CMMS foundation that turns a wish list into a funded, multi-year plan. Ready to operationalize yours? Start Free Trial and map your portfolio in days, not quarters.
Can a $2 trillion backlog be tamed one building at a time?
Most districts attack aging school infrastructure reactively — patching roofs, boilers, and electrical panels as they fail. The result is escalating emergency spend, comfort complaints, and bond defeats. A documented, condition-based renewal plan flips that dynamic, giving boards a defensible capital narrative and facilities teams a year-over-year execution roadmap.
The real cost of waiting on aging school facilities
Every year of delay compounds — emergency repairs cost 3–5× planned work, energy waste grows 4–7% annually on unmodernized systems, and bond fatigue sets in when voters lose trust in district stewardship.
A 22-building K-12 district with 1.8M sq ft and a $640M replacement value was spending $1.9M annually on emergency HVAC, roofing, and electrical call-outs — 28% of its facilities budget. After implementing condition assessments and a CMMS-driven renewal plan, emergency spend dropped to $610K within 18 months, freeing $1.3M annually for scheduled modernization. The documented condition data also supported a successful $48M bond referendum on the second attempt.
Five-step modernization roadmap, from assessment to renewal
A defensible capital plan follows a strict sequence: you cannot prioritize what you have not assessed, and you cannot fund what you cannot narrate.
Condition Assessment & Asset Register
Walk every building. Catalogue systems by FCI (Facility Condition Index) — repair cost ÷ replacement value. An FCI above 10% flags renewal candidates; above 30% triggers replacement analysis. Log every asset into the CMMS with install date, manufacturer, expected service life, and current condition score.
Risk & Criticality Scoring
Rank assets by consequence of failure: life-safety impact, educational disruption, regulatory exposure, and cascading failure risk. A boiler feeding a winter climate high school scores higher than a gym HVAC in a temperate zone. Weight scores so the top 15% of assets absorb 60% of capital attention.
Phased Renewal Plan
Sequence projects across 3, 5, and 10-year horizons. Front-load life-safety and envelope failures, then energy modernization with measurable payback, then programmatic upgrades. Bundle work to minimize mobilization overhead and summer-disruption windows.
Board-Facing Capital Narrative
Translate condition data into the language boards and bond committees understand: deferred maintenance curves, risk-of-failure timelines, cost-of-delay scenarios, and comparable district benchmarks. One defensible chart beats a 200-page facilities report nobody reads.
CMMS Execution & Annual Recalibration
Every funded project flows into the CMMS as scheduled work, with preventive maintenance templates, warranty tracking, and post-project condition re-scoring. Re-run the FCI annually; the portfolio that does not improve its index is the portfolio losing ground.
Condition-based triage: which buildings move first
Modernization budgets never cover every need. A condition-based prioritization matrix ensures the right buildings get funded first — not the loudest principals or the newest board members.
| Priority Tier | FCI Range | Building State | Recommended Action | Funding Track |
|---|---|---|---|---|
| Tier 1 — Critical | > 30% | Major system failure imminent or active; life-safety risk | Immediate replacement or full system renewal | Emergency capital / bond |
| Tier 2 — High | 15–30% | Multiple systems in final third of service life | Scheduled modernization within 12–24 months | Capital reserve / phased bond |
| Tier 3 — Moderate | 5–15% | Isolated system failures; energy underperformance | Targeted renewal + PM intensification | Operating budget + ESSER-style grants |
| Tier 4 — Good | < 5% | Recently renovated or well-maintained | Sustained preventive maintenance | Operating budget |
FCI below 5% = good · 5–10% = fair · 10–30% = poor · above 30% = critical. Recalculate annually after every assessment cycle.
A $120K planned boiler renewal deferred 2 years typically costs $380K+ as emergency replacement — a 3.2× penalty before counting classroom disruption.
Turning condition data into funded capital
Boards do not fund facilities problems — they fund facilities stories. The modernization plan that wins is the one that translates FCI scores into student outcomes, taxpayer protection, and risk reduction.
Lead with the cost of inaction
Open every capital request with the cost-of-delay curve: “If we defer this roof replacement 18 months, the emergency cost rises from $1.2M to $3.4M and we risk interior damage to 14 classrooms.” Boards respond to quantified downside faster than aspirational upside.
Benchmark against peer districts
Show where the portfolio sits relative to comparable enrollment and climate zones. “Our FCI of 18% is 2.3× the state median of 7.8%” is more persuasive than “our buildings are old.” CMMS reporting makes peer benchmarking a one-click exercise.
Tie modernization to learning outcomes
Cite the research: classroom temperatures above 74°F reduce student performance by 2% per degree; poor ventilation correlates with a 5–10% increase in absenteeism. Every HVAC or envelope upgrade is also an academic investment.
Show the phased, auditable plan
Voters trust plans that look like budgets, not wish lists. Present a 5-year Gantt with FCI improvement targets, energy savings projections, and named CMMS accountability for every line item. Transparency is what converts a second-attempt bond from a loss to a win.
Why a CMMS is the non-negotiable backbone
Spreadsheets and binder-based facility assessments are why the $2 trillion backlog exists. A CMMS turns one-time condition data into a living, auditable, board-ready modernization record.
Living Asset Register
Every asset — boilers, roofs, switchgear, RTUs — logged with install date, condition score, service history, and remaining useful life. Updated automatically as work orders close, so the FCI is never stale.
Risk-Weighted Prioritization
Criticality scores automatically surface the top 15% of assets absorbing the most risk, so capital planning starts with data, not politics. Re-ranks dynamically as conditions and usage change.
Board-Ready Reporting
One-click FCI dashboards, cost-of-delay curves, and 5-year capital forecasts formatted for board packets and bond committees. No more assembling slide decks from disconnected spreadsheets the night before a hearing.
Post-Project Accountability
Every funded renewal project flows back into the CMMS as preventive maintenance schedules, warranty trackers, and condition re-scoring — closing the loop between capital planning and operational execution.
“Before implementing a CMMS-driven renewal plan, we were spending 31% of our facilities budget on emergency calls and losing bond votes. Within two years, emergency spend dropped to under 12%, and our second bond passed by 14 points — because the board finally had data they could defend.”
Stop managing aging infrastructure on spreadsheets.
Deploy a CMMS that turns condition assessments into funded, multi-year renewal plans — and proves every dollar to your board.
Aging school infrastructure modernization — answered
How is Facility Condition Index (FCI) calculated and what is a healthy target?
FCI equals total deferred maintenance repair cost divided by current replacement value. A portfolio FCI below 5% is considered good, 5–10% fair, 10–30% poor, and above 30% critical. Most U.S. K-12 districts sit between 12% and 22%, meaning significant renewal backlog. Recalculate annually after condition assessments to track whether the portfolio is improving or deteriorating year over year.
What funding sources are available for school infrastructure modernization?
Primary sources include general obligation bonds, capital reserve funds, state facilities grants, and federal programs (ESSER, FEMA hazard mitigation, DOE energy efficiency). Many districts also pursue energy performance contracts and public-private partnerships for HVAC and solar projects. A documented CMMS-based condition plan is often a prerequisite for competitive grants — reviewers want quantified need, not narrative. Book a Demo to see how reporting templates map to common grant requirements.
How long does a full condition assessment take for a typical district?
A 20-building K-12 district with 1.5–2M sq ft typically completes a full condition assessment in 8–12 weeks, depending on asset complexity and team size. Assessments should be conducted by certified facility assessors or qualified in-house staff using a standardized scoring rubric. The first cycle is the longest; subsequent annual updates take 30–50% less time when the asset register is maintained in a CMMS.
What is the typical payback period for school HVAC and envelope modernization?
Boiler and chiller replacements generally pay back in 7–12 years through energy savings alone; full building envelope upgrades (roof, windows, insulation) pay back in 12–20 years. When including avoided emergency repair costs and classroom disruption, effective payback often drops to 5–8 years. Districts in extreme climate zones or those with older steam-based systems see the fastest returns.
How does a CMMS specifically improve bond referendum outcomes?
A CMMS provides the documented, auditable condition data that bond committees and voters increasingly demand. Districts with CMMS-backed capital plans report 20–35% higher bond passage rates on first or second attempts because the data answers the three questions voters ask: what is broken, what will it cost, and how will you prove the money was spent as promised. Start Free Trial to build your board-ready capital narrative in days.
Your aging school buildings have a plan waiting to be built.
Start a free trial and turn condition assessments into a funded, multi-year modernization roadmap your board can defend — and your facilities team can execute.
Free 14-day trial · No credit card