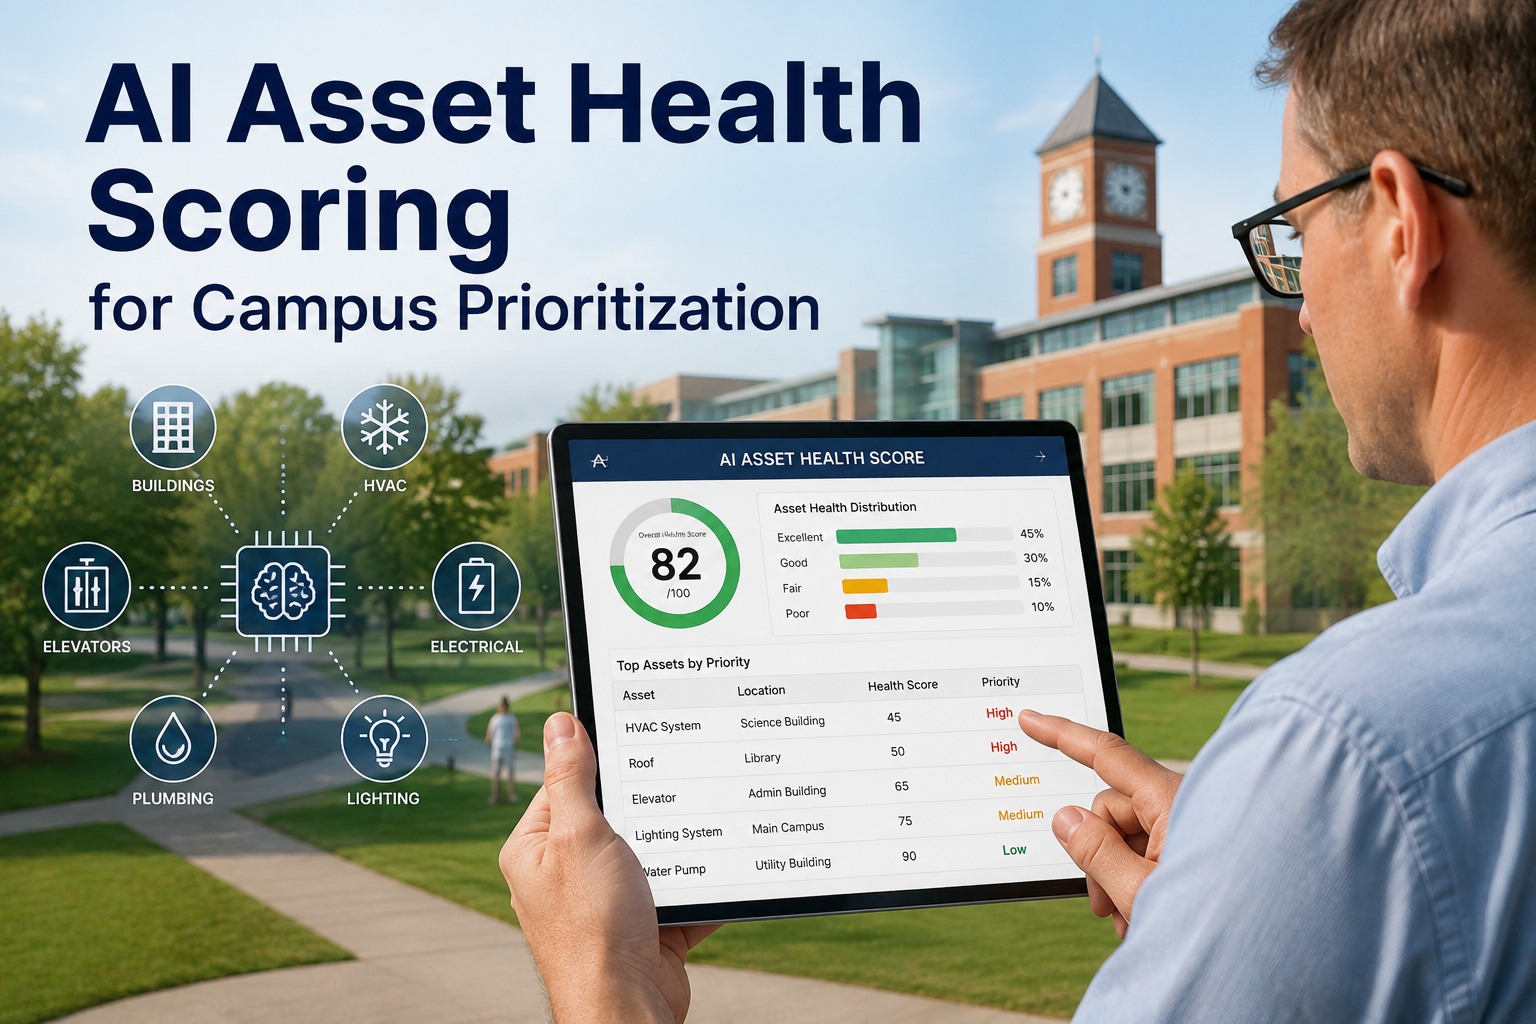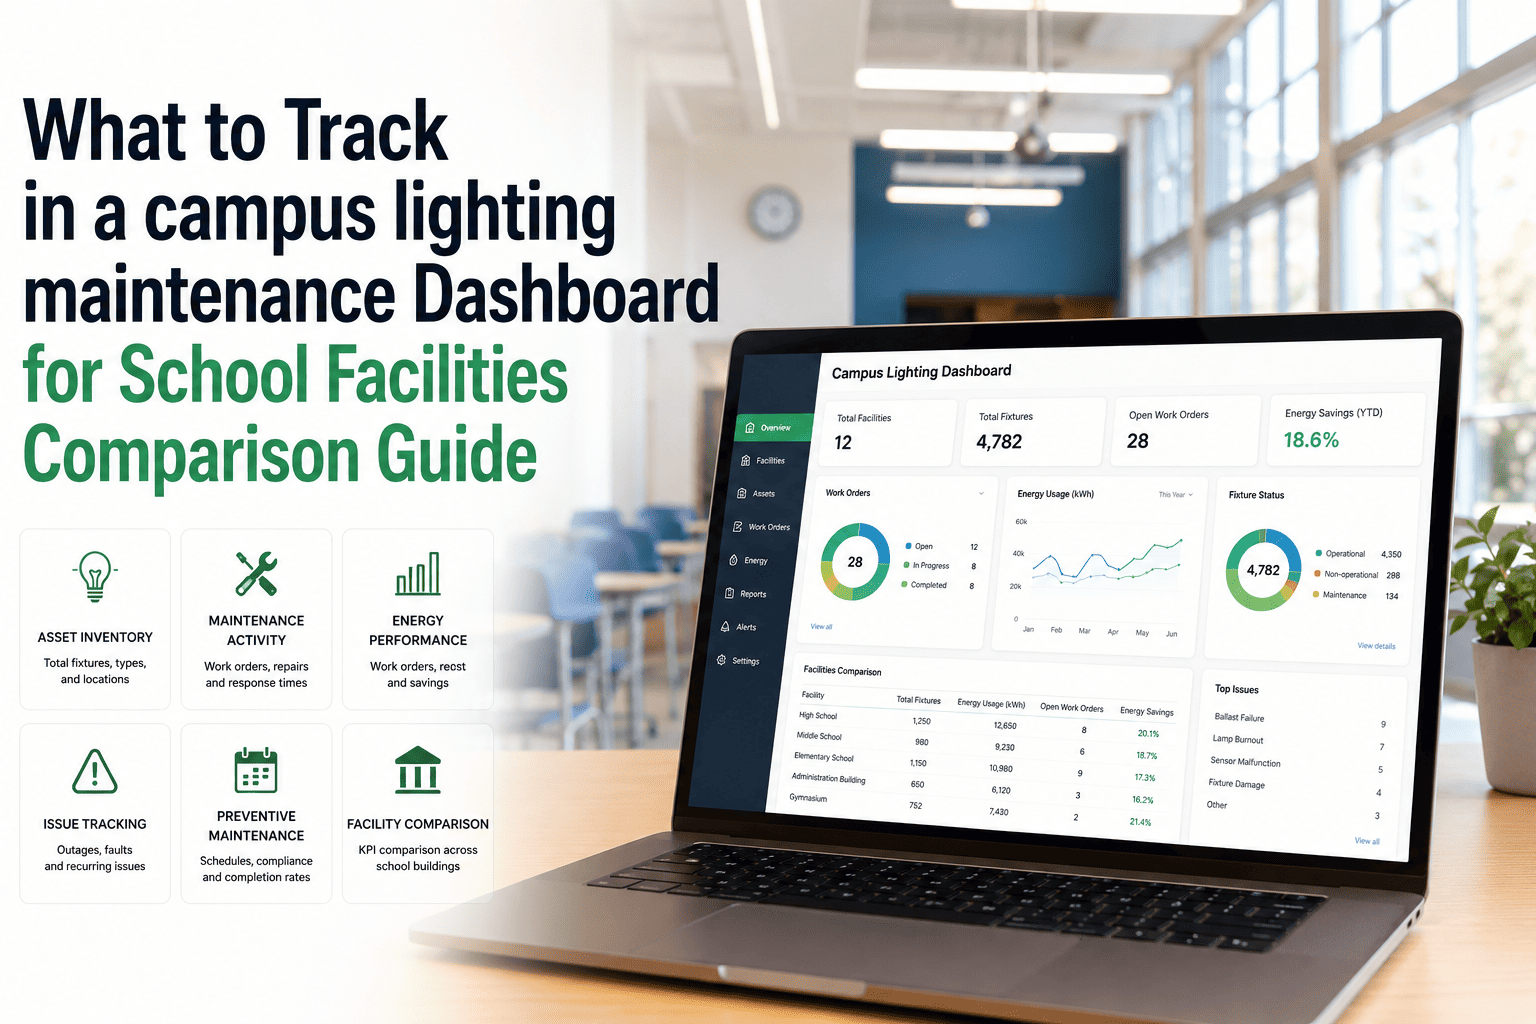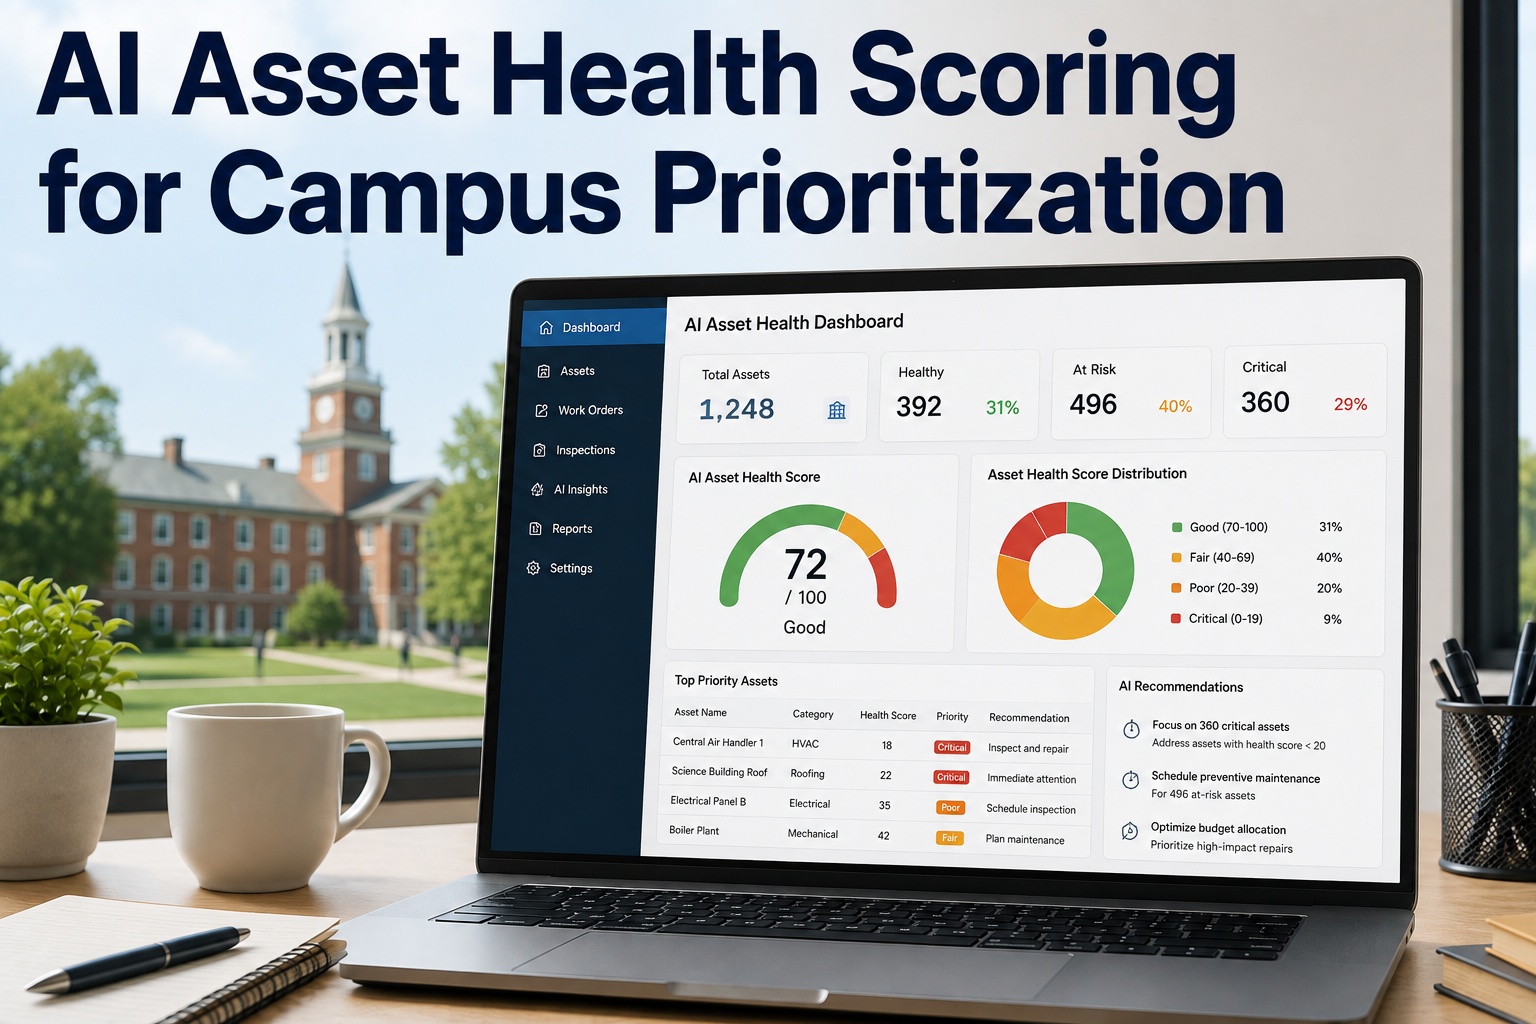
When a campus portfolio crosses 500 buildings, the prioritization conversation stops being about experience and starts being about evidence — and most districts are still trying to get there with spreadsheets and memory. AI asset health scoring combines condition, age, preventive maintenance history, and live failure signals into one ranked score per asset, so capital and labor flow to the equipment most likely to fail next. Districts using this approach report reallocating 15–25% of their deferred-maintenance backlog toward high-risk assets within the first budget cycle. If you're ready to operationalize it, you can Start Free Trial and connect your CMMS the same afternoon.
Can you rank 12,000 pieces of equipment by failure risk — before the next school year starts?
Most facilities teams know their worst assets anecdotally. AI asset health scoring turns that tribal knowledge into a defensible, repeatable index — so the board meeting about next year's bond goes from debate to decision.
The cost of prioritizing by gut feel on a 500-building campus
A mid-sized district with 500+ buildings typically carries 8,000–15,000 tracked assets — chillers, boilers, RTUs, switchgear, elevators, domestic water pumps — spread across schools built between 1958 and last year. The average deferred-maintenance backlog in U.S. K-12 sits near $5.2 million per campus, and most of that money is allocated by committee debate, not risk-ranked evidence.
National K-12 average; districts over 500 buildings often exceed $8M per site.
Backlog signal most CMMS systems already track but few districts convert into a risk score.
Assets scoring below 40 fail at 3–4× the rate of assets scoring 70+, per aggregated facilities data.
The status quo — a maintenance director walking into a bond committee meeting with a printed spreadsheet sorted by "age" — misses two-thirds of the risk picture. A 12-year-old chiller with a clean PM record and no recent fault codes is not the same risk as a 9-year-old chiller with 14 open work orders and three refrigerant leaks in two years. AI asset health scoring surfaces that difference as a number, not a narrative.
The four inputs behind every asset health index
An AI asset health score isn't a black box. It's a weighted composite of four data streams your CMMS, BMS, and building walk-throughs are already generating — the AI's job is to fuse them, normalize them across asset classes, and recalculate as new data arrives.
Age & Service Profile
Installed date, expected useful life (EUL) per ASHRAE or manufacturer spec, and miles/hours where metered. A boiler at 85% of EUL doesn't auto-fail, but it shifts the baseline.
Condition Assessment
Level 1–3 facility condition assessment data, infrared scans, vibration trending, and technician walkthrough notes converted to a 0–100 condition index.
PM History & Compliance
Percentage of scheduled PMs completed on time, mean time between PMs, and ratio of planned-to-reactive work — the strongest leading indicator of future failure.
Failure Signals
Open work orders, repeat failure codes, BMS alarms, fault detection diagnostics, and mean time to repair over the trailing 12 months.
From 14 chillers to a ranked replacement list in one afternoon
Consider a district with 14 central-plant chillers across eight high schools. Without health scoring, the capital plan replaces the oldest unit first. With scoring, the picture changes — and the money moves.
| Chiller | Age (yrs) | PM Compliance | Failure Signals | Health Score | Action |
|---|---|---|---|---|---|
| HS-3 Chiller A | 9 | 62% | 14 open WOs, 3 leaks | 31 | Replace this year |
| HS-7 Chiller B | 11 | 88% | 2 open WOs | 54 | Rebuild + monitor |
| HS-1 Chiller C | 17 | 95% | 1 open WO | 71 | Defer 2 years |
The 17-year-old chiller at HS-1 was the line item everyone wanted to replace — it's old. But its PM compliance is 95% and it hasn't thrown a fault code in 14 months. The 9-year-old at HS-3, three years younger, is failing in slow motion. Health scoring moved $480,000 of capital from HS-1 to HS-3 and prevented a mid-September cooling failure during the third week of classes.
Connecting health scoring to your existing CMMS
The score only works if it reads the data you already have and writes the ranking back where your team already works. Most districts are live in 2–4 weeks with no new sensors required — the AI ingests the CMMS directly.
CMMS extraction
Pull asset registry, work-order history (3–5 years), PM schedules, and failure codes from your CMMS via API or flat-file export. No schema changes required.
Signal normalization
The AI maps your failure codes to a standard taxonomy, fills missing install dates from purchase records, and flags assets with insufficient data for a confidence score.
Baseline scoring
Every asset receives a 0–100 health score plus a risk tier (Critical / Watch / Stable). Weights tuned with your facilities director in a 60-minute calibration session.
Live dashboard & routing
Scores push back to your CMMS as a custom field. Critical-tier assets auto-generate inspection work orders; the board-ready capital prioritization report exports on demand.
Outcomes after one budget cycle on health scoring
Districts shifting PM dollars toward Critical-tier assets typically see reactive volume drop within 90 days as failures are intercepted earlier.
Mid-sized districts (500+ buildings) reallocate roughly $420K annually from age-based to risk-based replacement — money that prevents failures instead of replacing functional equipment.
The capital prioritization report that used to take a facilities director a full day of spreadsheet wrangling now exports in under 30 seconds.
"We stopped arguing about which chiller to replace. The score told us. The board stopped arguing about whether to trust the score — because the first one we replaced had been leaking for two years and nobody had connected the work orders."
See your 10 riskiest assets before the next bond meeting
Upload your CMMS export today and get a baseline health-score ranking across every building in 14 days or less.
What facilities leaders ask before adopting health scoring
How much CMMS data do we need before the score is reliable?
A minimum of 18 months of work-order history and a reasonably complete asset registry. The model degrades gracefully with less data — it will still score assets but assign a lower confidence flag, so your team knows which rankings to verify manually before committing capital.
Does this replace our facility condition assessments?
No. FCAs feed the Condition Factor input. The score complements assessments by fusing FCA data with live PM and failure data that an assessment — typically done every 3–5 years — can't capture. Think of the score as the between-assessments heartbeat. You can Book a Demo to see how your last FCA feeds the model.
What if our failure codes are inconsistent across buildings?
This is common. The AI maps your existing codes — however messy — to a standardized failure taxonomy during the Week 2 normalization step. You don't need to clean your codes first; the mapping improves over time as the model learns your district's naming patterns.
Can we tune the weights for our district's risk tolerance?
Yes. The default weights (30% age, 25% condition, 25% PM, 20% failure signals) are adjustable. A district in a hot climate may weight failure signals higher for cooling equipment; a northern district may weight age higher for boilers. Tuning happens in a single calibration session.
How does the score handle assets with no install date?
Missing install dates are estimated from purchase records, commissioning reports, or building-vintage proxies. The model flags these assets with a data-completeness indicator so your team can backfill the records that matter most. Sign up at Start Free Trial and the first report will surface every asset missing critical fields.
Stop guessing which asset fails next. Start scoring.
Your CMMS already has the data. Turn it into a ranked, board-ready prioritization list this week.
Free 14-day trial · No credit card