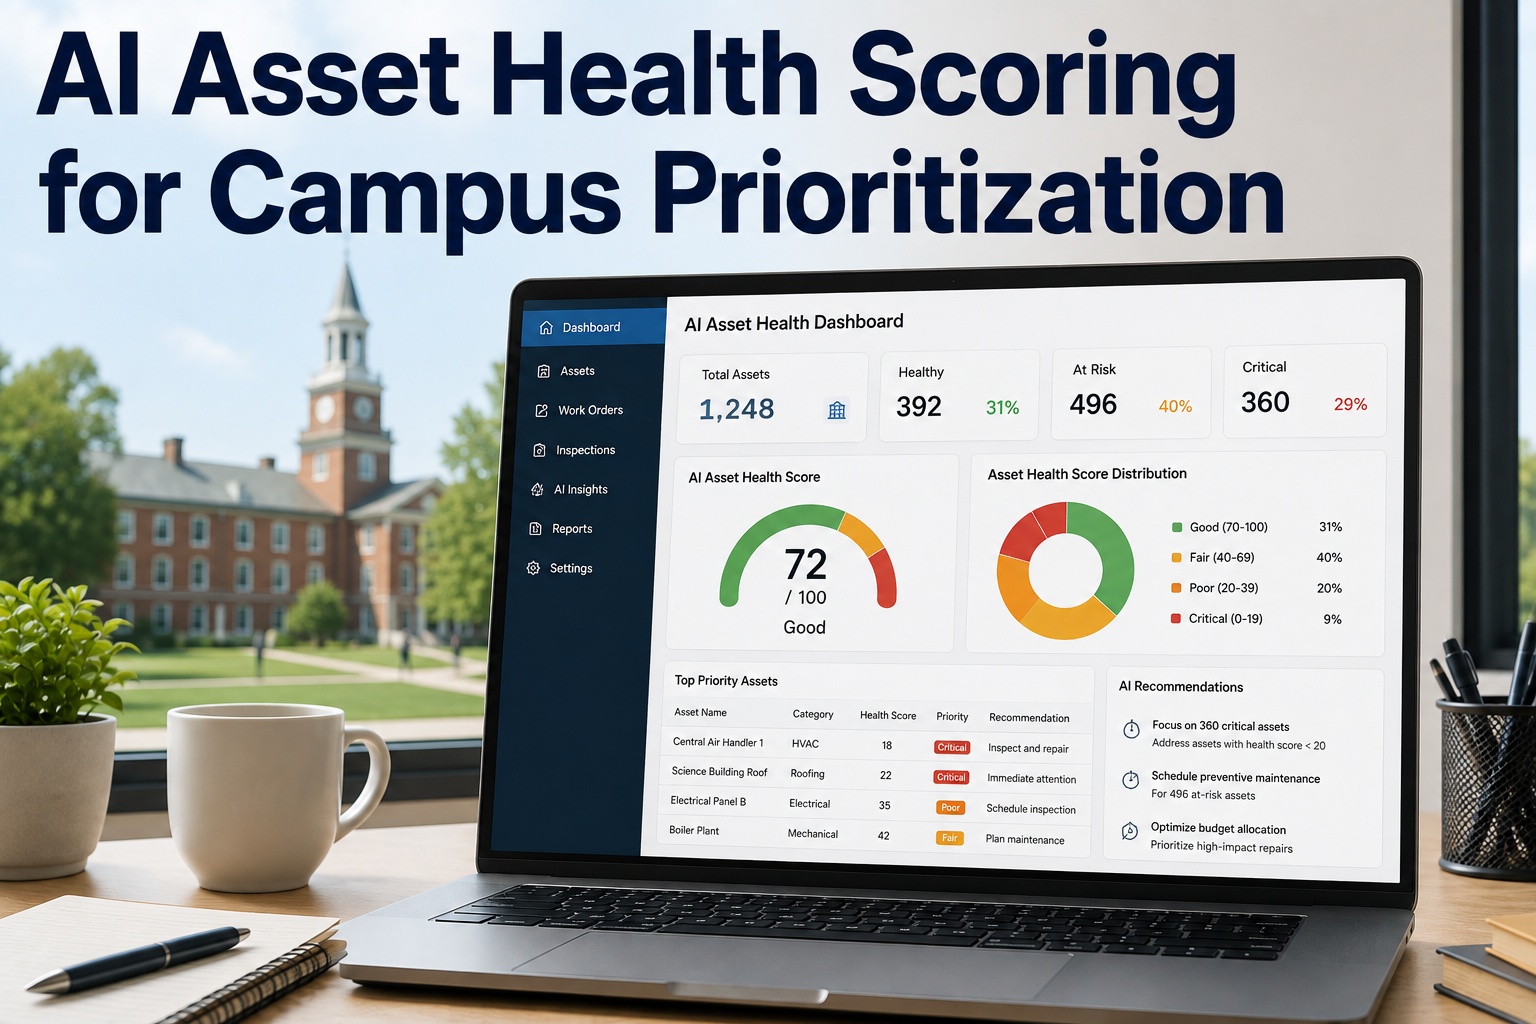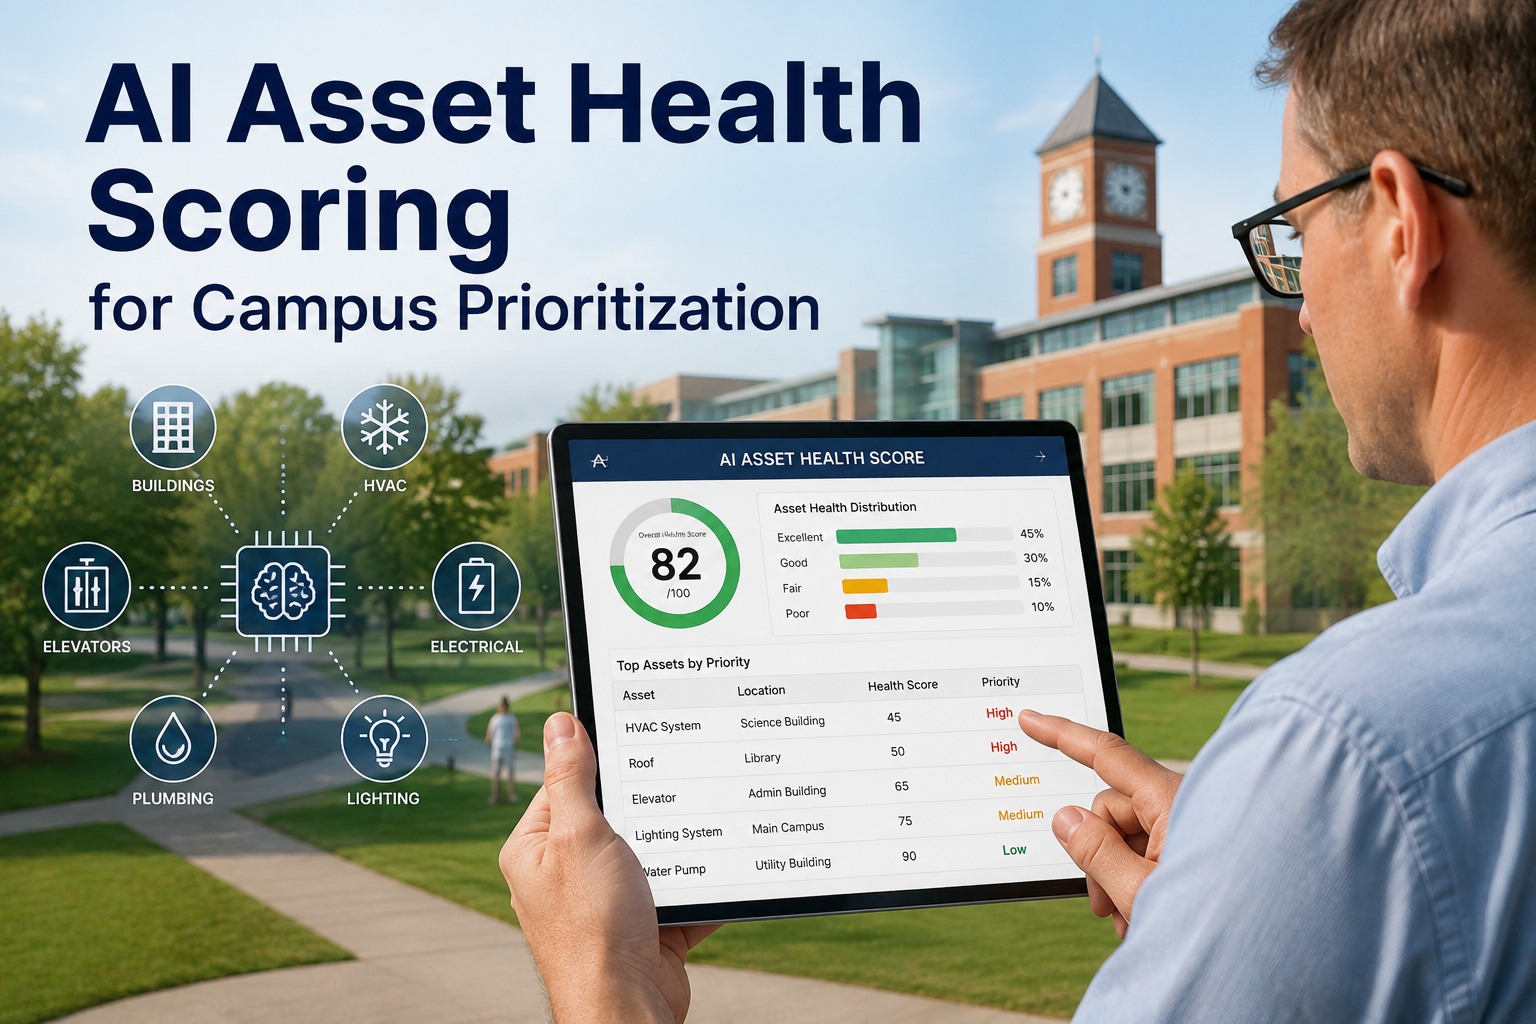
AI asset health scoring is a data-driven method that combines equipment condition, age, preventive maintenance history, and failure signals into a single ranked score — so campus facilities teams with 500+ buildings can prioritize capital and maintenance dollars by risk instead of gut feel. For school districts and universities managing thousands of HVAC units, boilers, roofs, and electrical systems, an asset health index turns an overwhelming backlog into a defensible, ranked action list. Instead of reacting to the loudest complaint or the most recent breakdown, you fund the assets most likely to fail and cost the most when they do. Districts using AI asset prioritization typically redirect 20–30% of capital spend away from low-risk equipment toward true failure risks. Start Free Trial and see how OxMaint calculates health scores across your entire campus automatically.
Which of your 500+ buildings will fail next — and do you know why?
Campus asset health scoring replaces guesswork with a ranked, data-backed index. OxMaint analyzes condition, age, PM compliance, and failure history to score every asset 0–100, so your limited budget goes where failure risk is highest.
Why Campus Facilities Teams Can't Prioritize by Gut Feel Anymore
A mid-size school district manages 800,000+ square feet across 40–60 buildings with a maintenance budget that hasn't grown in a decade. The average age of U.S. school buildings is 44 years, and the deferred maintenance backlog in K-12 alone exceeds $270 billion. When everything looks urgent, nothing is truly prioritized.
Without a campus asset health index, budget requests become political exercises. The principal who complains loudest gets the new HVAC unit. The board member's alma mater gets the roof. Meanwhile, a 38-year-old chiller serving three buildings silently approaches catastrophic failure — and nobody sees it coming because there's no scoring system flagging it.
How AI Asset Health Scoring Works: The 4 Data Streams Behind Every Score
AI asset health scoring isn't a single data point — it's a weighted composite. OxMaint's engine pulls four independent data streams, normalizes each to a 0–100 sub-score, applies configurable weights, and produces a single asset health index that updates every time new data enters the system.
Physical Condition
Inspection ratings, visual assessments, vibration readings, thermal scans, and technician-reported condition grades. Weight: typically 35–40% of total score.
Age vs. Expected Life
Install date compared against ASHRAE and manufacturer-rated service life. A 20-year-old RTU rated for 15 years scores far lower than a 5-year-old unit. Weight: 20–25%.
PM Compliance History
Percentage of scheduled preventive maintenance actually completed on time. Assets with 90%+ PM compliance score higher; those with chronic missed PMs drop fast. Weight: 20%.
Failure & Work Order Signals
Frequency, severity, and cost of reactive work orders in the trailing 24 months. Rising failure trends trigger score decay even before condition visibly degrades. Weight: 15%.
Weights are fully configurable. A university with heavy research labs might weight failure signals higher because downtime in a lab costs $15K+ per day. A K-12 district might weight age more heavily because its buildings are older. The point: the scoring adapts to your campus, not the other way around.
What Each Asset Health Score Range Means for Your Campus
A score is only useful if it maps to a clear action. Here's how districts using campus asset health scoring translate the 0–100 index into budget and maintenance decisions.
| Score Range | Rating | What It Means | Recommended Action |
|---|---|---|---|
| 85–100 | Excellent | Well-maintained, within service life, low failure risk | Continue standard PM schedule; no capital needed |
| 70–84 | Good | Minor wear, PM compliance adequate, aging normally | Monitor quarterly; increase PM frequency if trending down |
| 50–69 | Fair | Approaching end of life, rising work orders, PM gaps | Plan replacement within 2–3 budget cycles; increase inspections |
| 30–49 | Poor | Past expected life, frequent failures, high repair costs | Prioritize for next capital cycle; prepare contingency plan |
| 0–29 | Critical | Imminent failure risk, safety or compliance exposure | Immediate replacement or emergency repair; escalate to leadership |
When a facilities director walks into a board meeting with a ranked list showing 12 assets in the Critical band — with failure probability, replacement cost, and consequence of failure attached — the conversation shifts from opinion to evidence. That's the power of an asset health index for schools.
How One District Used AI Asset Prioritization to Redirect $1.2M in Capital Spend
A 52-building school district in the Southeast was allocating its $4.1M annual capital budget the same way it had for 15 years: rotate through buildings alphabetically, replace what broke last year, and hope nothing catastrophic happened mid-semester.
- Capital allocated by building rotation, not condition
- 3 emergency HVAC replacements in one year at $85K each
- No visibility into which assets were actually at risk
- Board questioned every budget request — no data to defend it
- Maintenance team spent 68% of hours on reactive work
- Every asset scored 0–100 and ranked by failure risk
- $1.2M redirected from low-risk to critical assets in year one
- Emergency replacements dropped from 3 to 0 in 18 months
- Board approved budget in one meeting — data spoke for itself
- Reactive work dropped to 41% of total maintenance hours
The district didn't spend more money. It spent the same money on the right assets. That's what AI asset health scoring for campus prioritization actually delivers: not a bigger budget, but a smarter one.
See Your Campus Health Scores in 30 Minutes
Book a live demo and we'll show you how OxMaint scores your assets, ranks your backlog, and builds a capital plan your board will approve.
What Data Do You Need for Campus Asset Health Scoring?
The most common objection we hear: "Our data isn't clean enough for AI." In practice, most districts already have 80% of what they need — it's just scattered across spreadsheets, filing cabinets, and three different software systems. Here's the minimum viable dataset.
Asset Registry
A list of every tracked asset with type, location, and install date. Even a spreadsheet works — OxMaint imports it directly and enriches it with manufacturer life-expectancy data.
Work Order History
12–24 months of repair records showing what broke, when, and what it cost. OxMaint's AI parses even unstructured notes to extract failure patterns and cost trends.
PM Schedule & Completion
What preventive maintenance is supposed to happen and whether it actually did. If you're tracking PMs on paper, OxMaint digitizes them in days — not months.
Condition Assessments
Any existing facility condition assessments (FCA), inspection reports, or technician observations. OxMaint's mobile app lets techs log condition grades during routine rounds.
You don't need perfect data to start. You need a system that gets smarter as data improves. OxMaint begins scoring with whatever you have and refines accuracy as your team logs more work orders, completes more PMs, and records more condition data.
How OxMaint Powers AI Asset Health Scoring for Education Campuses
OxMaint isn't a scoring overlay bolted onto a generic CMMS. Asset health intelligence is built into the core platform — every work order, PM completion, and inspection feeds the score automatically. Here's what that looks like in practice.
Automated Health Index
Every asset gets a live 0–100 score that updates with each work order, PM, and inspection. No manual calculation, no stale spreadsheets. Districts report 25–30% better capital allocation accuracy within the first budget cycle.
Predictive Failure Alerts
When an asset's score drops below your threshold, OxMaint flags it before failure occurs. Teams using predictive alerts cut unplanned downtime 30–50% and eliminate most emergency callouts entirely.
Capital Planning Dashboard
A board-ready view that ranks every asset by health score, replacement cost, and consequence of failure. Export it as a PDF for your next budget meeting. Facilities directors report getting capital plans approved 2x faster with data-backed rankings.
Mobile-First Work Orders
Technicians log condition grades, complete PMs, and close work orders from their phones — every action feeds the health score in real time. No paper, no double entry, no data gaps. Teams go from clipboard to CMMS in under a week.
AI Asset Health Scoring for Campuses: Common Questions
What is AI asset health scoring?
AI asset health scoring is a method that combines equipment condition, age, maintenance history, and failure signals into a single numerical score (typically 0–100) for each asset. The score ranks your entire portfolio by failure risk, so facilities teams can prioritize maintenance and capital spending on the assets that need it most — not the ones that complain loudest.
How is an asset health index different from a facility condition assessment?
A facility condition assessment (FCA) is a point-in-time snapshot — usually done every 3–5 years by consultants. An asset health index is a living score that updates continuously as new work orders, PM completions, and inspection data flow in. Think of FCA as a photograph and health scoring as a live video feed. Book a Demo to see the difference on your own data.
Do we need clean data to start using AI asset scoring?
No. Most districts start with a basic asset list and 12 months of work order history — even if it's in spreadsheets. OxMaint imports existing data, enriches it with manufacturer life-expectancy benchmarks, and begins scoring immediately. Accuracy improves as your team logs more activity in the system.
How long does it take to implement asset health scoring across a campus?
Most districts see initial health scores within 2–4 weeks. The first week is data import and asset registry setup. Weeks 2–3 involve configuring scoring weights and thresholds for your specific campus. By week 4, you have a ranked portfolio view ready for capital planning. Start Free Trial and you could have scores before your next budget meeting.
Can health scores help us get budget approved by the school board?
Yes — this is one of the highest-impact use cases. When you present a ranked list showing which assets are Critical (score 0–29), what they'll cost to replace, and what happens if they fail, the conversation shifts from opinion to evidence. Districts using data-backed capital plans report getting approvals 2x faster with fewer follow-up questions from board members.
Stop Guessing. Start Scoring.
Your campus has 500+ assets. OxMaint tells you exactly which ones need attention first — and proves it to your board. See it live in 30 minutes.
Free 14-day trial · No credit card required · Set up in days, not months