A medium-sized university operations team budgeted $4.2M for rooftop unit replacements in their 2025 capital plan based on the rule of thumb every facilities director uses: "RTUs last 15–20 years, replace them at 18." When the team finally deployed AI lifespan prediction models against actual asset condition data, the results reshuffled the entire plan. Eleven of the units scheduled for replacement that year had 4–7 years of life remaining based on real performance signatures. Six units that weren't on any replacement list were already showing degradation patterns that would cause failure within 18 months. The corrected plan deferred $1.8M in unnecessary capital spend and accelerated $920K in replacements that would have been emergency expenditures eighteen months later. AI lifespan prediction is not science fiction — it is the difference between a CapEx forecast built on calendar age and one built on the actual condition of the actual asset. If your rooftop replacement plan is still age-based, sign up to try Oxmaint free for 30 days or book a demo.
Campus RTU Lifespan Prediction —
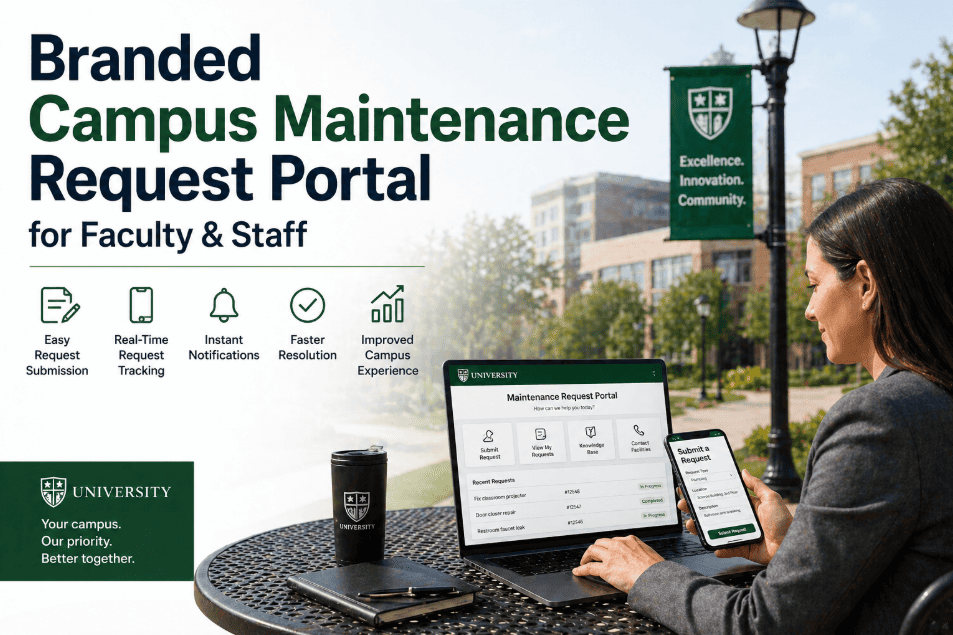
The Average Rooftop Unit Lifespan Has a 5-Year Range. AI Prediction Closes That Range to Months.
15–20 yr
RTU expected lifespan
ASHRAE / DOE / Trane / Carrier industry data — 5-year variance based on maintenance and environment
90%
Failure prediction accuracy
PwC documented for AI-driven predictive maintenance on properly instrumented industrial equipment
$4.5K–$10K
Per-unit replacement cost
Plus crane, electrical, and refrigerant transition — campus portfolios run 50+ RTUs at scale
20–40%
Energy savings on new units
Modern high-efficiency RTUs vs aging units operating at 65% of original efficiency
The RTU Aging Curve — and Where AI Prediction Makes the Difference
Every rooftop unit travels the same five-stage aging curve, but no two units travel it at the same speed. AI lifespan prediction uses each unit's unique operational signature — runtime hours, refrigerant pressure trends, vibration profile, energy draw, climate exposure — to forecast where on the curve that specific RTU actually sits, not where the calendar says it should sit. Book a demo to see the curve mapped against your campus portfolio.
01
Years 0–3
Commissioning & Burn-In
Peak efficiency. Issues at this stage signal installation defects or manufacturing problems — not aging. AI baseline established for the unit's normal operational signature against ambient and load conditions.
02
Years 3–10
Productive Service Life
The golden years. Energy efficiency holds within 5% of nameplate. PMs prevent most issues. AI watches for early deviation patterns — slow trends invisible to human inspection but predictive of mid-life problems.
03
Years 10–15
Maturity & Optimization Window
Efficiency drops 10–15% from peak. Compressor or motor retrofits can extend life materially. AI distinguishes between units that benefit from retrofit ($) and units that need full replacement ($$$$) — capital decisions worth millions across a portfolio.
04
Years 15–20
End-of-Service Window
Operating at 65% of original efficiency. Parts increasingly obsolete. Repair frequency rising. AI prediction now forecasts the specific replacement window in months, not years — letting facilities teams sequence replacements around academic calendar rather than emergency conditions.
05
Year 20+
High-Risk Operation
Catastrophic failure risk elevated. R-410A refrigerant phaseout and 2025 EPA regulation compliance issues. AI flags these units for priority replacement and quantifies the operational risk of deferring further.
The Operational Data AI Models Use to Predict RTU Lifespan
AI lifespan prediction is not magic — it is pattern recognition across data streams that human inspectors cannot process at scale. Six categories of input data feed the models that turn 5-year guesses into 6-month forecasts.
01
Runtime & Cycling Data
Total compressor runtime, daily cycling frequency, peak load hours, simultaneous heating/cooling events. A unit running 4,200 hours per year ages faster than its nameplate twin running 2,800 hours. Calendar age tells you the unit is 12 years old. Runtime data tells you it's lived 18 years of equivalent operation.
02
Energy Draw Trends
Energy consumption per cooling/heating ton-hour delivered. Slow rise in consumption per unit of output is the earliest signal of compressor degradation, refrigerant loss, or coil fouling. AI catches the 0.3% monthly drift that is invisible to the technician but lethal over 18 months.
03
Refrigerant Pressure & Subcooling Patterns
Discharge pressure, suction pressure, superheat, and subcooling readings logged over time. Pattern deviations signal refrigerant leaks, expansion valve degradation, or compressor wear long before the unit shows symptoms a technician would catch.
04
Vibration & Acoustic Signatures
Compressor vibration profile, fan motor signature, blower bearing acoustic data. Each rotating component has a unique baseline signature. Drift from baseline is the standard predictive maintenance signal — AI models cluster signatures across a portfolio to flag the units degrading fastest.
05
Climate & Environmental Exposure
Local salt air, urban pollution, industrial chemical exposure, freeze-thaw cycles, UV exposure. Coastal university campuses see 20–30% shorter RTU lifespans than inland equivalents. AI normalizes for environmental load when projecting remaining useful life.
06
Maintenance & Repair History
Frequency of repair work orders, parts replaced, cumulative repair cost relative to replacement cost. Units exceeding the 50% rule (repair cost over 50% of replacement cost over 24 months) move into priority replacement queues regardless of calendar age.
From 5-Year Guess to 6-Month Forecast
Your Capital Plan Built on Real Asset Condition. Not Calendar Age.
Oxmaint applies AI lifespan prediction across the full RTU portfolio — runtime, energy, refrigerant, vibration, climate, and maintenance signals fused into per-unit replacement-window forecasts that turn the 5-year industry range into months of confidence.
How Oxmaint Delivers AI Lifespan Prediction for Campus Rooftop Units
01
Per-Unit Lifespan Forecasts
Each RTU in the portfolio carries a live remaining-useful-life forecast updated continuously from operational data. Replacement-window predictions narrow from 5-year industry ranges to 6–12 month confidence intervals as the model trains on the unit's specific signature.
CapEx forecasts move from age-based to condition-based
02
Portfolio Replacement Sequencing
5-year and 10-year capital plans built directly from the AI lifespan forecasts across all RTUs. Replacement sequence optimized by criticality, academic calendar (avoid summer move-in heat events), and refrigerant transition deadlines. Investor and trustee-ready capital reporting.
CapEx plan defensible to provost, CFO, and trustees
03
Retrofit vs Replace Decision Engine
For mid-life units, the platform calculates whether compressor retrofit, motor replacement, or coil cleaning extends useful life cost-effectively — or whether the unit has crossed the threshold where full replacement is the only economic answer. Saves 10–25% of replacement budget on a typical portfolio.
Right-sized investment per unit, not blanket replacement
04
Refrigerant Transition Planning
EPA 2025 R-410A phaseout creates urgency for units approaching end-of-life. The platform identifies which units need replacement before parts/refrigerant become uneconomic, sequencing the transition over 3–5 years rather than reactive emergency replacements.
Refrigerant compliance built into replacement plan
05
Energy Performance Tracking
Per-unit energy consumption per delivered ton-hour tracked continuously. Units operating below 75% of nameplate efficiency flagged. Sustainability and ESG reporting populated automatically — increasingly important for university trustees and accreditation reviews.
Energy efficiency tracked at unit level, not building level
06
IoT Sensor Integration
Vibration, temperature, pressure, and energy sensors stream directly into the AI models. Existing BAS/SCADA data sources integrated where available. Sensor coverage scales from critical-RTU-only deployments to full portfolio monitoring as the value case proves out.
Phased sensor deployment with measurable ROI per phase
Calendar-Age Replacement vs AI Lifespan Prediction — The CapEx Comparison
| Decision dimension | Calendar-age planning | AI lifespan prediction |
|---|
| Replacement trigger | "Unit is 18 years old, replace it" | "Unit signature predicts 14-month replacement window" |
| Forecast precision | ±5 year range based on industry average | ±6–12 month window per specific unit |
| Capital plan accuracy | Often off by 20–30% in either direction | Within 5–10% on rolling 24-month horizon |
| Premature replacement waste | Common — units retired with 4+ years remaining | Rare — replacement triggered by actual signature |
| Emergency replacements | Frequent — calendar missed actual failure | Avoided — AI flagged degradation 12+ months early |
| Retrofit decisions | Not informed by data | Quantified per-unit ROI on extension options |
| Refrigerant transition | Reactive to regulation deadlines | Sequenced into replacement plan years ahead |
Frequently Asked Questions
How much sensor data do AI lifespan models actually need?+
For credible per-unit forecasts, the model needs a minimum of 6–12 months of baseline operational data — runtime, energy consumption, basic refrigerant pressures, and ambient conditions. Most campus BAS systems are already capturing the majority of this data; the gap is connecting it to a maintenance platform that does the analysis. For higher-precision forecasts on critical units, vibration sensors and refrigerant subcooling sensors add 8–12 months of model accuracy.
Book a demo to see model output on similar campus portfolios.
How accurate are AI lifespan predictions in practice?+
Industry research from PwC documents 90% accuracy for AI-driven failure predictions on properly instrumented industrial assets. For commercial RTU lifespan prediction, the practical accuracy is highest on the 24-month horizon — replacement windows narrow to 6–12 months with 85–90% confidence after 12 months of model training. Predictions further than 24 months out remain useful for capital planning ranges but with wider uncertainty bands.
What about RTUs with limited sensor instrumentation?+
For RTUs without modern instrumentation, the model uses available data — utility bills, work order history, repair frequency, age, climate exposure — and provides wider uncertainty bands. Even with limited data, AI prediction on a portfolio basis identifies the highest-risk units far more accurately than calendar age alone. As critical units justify sensor investment, model precision improves over time.
How does the platform handle the EPA 2025 refrigerant transition?+
Each RTU in the registry is tagged with refrigerant type and 2025 phase-out status. Units running R-410A approaching end-of-life are prioritized in the replacement queue because parts and refrigerant supply economics will deteriorate quickly. The capital plan integrates refrigerant compliance with lifespan prediction, sequencing replacements over 3–5 years rather than triggering an expensive reactive transition.
What's the typical ROI of moving from calendar-age to AI prediction-based replacement?+
For a campus portfolio of 30+ RTUs, typical results: 15–25% capital plan optimization (deferred replacements on units with remaining life), 30–50% reduction in emergency replacements, 20–40% energy efficiency improvement on units identified for retrofit instead of replacement, and a 3–5 year refrigerant transition glide path instead of reactive scramble. On a $4M annual replacement budget, optimization typically delivers $600K–$1M in deferred or avoided spend within the first three years.
AI HVAC Lifespan Prediction — Oxmaint
Stop Replacing RTUs by Calendar. Start Replacing Them by Signature.
Per-unit lifespan forecasts, retrofit-vs-replace decision engines, refrigerant transition sequencing, and capital plans defensible to provosts and trustees — all powered by AI models trained on each RTU's actual operational data. The 5-year industry range becomes a 6-month forecast.
90%
Failure prediction accuracy on instrumented assets
15–25%
Capital plan optimization documented
±6 mo
Replacement window precision typical
3–5 yr
Refrigerant transition glide path