The benchmark for higher-education facilities maintenance is $5.40 per square foot annually — but the real range across U.S. campuses runs from $2.80 to $9.20. The campuses at the high end aren't running better facilities; they're running more reactive ones. APPA data shows that a campus in deferred-maintenance debt spends 2.4× more on emergency repairs than one running disciplined preventive maintenance. The math is unambiguous. Every dollar moved from reactive to preventive saves $4.80 in emergency response costs. Every backlog item addressed before it becomes a failure protects 3-5× its value in collateral damage. Modern CMMS platforms give facilities directors the visibility and automation needed to systematically move from the high end of that benchmark to the low end. This guide breaks down the six specific cost levers, the data each one requires, and how OxMaint operationalizes them for typical campus portfolios.
Campus Cost Reduction · 2026
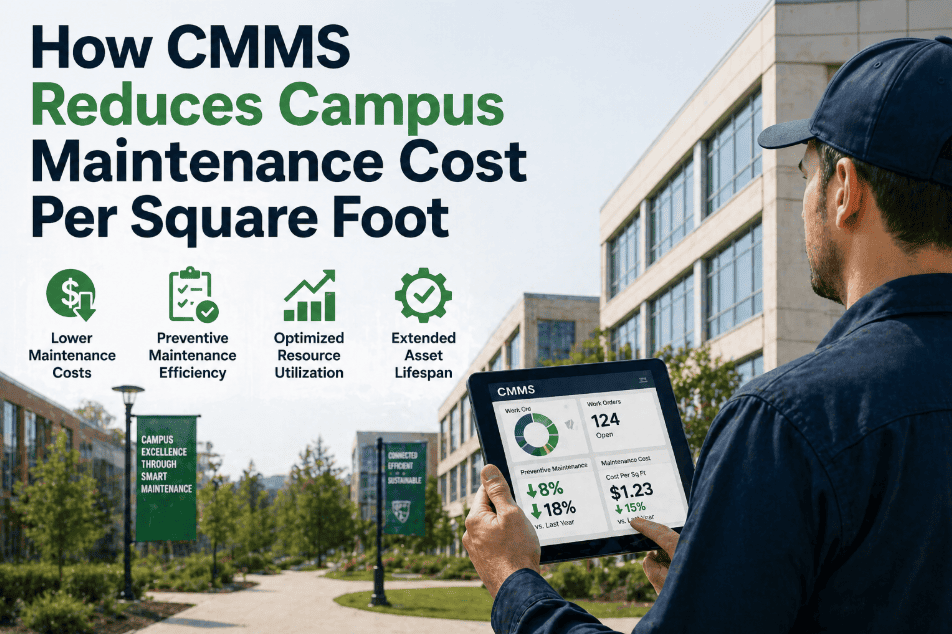
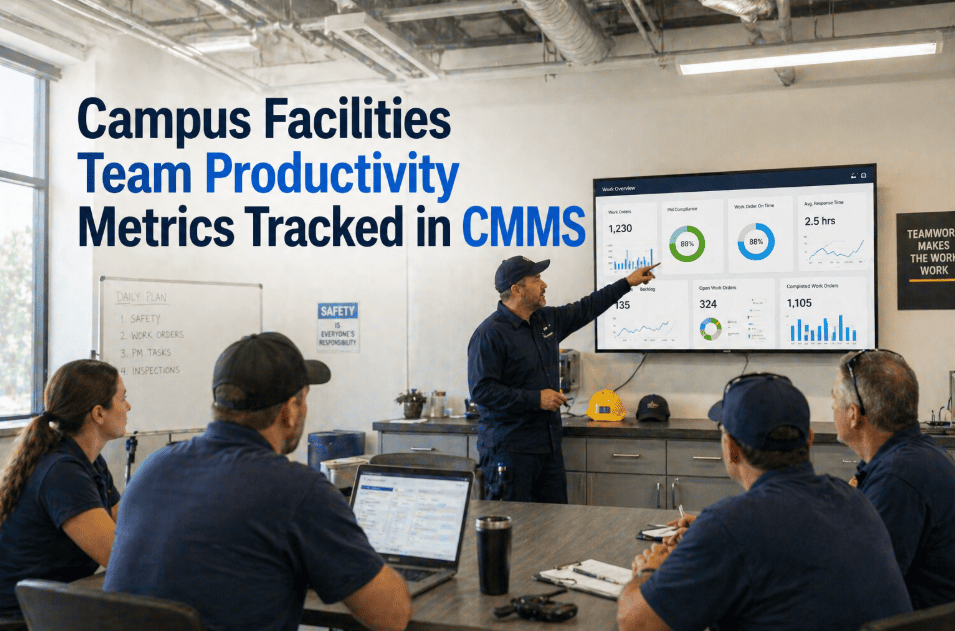
How CMMS Reduces Campus Maintenance Cost Per Square Foot
Six documented cost levers — preventive ratio, labor utilization, parts inventory turn, energy efficiency, contractor mix, and deferred maintenance reduction — that systematically move campuses from $7+/sqft toward $3/sqft.
Industry Benchmark — Cost Per Sq Ft Annual
The Cost Waterfall — From $7.00 to $3.20 Per Sq Ft
The waterfall below shows how a typical 2.5M sqft state university with 720 buildings can systematically reduce maintenance cost per sqft by $3.80 over an 18-month CMMS deployment. Each lever is documented across hundreds of APPA campus benchmarks.
$7.00
Starting Point
Reactive maintenance, paper logs, manual scheduling
−$0.85
PM Ratio Shift
Move from 25% PM to 75% PM ratio
−$0.62
Labor Utilization
From 38% to 65% wrench-time on technicians
−$0.48
Parts Inventory
Reduce stockouts from 22% to 4%
−$0.94
Energy Efficiency
Tied PMs to BAS data, 14% energy reduction
−$0.55
Contractor Mix
Shift 30% of premium contractor work in-house
−$0.36
Deferred Maintenance
Address backlog before failure events
$3.20
CMMS-Optimized
$9.5M annual savings on 2.5M sqft portfolio
The Six Cost Levers — Mechanism, Data Required, CMMS Workflow
Each lever below operates on a specific cost driver. The mechanism describes why the cost moves. The data required is what your CMMS must capture. The workflow is how OxMaint operationalizes the lever across your portfolio. Book a demo to see specific dashboards.
L1
Preventive Maintenance Ratio
−$0.85 / sqft
Mechanism
Every $1 of preventive maintenance prevents $4.80 of emergency repair. Shifting PM ratio from reactive 25/75 to preventive 75/25 reduces emergency labor, premium parts, and collateral damage.
Data Required
Asset registry with PM frequency, technician hours per WO type, parts cost per WO, downtime cost models
CMMS Workflow
Auto-generated PM calendar tied to asset profile, condition-based triggers from sensor data, PM compliance dashboard rollup at portfolio level
L2
Labor Wrench-Time Utilization
−$0.62 / sqft
Mechanism
APPA studies show typical campus technician wrench-time at 32-38% of paid hours. Best-in-class operations hit 60-65%. Each percentage point recovers $0.05/sqft of labor productivity.
Data Required
Time stamps per WO step, travel time, parts retrieval time, documentation time, certification matching
CMMS Workflow
Mobile WO with full asset context loaded, parts pre-staged at job site, route optimization, digital documentation eliminates back-office time
L3
Parts Inventory Turn
−$0.48 / sqft
Mechanism
Stockout rate of 22% (typical campus) means 1-in-5 work orders waits for parts. Each stockout costs $180-$420 in delay, expedited shipping, and re-mobilization. Inventory turn improvements compound.
Data Required
Parts consumption per asset class, lead times, vendor performance, min/max thresholds, expedited shipping costs
CMMS Workflow
Auto-reorder triggers, vendor-managed inventory integration, parts-per-asset history, predictive ordering from PM forecast
L4
Energy Efficiency from Maintenance Discipline
−$0.94 / sqft
Mechanism
Drift in HVAC, building automation, and motor systems silently increases energy use. CMMS tied to BAS data catches drift early. Typical campuses achieve 11-16% energy reduction within 18 months of CMMS-BAS integration.
Data Required
Building energy consumption baselines, equipment runtime logs, BAS sensor data, weather normalization
CMMS Workflow
BAS integration via BACnet, energy drift alerts trigger PMs, equipment efficiency degradation tracked at component level, ENERGY STAR portfolio reporting
L5
Contractor Mix Optimization
−$0.55 / sqft
Mechanism
Outside contractors charge 2.5-4× the loaded cost of in-house technicians. Many campus contractor calls happen because PM was missed or asset history is unavailable. Better records reduce contractor reliance.
Data Required
Contractor invoice categorization, technician certification matching, asset history available at job site, repeat-call analysis
CMMS Workflow
Skills matrix matching for technician assignment, full asset history accessible mobile, contractor performance dashboard, repeat-call alerts
L6
Deferred Maintenance Reduction
−$0.36 / sqft
Mechanism
Average campus deferred maintenance backlog is 1.8× annual maintenance budget. Every backlog item left to fail costs 3-5× the prevention cost. Systematic backlog reduction protects future budgets.
Data Required
Asset condition scores, remaining useful life forecasts, replacement cost estimates, criticality ranking, FCI calculation
CMMS Workflow
Asset condition tracking with annual scoring, FCI calculation per building, 5-10 year CapEx forecasting, prioritized backlog by risk-adjusted ROI
Calculate Your Specific Cost-Per-Sq-Ft Savings
Most campuses save $2.50-$4.00 per sqft within 18 months of OxMaint deployment. For a 2.5M sqft portfolio, that's $6.25M-$10M annual savings. Free tier available with no time limit.
Implementation Timeline — Typical 18-Month Cost Trajectory
Months 1-3
Foundation
Asset registry, PM templates, mobile rollout. Cost trajectory flat — investment phase. Expect $7.00/sqft baseline maintained.
$0/sqft saved
Months 4-6
PM Discipline
L1 (PM ratio) and L2 (wrench-time) gain traction. Emergency repair calls begin declining. First measurable cost reduction.
$0.85/sqft saved
Months 7-12
Operational Optimization
L3 (parts inventory), L4 (energy via BAS), L5 (contractor mix) gains compound. Deferred backlog assessment completed.
$2.80/sqft saved
Months 13-18
Steady-State
L6 (deferred maintenance) fully integrated into CapEx forecast. Steady-state $3.20/sqft achieved. Continuous improvement cycle running.
$3.80/sqft saved
Frequently Asked Questions
Are these cost-per-sqft savings figures realistic for our campus?+
The figures align with APPA Facilities Performance Indicators and documented case studies across higher-education campuses. Variance is real — a campus already running disciplined PM at $4.50/sqft will save less than one starting at $7+/sqft. The largest savings come from the L1 (PM ratio) and L4 (energy) levers. Most savings forecasts assume 18-month deployment with leadership support for change management.
Sign up for a free OxMaint account to model your specific savings.
What's the typical implementation cost vs savings?+
OxMaint's flat $8/user/month pricing means a 25-technician campus operations team pays $2,400/year. There's no implementation fee — deployment is self-serve over 3-5 days for the core platform, with optional white-glove support for larger campuses. Compared to typical $6.25M+ annual savings on a 2.5M sqft campus, the platform pays for itself within the first month of operation. ROI calculation is overwhelmingly favorable.
How does OxMaint handle the deferred maintenance backlog assessment?+
OxMaint includes asset condition scoring (1-5 scale tied to APPA's Facility Condition Index), remaining useful life tracking per asset, 5-10 year CapEx forecasting, and risk-adjusted prioritization. The backlog assessment workflow has technicians score assets during routine PMs — building a complete portfolio FCI within 6-9 months without dedicated assessment projects. Investor and ownership-grade CapEx reports export from the same data.
Can OxMaint integrate with our BAS for the energy efficiency lever?+
Yes — OxMaint integrates with major BAS platforms (Siemens Desigo, Honeywell Niagara, Johnson Controls Metasys, Schneider EcoStruxure, Distech) via BACnet, Modbus, and OPC-UA. Energy drift alerts trigger PMs automatically, equipment efficiency degradation tracks at component level, and ENERGY STAR Portfolio Manager integration is built-in. The L4 energy lever requires this integration to fully realize.
Book a demo to confirm integration with your specific BAS.
What size campus benefits most from CMMS-driven cost reduction?+
CMMS cost-per-sqft reduction scales with portfolio size, but the benefits start at 100K sqft. Below that, the absolute dollar savings may not justify dedicated CMMS effort. Above 500K sqft, CMMS becomes essential infrastructure rather than optimization. Multi-campus portfolios (state university systems, K-12 districts, community college systems) see the largest absolute savings due to the L4 (energy benchmarking across buildings) and L6 (cross-portfolio CapEx prioritization) levers.
Campus CMMS · APPA-Aligned Cost Reduction
From $7/sqft to $3/sqft. Documented. Repeatable.
OxMaint delivers all six cost-reduction levers — preventive ratio, labor utilization, parts inventory, energy efficiency, contractor mix, deferred maintenance — through a unified platform purpose-built for higher-education facilities. Free tier with no time limit.
$3.80/sf
Avg savings within 18 months
11-16%
Energy reduction via BAS link
$8/u/mo
Flat pricing, no setup fee
3-5 days
Self-serve deployment