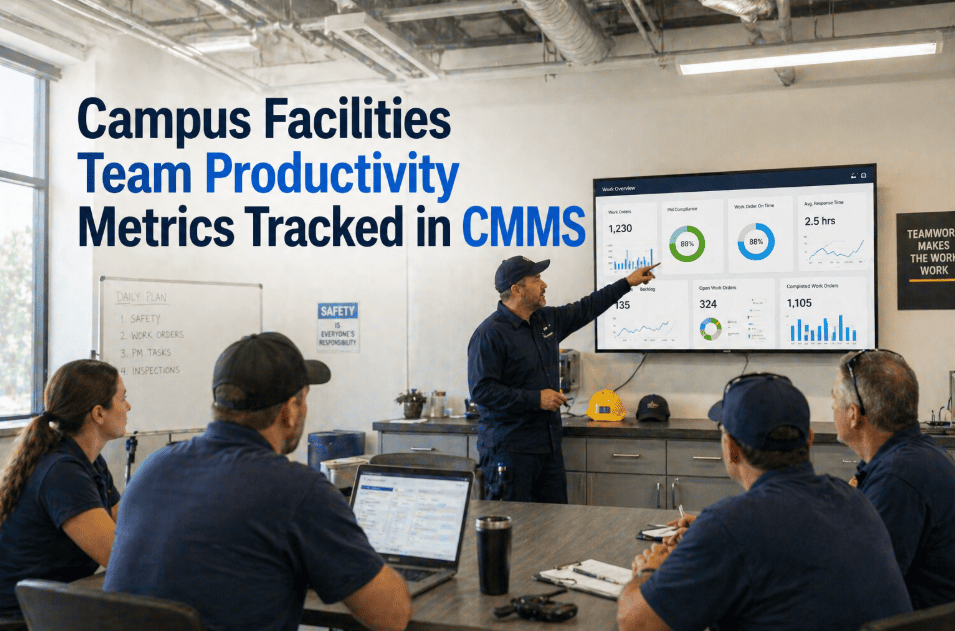
The director of facilities at a private liberal arts college had 22 maintenance technicians and zero credible answer to the simplest question her new VP of Operations could ask: how many work orders does each tech complete per day on average? Her existing system tracked who was assigned which work order — it did not track who actually closed which one, in what time, with what outcome. When pressed, she could tell him only that the team "was busy." The conversation that followed was the worst of her career. Two of those 22 technicians were genuinely her best people, completing 60% more work than the team average. Two others were closing roughly a third of what their peers did and had been for years. Without measurement, both groups had been invisible — and so had the seven technicians performing right at the median who deserved promotion conversations. Productivity tracking is not surveillance. It is the basic act of running a maintenance team like a business unit. If your campus team operates on perception instead of measurement, sign up to try Oxmaint free for 30 days or book a demo.
Campus Facilities Productivity
The Difference Between the Top and Bottom Quartile of Technicians on a Typical Campus Team Is 3x Output — and Most Directors Cannot See It
25%
Productivity gain
Documented by Gartner — organizations with technician-focused systems and KPI tracking
15%
Onboarding time reduction
For new technicians on platforms with structured workflows and skill development tracking
40–60%
Work order cycle time drop
Measured improvement when paper workflows are replaced by mobile CMMS for technicians
3x
Top vs bottom quartile output
The performance variance every campus team has — and most directors cannot quantify
The Six Productivity Metrics Every Campus Facilities Director Should Be Tracking
Productivity tracking that holds up to a defense in front of HR, the union, and the technicians themselves is built on six metrics that measure output, not effort. The right metrics surface genuine top performers, identify training needs honestly, and create the foundation for fair accountability conversations. Book a demo to see them on a live dashboard.
01
Work Orders Completed Per Day
WOs closed / scheduled work days
The headline output measure. Average completion rate per technician across rolling 30 and 90-day windows. Outliers in either direction trigger conversations — high performers get recognition, low performers get coaching.
Campus benchmark: 4–7 per day
02
Mean Time to Complete (MTTC)
Avg time from assignment to closure
How long does each work order class take this technician versus the team average? Faster is not always better — but consistent slow times on a specific work type signal a training opportunity, not a discipline issue.
Track per work type, not just overall
03
First-Time Fix Rate
% closed without follow-up WO
The honest measure of work quality. A technician who closes 8 work orders per day with a 65% first-time fix rate is creating less actual completed work than a peer at 5 per day with 95% first-time fix.
Target: above 85% on routine work
04
Wrench Time Percentage
Active work time / total shift time
Industry research shows typical wrench time runs 25–35% — the rest is travel, parts retrieval, paperwork, and waiting. Visibility on wrench time identifies process problems (parts availability, work order routing) rather than people problems.
Target: 50%+ with mobile workflow
05
PM Compliance by Technician
PMs completed on schedule / assigned
A technician who hits 98% PM compliance is doing the unglamorous work that prevents emergencies. Recognizing this metric in performance reviews shifts the team culture away from "who put out the most fires today" toward "who prevented them."
Best-in-class: 95%+ on schedule
06
Backlog Burn-Down Rate
Backlog reduction over time period
Team-level metric for whether the operation is gaining or losing ground. Healthy teams maintain stable backlog under 4 weeks. Backlog growth is an early warning sign — staffing gap, work intake change, or productivity decline.
Healthy backlog: under 4 weeks
Four Failure Modes That Undermine Campus Productivity Tracking
01
Productivity Discussions Without Data
"I think Tom is slower than the others" is a discussion that goes nowhere — and that the union representative will (correctly) push back on. Productivity conversations either start with measured output and clean comparisons, or they become subjective accusations the institution cannot defend. Most campuses skip the conversation entirely because the data doesn't exist.
02
Surveillance Framing Instead of Coaching Framing
"We're going to track everything you do" lands as threat. "We're going to surface our top performers, identify training opportunities, and stop letting good work go unrecognized" lands as fairness. Same metrics, different framing — and the framing is what determines whether the team adopts the system or undermines it.
03
Wrong Metrics Reward Wrong Behavior
Tracking work orders closed without first-time fix rate creates an incentive to close fast and reopen later. Tracking shift hours without wrench time hides process problems. Productivity systems that only measure output volume produce technicians optimizing for volume — exactly the wrong outcome on a campus where reliability matters.
04
No Differentiation Between Work Types
A technician spending all day on emergency repairs in old residence halls cannot legitimately be compared to a peer running scheduled PMs in newer buildings. Productivity systems that don't account for work type create false performance gaps — and the perception of unfairness destroys the system regardless of actual data quality.
Built for Fair, Defensible Productivity Measurement
Surface Your Best Technicians. Identify Real Training Needs. Stop Guessing.
Oxmaint tracks the six core productivity metrics across every technician, every team, and every work type — with the depth that supports fair accountability conversations and the privacy controls that protect the team from misuse.
How Oxmaint Surfaces Productivity Without Damaging Team Culture
01
Individual Technician Dashboards
Each technician sees their own productivity numbers — work orders completed, MTTC, first-time fix rate, PM compliance — across rolling windows. The same data the supervisor sees, accessible to the technician. Visibility builds trust, not resentment.
Self-awareness drives 15%+ productivity gains
02
Team-Level Performance Distribution
Quartile distributions across the team for each metric — not just averages that hide variance. Top quartile technicians become identified for advancement, recognition, and peer mentor roles. Bottom quartile triggers structured coaching conversations with documented improvement plans.
Performance variance becomes manageable, not invisible
03
Work Type Normalization
Productivity comparisons account for work type, building category, asset age, and complexity rating. The technician on emergency calls in century-old dorms is compared fairly with peers doing similar work — not penalized for tougher assignments.
Defensible comparisons across mixed work portfolios
04
Wrench Time & Process Bottleneck Visibility
When the team's wrench time runs at 28%, the question isn't "why are technicians lazy" — it's "where are they losing time." Parts retrieval delays, work order routing issues, travel time between buildings — all surfaced in process metrics that fix the system, not blame the people.
Process improvements deliver 15–25% wrench time gains
05
Skills Gap Identification
When a specific work type (e.g., VAV box troubleshooting) shows long MTTC and low first-time fix across the team, it's a training need — not a performance issue. Oxmaint flags work type performance gaps and supports targeted training plans tied to actual skill data.
Training investment targeted to real skill gaps
06
Fair Accountability Documentation
When a performance conversation has to escalate to formal HR action, the documentation is timestamped, multi-quarter, work-type-normalized, and defensible. The conversation that used to be "I think" is now "the data shows" — protecting both the institution and the technician.
HR-ready performance documentation
What Productivity Tracking Reveals on a Typical Campus Team
| Metric | Bottom quartile | Team median | Top quartile | Action |
| Work orders / day |
1.8–3.2 |
4.5 |
6.0–7.5 |
Recognition + mentor role for top quartile |
| Mean time to complete |
5.1 hrs avg |
2.8 hrs |
1.9 hrs |
Coaching on slow work types |
| First-time fix rate |
62–71% |
83% |
93–96% |
Quality bonus tied to top quartile |
| PM compliance |
74–82% |
91% |
97–99% |
Recognition for prevention culture |
| Wrench time |
21–28% |
34% |
48–54% |
Process improvement for whole team |
| Backlog ownership |
Growing |
Stable |
Declining |
Investigate why bottom quartile loses ground |
Frequently Asked Questions
How do we introduce productivity tracking without alienating the team?+
Three principles drive successful rollouts: (1) Technicians see their own data first, before supervisors do — the system is positioned as self-improvement before management oversight, (2) The metrics surface top performers as much as identify struggles — recognition is a deliberate part of the rollout, not an afterthought, and (3) Process metrics (wrench time, parts availability) get attention before people metrics — the message is "we're fixing the system, not blaming you." Most teams reach 90%+ adoption within 6 weeks when introduced this way.
Book a demo to discuss change management.
Does productivity tracking work in unionized maintenance environments?+
Yes — and many unions actively support it because the data protects technicians from arbitrary discipline as much as it identifies performance issues. Best practice: brief the union representative early, share metric definitions before launch, and confirm the data will be used in performance discussions only after objective thresholds (multiple quarters of variance, normalized for work type). Productivity data has been used to defend technicians in grievance proceedings as often as to support discipline.
How does the system handle technicians with very different specializations?+
Productivity is comparable within specialization, not across. An electrician's metrics are benchmarked against other electricians on the team and against industry data for that trade. A locksmith's metrics are benchmarked against locksmith work. Oxmaint groups comparisons by trade, work type, and asset complexity — preventing the apples-to-oranges comparisons that destroy productivity systems.
What about technicians who handle special projects or emergency response?+
Special project hours and emergency response are tracked as separate work types with their own benchmarks. The technician dedicated to a 6-month boiler replacement project isn't penalized for low daily work order count during that period. Emergency response dispatchers have different completion-rate expectations than scheduled work technicians. The metrics adjust to the reality of the role.
How do we use this data in annual performance reviews?+
The data should be one input to the review, not the entire review. Quantitative metrics surface starting points for the conversation — top performers earn formal recognition, struggling performers get structured coaching plans with documented milestones. Performance reviews remain qualitative judgments by supervisors, supported by data that makes those judgments defensible. The system is decision support, not decision automation.
Campus Team Productivity — Oxmaint
Stop Guessing Who Your Best Technicians Are. Start Knowing.
Work order completion rates, first-time fix percentages, PM compliance, wrench time, and backlog ownership — measured per technician, normalized for work type, surfaced in dashboards both supervisors and technicians can trust. The foundation for fair accountability and the recognition your top performers have been waiting for.
25%
Productivity gain documented by Gartner
15%
Onboarding time reduction for new techs
40–60%
Work order cycle time reduction
95%+
PM compliance achievable with tracking