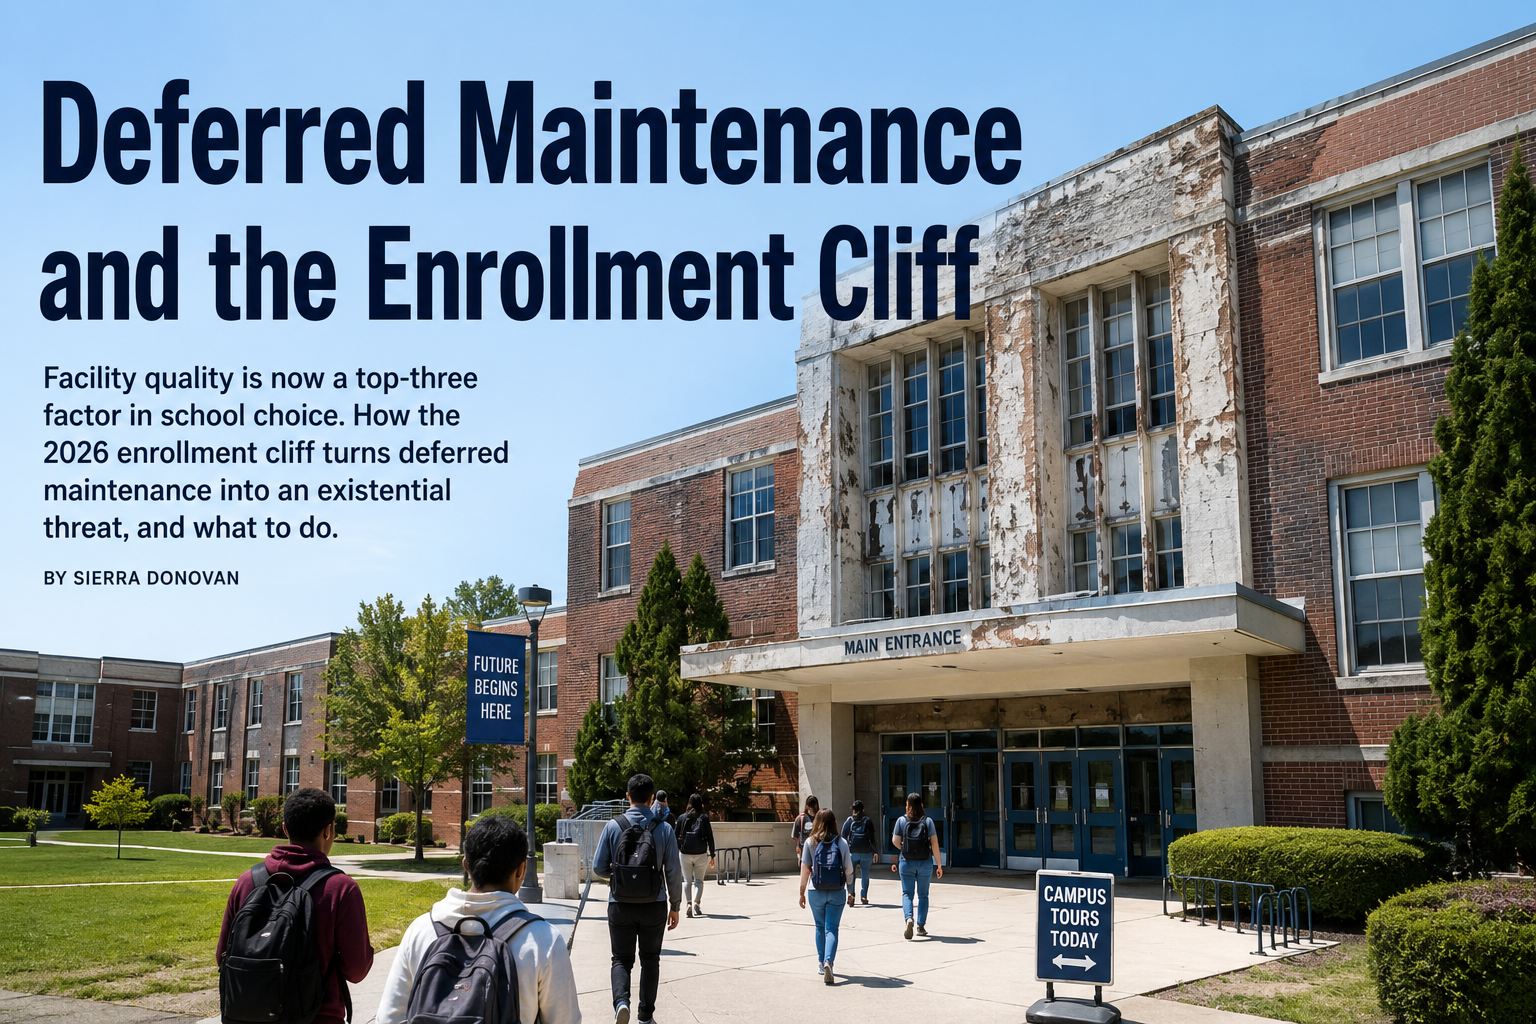
Across U.S. higher education, deferred maintenance backlogs now exceed $100 billion, and the long-predicted 2026 enrollment cliff is finally arriving — a demographic dip projected to shrink traditional college-going cohorts by roughly 10–15% over the next decade. When families tour campuses with leaky roofs, failing HVAC, and dated labs, facility condition becomes a top-three decision factor in school choice, quietly moving tuition dollars to better-maintained competitors. A modern asset strategy that ties preventive maintenance, capital planning, and enrollment forecasting together is the only way to protect both buildings and the per-student funding that sustains them. The teams that move first can Start Free Trial and turn their facility condition index into a recruitment advantage before the cliff hits.
What if your campus buildings are already deciding where next year's freshmen enroll?
Facility condition has quietly become a top-three factor in school choice. As the demographic cliff arrives, every deferred roof, HVAC, and lab repair stops being a budget line — it becomes lost tuition, lost FTE funding, and lost institutional relevance.
A leaky roof is no longer just a maintenance problem
Roughly 1 in 4 high-school seniors report crossing a campus off their list after a single visit — and physical plant quality is cited more often than dining quality or dorm amenities in exit surveys.
Deferred maintenance is the most expensive line on your recruitment budget
When you divide capital-repair consequences by headcount, the numbers stop looking like facilities decisions and start looking like enrollment strategy.
A regional comprehensive university with 8,200 students carries a $14M deferred-maintenance backlog concentrated in three residence halls and a science building. Tour-survey data attributes roughly 40 declined-enrollment decisions per year to "dated or poorly maintained facilities." At $28,000 net tuition per student, that is $1.12M in annual tuition at risk — more than the $860K annualized cost to bring the three buildings up to a Facility Condition Index of 0.05. The repair program pays for itself in under 10 months on retained tuition alone, before counting downstream gift and grant effects.
The five facility failures families notice first
Not every deferred repair moves the enrollment needle equally. These five categories consistently surface in campus-visit exit surveys and Matric-Moments research as the deciding "no" triggers.
Water-stained ceiling tiles in a dorm lobby or classroom signal neglect within 30 seconds of a tour. Roof replacement averages $8–$14 per square foot; the perception cost per prospect tour is far higher.
80% of prospective students rank "comfortable, quiet classrooms" as essential. A 20-year-old RTU cycling loudly during a 45-minute information session is a recruitment liability, not just an energy one.
STEM-intent students are the most facility-sensitive cohort. Outdated fume hoods, broken bench power, and non-functional equipment in a single tour can redirect a full-tuition engineering prospect to a peer institution.
Worn flooring, missing grout, and stalled faucets read as "this place is broke" — even at institutions with strong endowments. These are low-cost, high-signal repairs that pay back in tour conversion.
Spalling brick, faded signage, and unkempt entry paths frame the entire visit. First impressions form within 11 seconds of stepping out of the car — before a family ever meets an admissions counselor.
A 6-month roadmap that protects both buildings and headcount
Institutions that link facility condition to enrollment forecasting can sequence repairs around tour season, recruit against visible upgrades, and justify capital requests in tuition-saved terms.
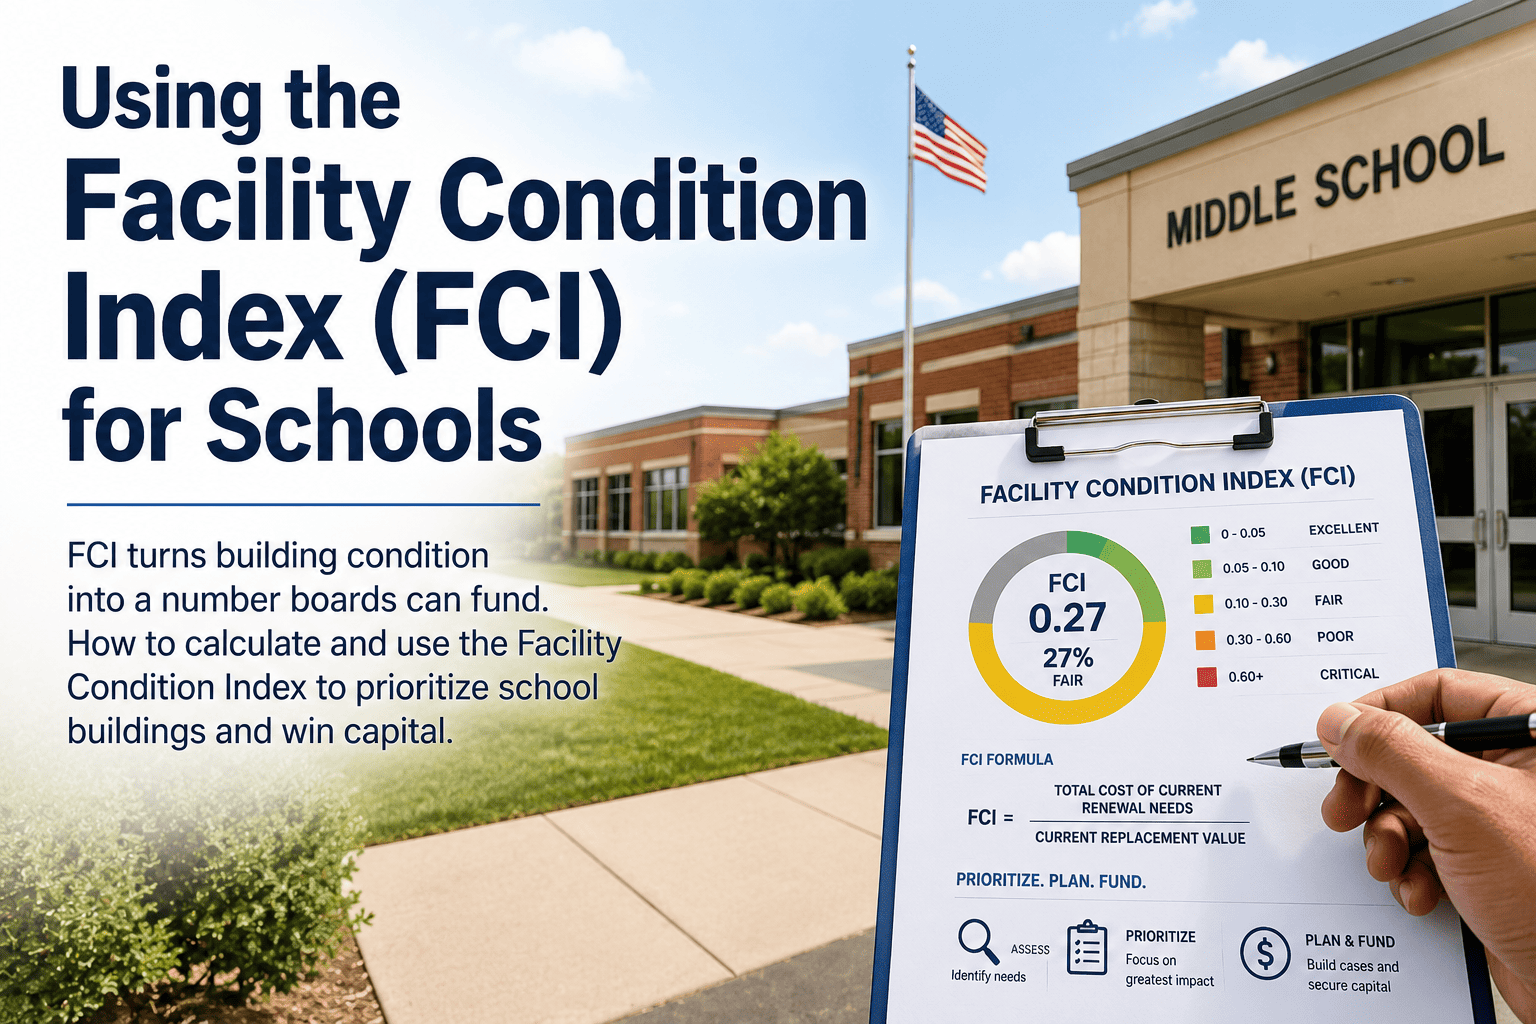
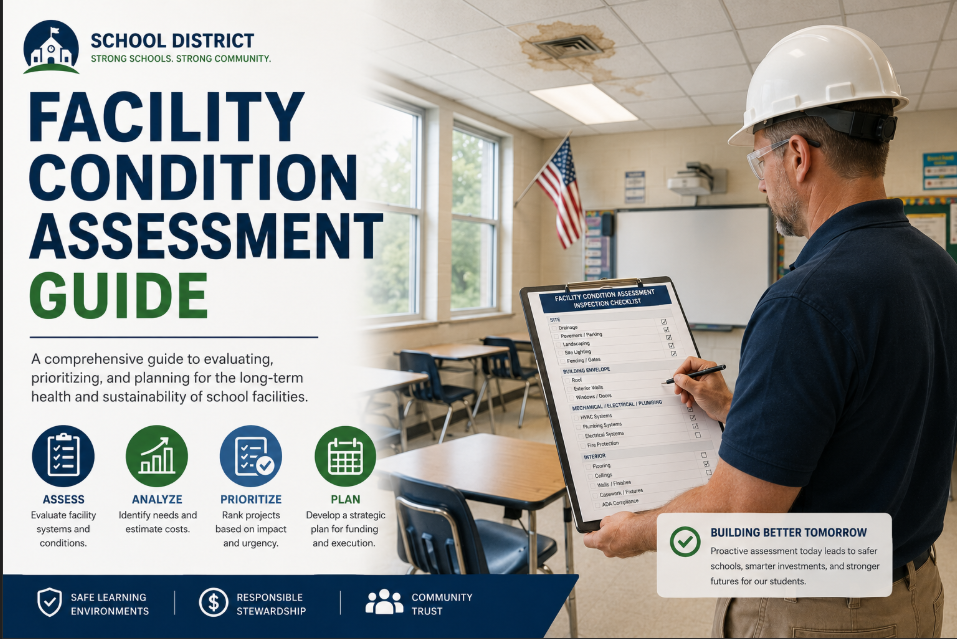
Inventory every building, score condition on a 0–100 scale, and calculate FCI (deferred-repair cost ÷ replacement value). Target a portfolio FCI below 0.05 for recruitment-critical buildings.
Overlay admissions visit paths on your asset register. Every building a prospect enters in the first 20 minutes of a tour becomes a priority Tier-1 asset for preventive maintenance scheduling.
Target the high-signal, low-cost items first: stained ceiling tiles, noisy RTUs, stalled restroom fixtures. Budget $40K–$80K for visible fixes that shift perception inside one recruitment cycle.
Move recruitment-critical buildings off reactive maintenance. A 90-day PM schedule on HVAC, lighting, and plumbing reduces visible failures by 60–70% and extends asset life by 30–40%.
Convert every major deferred project into a tuition-saved figure. A $2M roof replacement that retains 75 students at $28K each funds itself in one enrollment cycle — the language boards understand.
Feed condition scores and PM compliance into the enrollment-management dashboard. When admissions sees which buildings protect yield, facilities stops competing for budget and starts enabling it.
The cost gap that quietly bankrupts campus budgets
Two institutions with identical square footage can spend radically different amounts — and have radically different tour outcomes — based purely on whether they maintain on schedule or repair on failure.
| Dimension | Reactive "Fix-on-Failure" | Proactive PM + Condition Strategy |
|---|---|---|
| Annual maintenance cost per sq ft | $2.40–$3.80 | $1.10–$1.60 |
| Asset lifespan (HVAC, roofing) | 60–70% of rated life | 100–115% of rated life |
| Visible failures during tour season | Common, unpredictable | Rare, scheduled around visits |
| Facility Condition Index (FCI) | 0.08–0.15+ (poor) | 0.02–0.05 (good) |
| Tuition-at-risk exposure | $800K–$2.4M annually | Under $200K annually |
| Board language for capital asks | "Repair backlog" | "Enrollment protection" |
Stop losing tuition to assets you already own
Connect your facility condition index to enrollment forecasting and sequence repairs around what families actually see on tour.
Answers for facilities and enrollment leaders
Campus-visit research consistently places facility quality in the top-three decision factors alongside academic program fit and net cost. At mid-priced regional institutions, a single visibly failing building during a tour can redirect 5–8% of that visit cycle's prospects. Over a recruitment year, the compounding tuition loss almost always exceeds the repair cost — which is why connecting the two metrics changes how capital gets approved.
An FCI below 0.05 is considered good, meaning deferred repairs total less than 5% of the building's replacement value. Anything above 0.10 reads as visibly neglected to a touring family. Admissions-facing buildings — residence hall lobbies, science labs, dining commons, and the student union — should be held to the strictest standard because their condition is the one prospects and parents actually witness.
Translate every deferred project into tuition-at-risk terms. A $1.5M HVAC replacement that retains 55 students at $26,000 net tuition each returns $1.43M in a single year — before counting the downstream effect on retention and gift capacity. Frame the conversation as enrollment protection, not backlog reduction, and capital requests move from "facilities wants" to "institutional survival." You can Book a Demo to see the tuition-at-risk model built for your portfolio.
Prioritize the buildings a prospect enters during the first 20 minutes of a campus visit — typically the admissions lobby, a residence hall common area, a flagship academic space, and the dining hall. These four assets form 80% of the facility impression. Bring them to an FCI below 0.05 and a PM compliance rate above 90% before peak tour season, and you have measurably improved yield without touching the broader backlog.
Yes — modern CMMS platforms export condition scores, PM compliance, and work-order history that enrollment management can layer onto yield models. The integration does not require replacing your SIS; it requires treating facility condition as an enrollment input rather than a facilities output. Start by tracking which buildings appear on tour routes and correlating visit-to-enrollment conversion against the FCI of those specific buildings.
Turn your facility condition into an enrollment advantage
The 2026 cliff rewards institutions whose buildings sell themselves. Modernize the assets families see, sequence repairs around tour season, and justify every capital dollar in tuition retained.
Free 14-day trial · No credit card