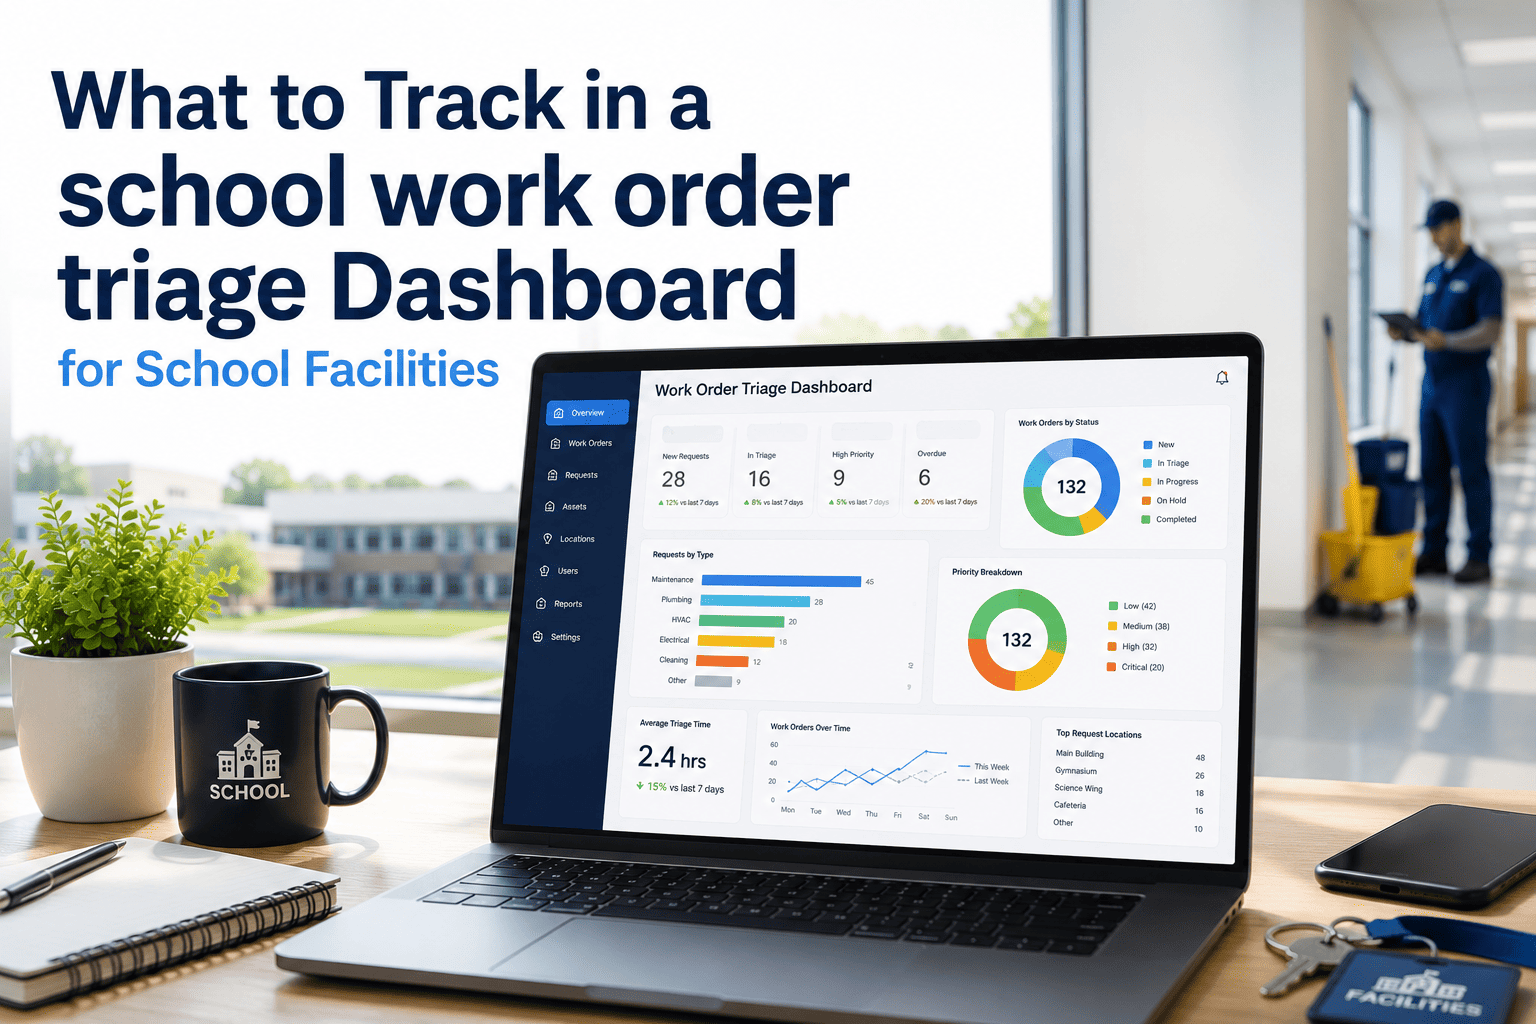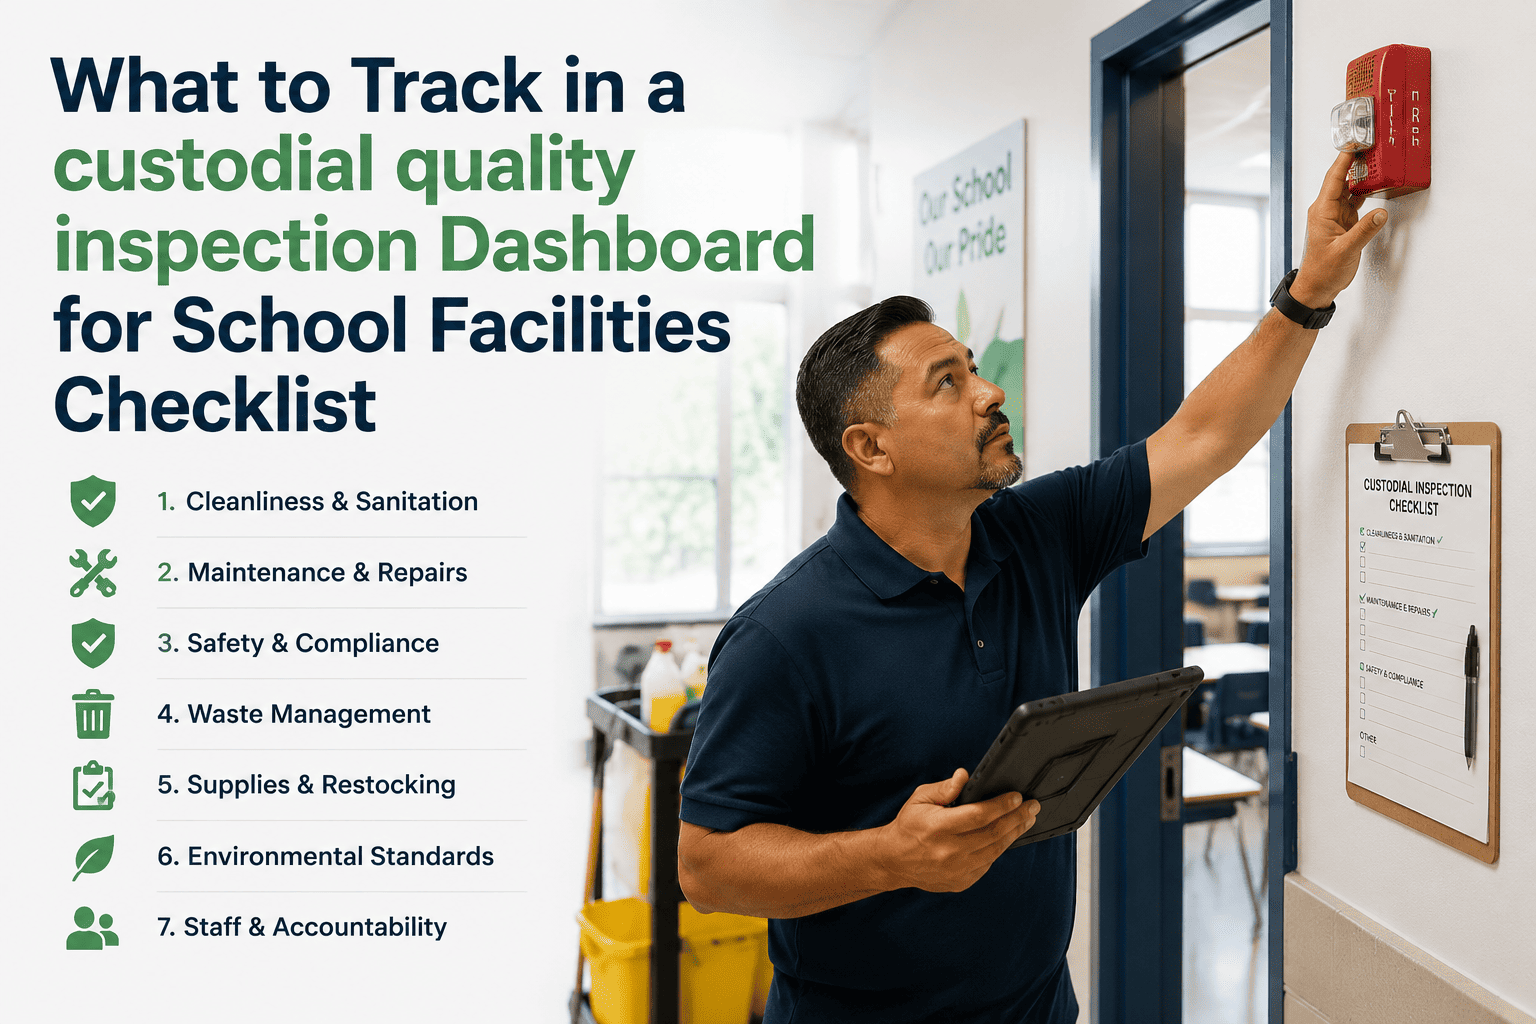
A custodial quality dashboard is only as useful as the metrics on it. Too many school facilities teams track activity — how many inspections were done — while ignoring the numbers that actually predict complaints, infection risk, and budget defensibility. A good dashboard answers four questions at a glance: are we hitting our target cleanliness level, are we inspecting the right places often enough, are failures getting fixed, and which buildings need help. This checklist lays out exactly what to put on that dashboard, with every metric pulled live from inspections logged in OxMaint.
1. Quality & Score Metrics
These are the headline numbers — the ones that answer "are we clean?" Track them per building and per space type so a strong campus average never hides a failing restroom block.
2. Inspection Coverage Metrics
A great score means nothing if half the campus was never inspected. Coverage metrics confirm the schedule is actually being run and that high-risk space is getting the frequency it needs.
3. Corrective Action Metrics
This is where most dashboards fall short. Finding defects is easy; proving they get fixed is the metric that separates a real program from a paperwork exercise.
4. Health & Safety Metrics
For school facilities, hygiene-critical space carries the highest stakes. Break these out so infection-control performance is never buried inside a general average.
5. Trend & Benchmark Metrics
A single snapshot can mislead; the direction of travel is what matters. Trends and benchmarks turn the dashboard into an early-warning system and a building-to-building comparison.
6. Accountability & Budget Metrics
The final layer turns quality data into a management and budget tool — connecting cleanliness to staffing so requests are backed by evidence, not anecdotes.