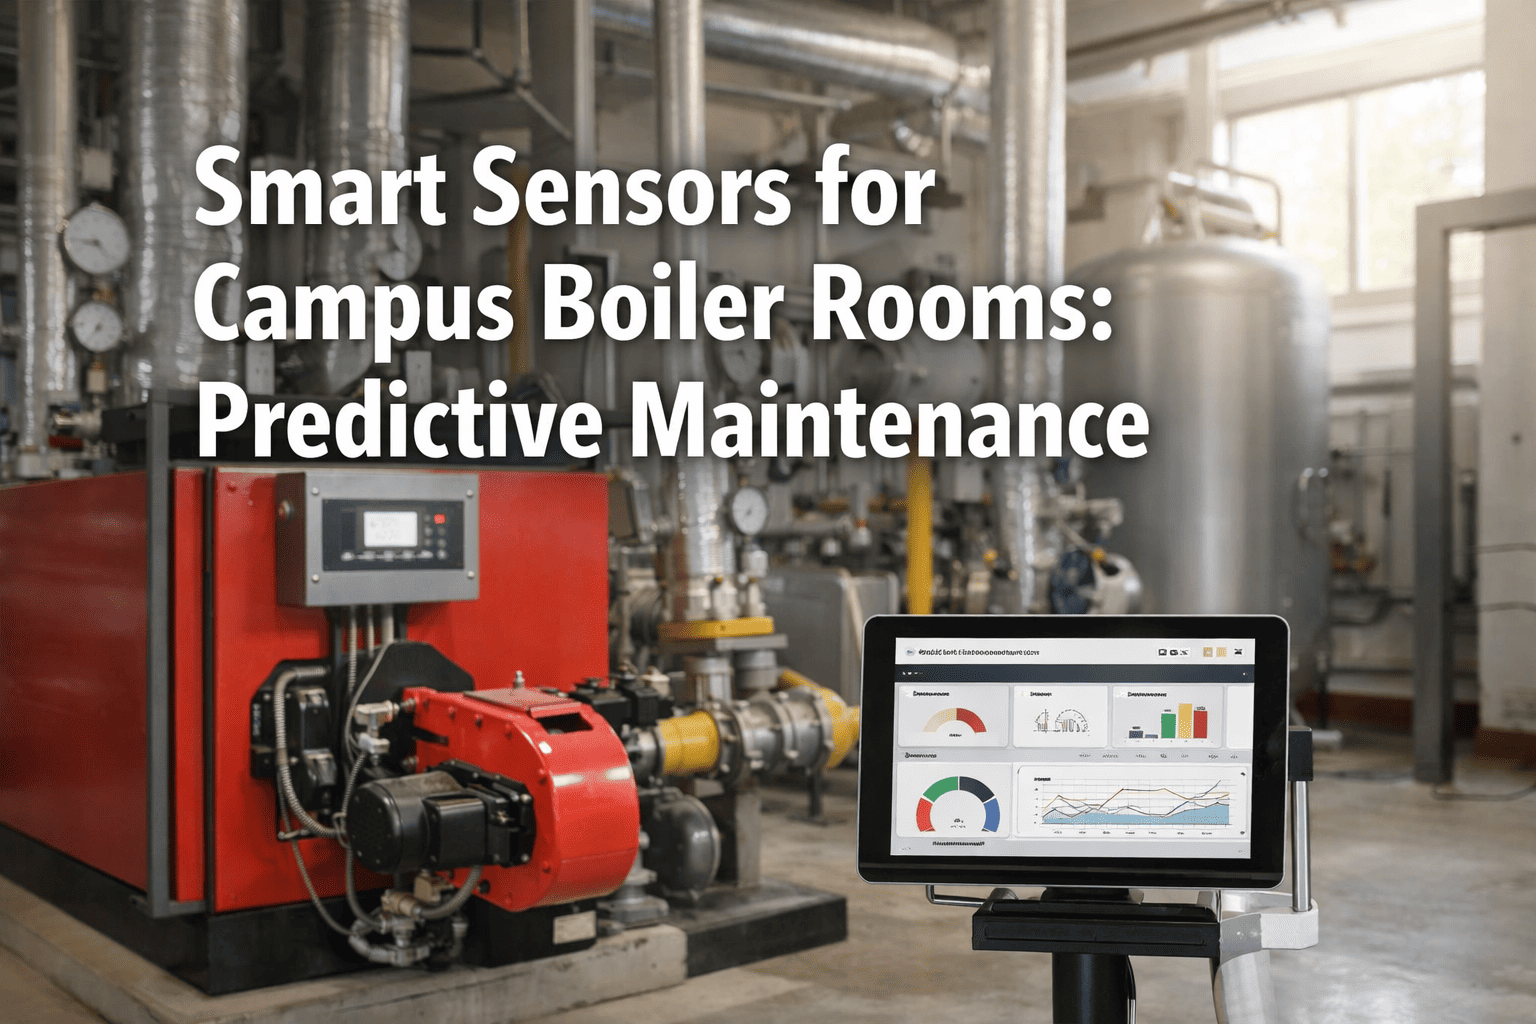
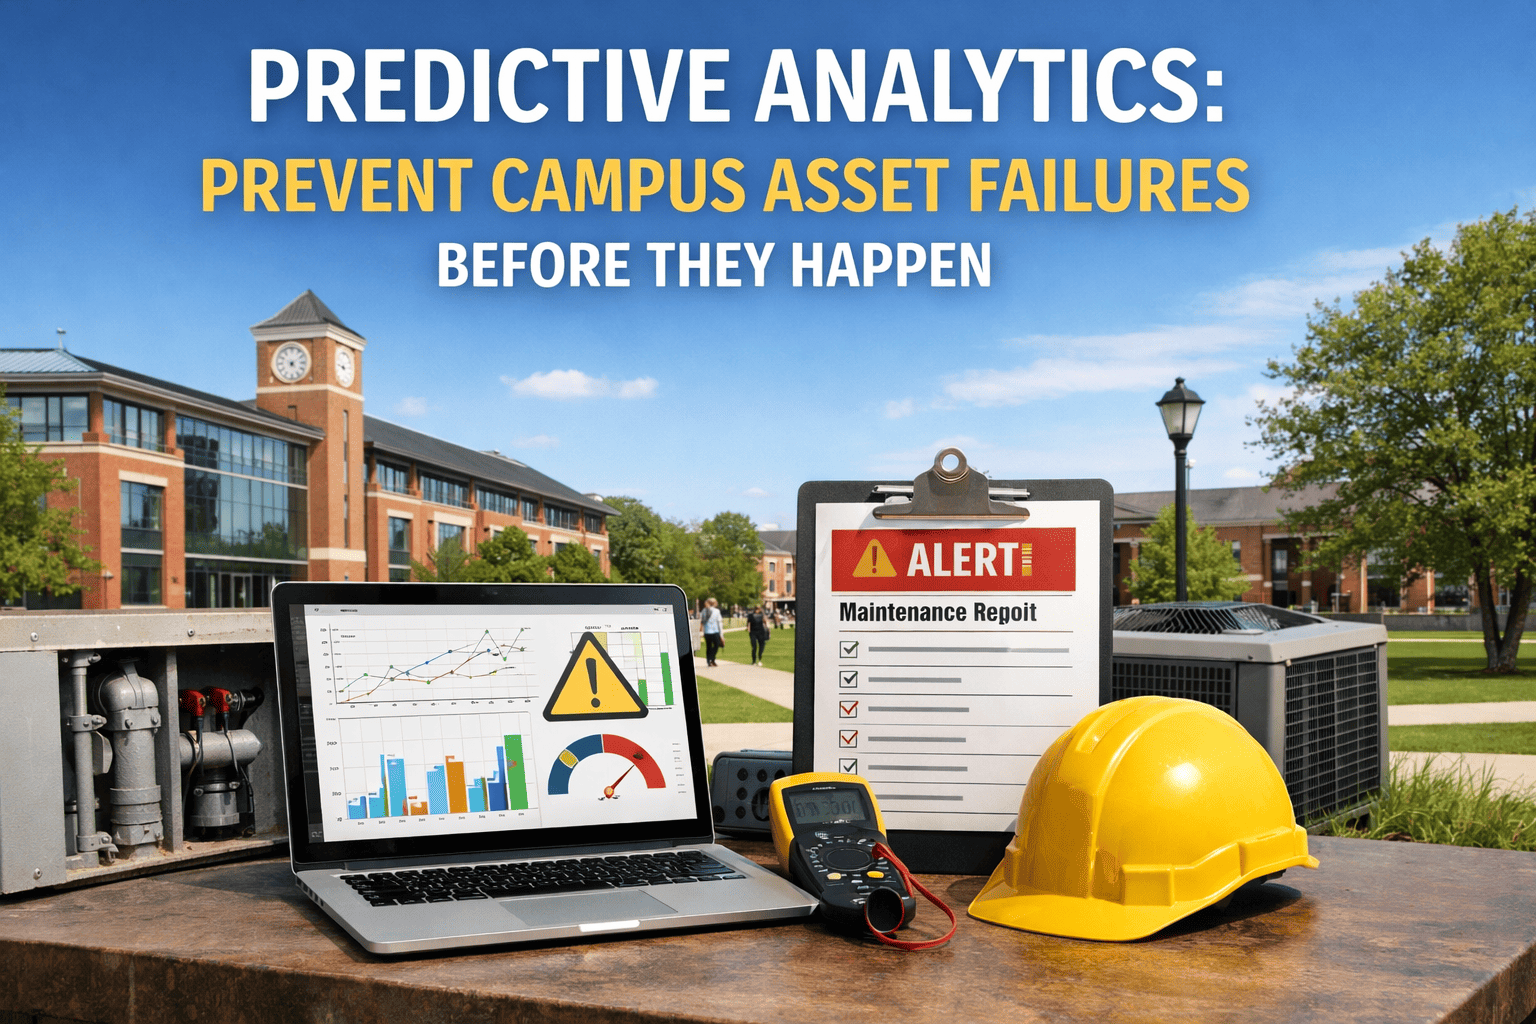
A university’s central plant chiller compressor seized on the second Saturday of August — four days before 6,200 students moved into residence halls. The emergency replacement took 11 days, cost $487,000, and required temporary portable cooling units rented at $14,000 per day. The compressor had been showing elevated vibration amplitude for 47 days before the seizure. The BAS logged the data. Nobody looked at it. A predictive maintenance system would have flagged the vibration trend at day 12, generated a work order at day 15, and scheduled the bearing replacement during the July maintenance window at a total cost of $28,000 — with zero student impact. Every university campus has chillers, boilers, switchgear, air handlers, and elevators following the same invisible degradation path right now. The question is not whether they will fail. It is whether the failure happens on your schedule or the equipment’s. Schedule a demo to see predictive maintenance running on university HVAC and critical asset data.
$487K
Average cost of a major chiller emergency vs. $28K for the same repair planned during a break
3–6 Wks
Advance warning from AI before high-risk assets reach critical failure threshold
65%
Reduction in emergency failures when maintenance is driven by AI prediction vs. calendar schedules
5–8×
First-year ROI from predictive maintenance on university critical systems
The 8 Costliest Equipment Failures on University Campuses
These eight system categories account for over 85% of emergency maintenance spending at universities. Each follows a predictable degradation pattern that AI detects weeks before human inspection can identify. Each costs 5–15× more as an emergency than as a planned repair.
01
Central Plant Chiller Compressor Failure
Central Plant · Centrifugal and Screw Chillers
Critical
$150K–$500Kemergency cost
$18K–$45Kplanned cost
3–11 daysemergency downtime
Why it’s #1: Chiller failure during cooling season affects every building on the chilled water loop. Residence halls, classrooms, labs, and dining facilities lose cooling simultaneously. Emergency compressor replacement requires crane mobilization, refrigerant recovery, and often electrical upgrades — none of which can be expedited below 3 days. During move-in or orientation, the enrollment impact is immediate and visible.
How AI catches it: Vibration analysis on compressor bearings detects spalling patterns 30–45 days before seizure. Refrigerant pressure trending identifies capacity degradation 3–6 weeks early. Motor current signature analysis detects winding insulation breakdown 20–35 days before trip. Combined multi-variable correlation achieves 92%+ prediction accuracy.
02
Main Electrical Switchgear Failure
Electrical Distribution · Main and Sub-Distribution
Critical
$200K–$1Memergency cost
$15K–$60Kplanned cost
1–30 daysemergency downtime
Why it’s #2: Arc flash events from loose bus bar connections or insulation degradation are both the most dangerous and most expensive electrical failures on campus. A main switchgear failure can de-energize an entire building or building cluster. If the failure involves a transformer, lead time for replacement is 16–52 weeks. The safety risk to maintenance staff is severe — arc flash incidents cause burns, blast injuries, and fatalities.
How AI catches it: Power quality monitoring detects harmonic distortion increases from loose connections 30–60 days before arc flash. Thermal imaging analytics identify hot spots 20–40 days early. Partial discharge monitoring catches insulation degradation 25–45 days before breakdown. The planned intervention is a scheduled shutdown for torque verification and connection tightening — $15K–$60K vs. $200K–$1M emergency.
03
Boiler Tube Failure and Combustion Fault
Central Plant · Steam and Hot Water Boilers
Critical
$100K–$400Kemergency cost
$12K–$35Kplanned cost
3–14 daysemergency downtime
Why it’s #3: Boiler failure during heating season is the winter equivalent of a chiller failure in summer — except with added safety risk from steam, pressure, and combustion. A tube failure or combustion fault can force an emergency shutdown affecting campus-wide heating, domestic hot water, and humidification for labs. Emergency boiler repair requires certified welders, pressure vessel inspections, and regulatory re-certification before restart.
How AI catches it: Feedwater chemistry monitoring detects scaling and corrosion conditions 4–8 weeks before tube failure. Combustion analysis (O2, CO, stack temperature) identifies burner degradation 3–6 weeks early. Pressure and temperature trending catches developing leaks and control faults 2–4 weeks before shutdown conditions.
The Top 3 Failures Cost $450K–$1.9M Each. All Are Preventable.
Oxmaint monitors every critical campus system — generating predictive work orders weeks before failure so your team repairs during breaks, not during move-in week.
04
Air Handling Unit Fan Bearing Failure
HVAC Distribution · 20–60 AHUs Per Campus
High Volume
$15K–$85Kemergency cost per unit
$3K–$8Kplanned cost per unit
4–8×/yrcampus-wide frequency
Why it matters: Individual AHU failures are not catastrophic, but their frequency makes them the highest-volume failure category on campus. Each failure affects 1–3 floors of a building — displacing classrooms, overheating labs, or leaving residence hall floors without ventilation. During cooling season, an AHU failure triggers occupant complaints within hours.
How AI catches it: Vibration sensors on fan bearings detect defect frequencies 20–35 days before failure. Motor current analysis identifies belt slippage and bearing drag 15–25 days early. Energy consumption trending flags efficiency degradation from coil fouling that increases load on fan bearings. Combined detection: 3–6 week warning.
05
Elevator Controller and Door Operator Failure
Vertical Transport · 15–60 Elevators Per Campus
ADA Critical
$5K–$15K/dayout-of-service cost
$2K–$8Kplanned repair cost
6–12×/yrcampus-wide frequency
Why it matters: Elevator failures are the most frequent ADA compliance trigger on campus. An out-of-service elevator in a building without redundancy makes the building inaccessible to wheelchair users — triggering ADA complaints that cost $150K–$500K per lawsuit. Entrapment events create safety incidents, parent complaints, and reputational damage disproportionate to the repair cost.
How AI catches it: Door cycle time trending detects motor degradation 14–28 days before failure. Controller fault code pattern analysis identifies developing electronic failures 10–21 days early. Motor current analysis on hoist machines detects bearing and brake wear 20–35 days before functional failure. The AI dispatches the elevator service contractor with specific fault codes before the elevator stops working.
06
Steam and Hydronic Distribution Pipe Failure
Underground Distribution · Building Risers · Headers
High Damage
$100K–$680Kemergency cost
$8K–$25Kplanned repair cost
2–6×/yrcampus-wide frequency
Why it matters: Pipe failures cause the highest collateral damage of any campus failure type. A burst pipe in a residence hall at 2 AM damages 3 floors, displaces 40 students, triggers $220K–$450K in remediation, and generates insurance claims that increase premiums for years. Underground distribution failures can shut down heating or cooling to entire building clusters.
How AI catches it: Water flow sensors detect pressure anomalies indicating developing leaks 7–21 days before burst. Temperature differential monitoring across distribution circuits identifies insulation failure and corrosion zones 14–30 days early. Acoustic leak detection on underground systems catches micro-leaks weeks before they become catastrophic.
07
Cooling Tower and Condenser Water System
Central Plant · Condenser Water Loop
Seasonal
$40K–$180Kemergency cost
$5K–$15Kplanned cost
2–4×/yrcampus-wide frequency
Why it matters: Cooling tower failure does not just stop the tower — it degrades chiller efficiency by 15–30% or forces chiller shutdown if condenser water temperature exceeds limits. Fan motor failures, fill degradation, and basin leaks are progressive failures that worsen over weeks while consuming excess energy before they cause a shutdown.
How AI catches it: Condenser water approach temperature trending identifies fill degradation and scaling 3–8 weeks before performance drops below operational thresholds. Fan motor vibration and current analysis detects bearing wear 20–35 days early. Basin water level monitoring catches developing leaks before they drain the system.
08
Emergency Generator and UPS Failure
Emergency Power · Data Centers · Life Safety
Life Safety
$50K–$500Kconsequence cost
$5K–$20Kplanned service cost
1–3×/yrcampus-wide frequency
Why it matters: Generator failures are invisible until they matter — the generator sits idle for months, then fails to start during the one power outage where it is needed. UPS battery degradation is progressive and silent. When the data center loses power because the UPS batteries are at 40% capacity instead of 100%, the research data loss and IT recovery costs dwarf the battery replacement cost.
How AI catches it: Battery impedance monitoring detects cell degradation 30–90 days before capacity drops below the critical threshold. Generator load bank test analysis identifies developing fuel system, cooling, and governor issues 14–30 days early. Automatic transfer switch cycle time monitoring catches mechanical degradation before it causes a failed transfer during an actual outage.
Emergency vs. Planned Cost: The Financial Case
Cooling Tower
$180K vs $15K
The ratio ranges from 5× to 27×. Every emergency that predictive maintenance prevents recovers the cost of monitoring dozens of assets. A campus preventing just 3–5 major emergencies per year saves $500K–$2M annually against a monitoring investment of $100K–$250K. Sign up free to see AI risk scoring applied to your campus critical assets from the first week of deployment.
How Predictive Maintenance Works on Campus Systems
S1
Stage 1: Continuous Data Collection — BAS control points, IoT sensors, and energy meters feed temperature, pressure, vibration, flow, current, and energy data to the AI platform continuously. No manual data collection. No periodic inspections. The system watches every monitored asset 24/7/365 — including nights, weekends, breaks, and holidays when nobody is in the facilities office.
Data sources: Existing BAS (80%+ of campuses have sufficient data to begin), IoT vibration sensors on rotating equipment, power quality monitors on electrical distribution, water flow sensors on piping, and energy meters at the building or circuit level.
S2
Stage 2: Behavioral Model Building — The AI builds a unique behavioral model for each monitored asset — learning what normal operation looks like under varying conditions: different outdoor temperatures, different load levels, different times of day. The model is specific to your chiller, not a generic chiller — because your chiller at 60% load in October behaves differently than the same model at 95% load in August.
Timeline: Initial models calibrate within 2–4 weeks of data connection. Full seasonal calibration requires one heating and one cooling season. Early predictions begin within the first month; accuracy improves continuously with every data point.
S3
Stage 3: Anomaly Detection and Diagnosis — When actual performance deviates from the behavioral model, the AI identifies the deviation, classifies the probable failure mode, estimates severity, and projects time-to-failure. The output is not an alarm — it is a diagnosis: “Chiller #2 drive-end bearing shows outer race defect frequency at Stage 2. Current vibration 0.18 in/sec, trending toward 0.35 in/sec. Estimated 18–22 days to functional failure at current load.”
Detection types: Threshold alerts (immediate for acute conditions), trend analysis (rate-of-change for gradual degradation), and pattern recognition (AI matching against known failure signatures). Multi-variable correlation across sensors increases confidence from 80% to 92%+.
S4
Stage 4: Predictive Work Order Generation — The CMMS auto-generates a work order with: the specific asset, the diagnosed failure mode, the severity and time-to-failure estimate, the recommended repair action, the required parts (with current stock status), the estimated labor hours, and the optimal scheduling window based on time-to-failure and academic calendar. The work order is complete before any human sees it.
Scheduling intelligence: If the predicted failure is 18–22 days out and Thanksgiving break is in 12 days, the system schedules the repair for break week — zero student disruption, standard labor rates, parts pre-ordered. The planner reviews and approves; they do not diagnose or schedule from scratch.
S5
Stage 5: Repair Verification and Feedback Loop — After repair, the AI compares post-repair sensor data against the pre-fault baseline. Verified recovery: vibration returns to 0.08 in/sec (from pre-fault 0.18). The confirmed diagnosis feeds back to the AI, improving future prediction accuracy from 82–85% at deployment to 92–96% by month 12. Every confirmed prediction and every corrected false positive makes the system more accurate for your specific campus equipment.
Continuous improvement: By month 12, the AI has processed 12 months of campus-specific failure data and verified outcomes — making predictions that no generic industry model can match because they are calibrated to your equipment, your operating patterns, and your environmental conditions.
Implementation: From BAS Data to Predictive Alerts in 30–90 Days
Predictive maintenance deploys faster than most campus leaders expect because 80%+ of the data it needs already exists in your BAS and CMMS. No new hardware is required for initial deployment on most campuses. Start your free trial and have predictive monitoring operational on your critical systems within the first month.
Days 1–14
Connect BAS and energy meters. Import asset registry. Map sensors to assets. Behavioral models begin learning. First threshold alerts active on day 1.
Days 15–30
First anomaly alerts generated. Energy waste faults identified. Initial predictive work orders on highest-risk assets. Quick-win repairs documented.
Days 31–60
Full behavioral models calibrated. All 8 system categories monitored. Predictive work orders scheduling into academic breaks. Risk scoring dashboard live.
Days 61–90
AI accuracy reaches operational maturity. Capital planning intelligence activated. Board-ready predictive dashboards deployed. Continuous improvement compounds.
Your Campus Has Assets Failing Right Now That You Cannot See. AI Can.
Oxmaint monitors every chiller, boiler, switchgear panel, AHU, elevator, pipe system, cooling tower, and generator on your campus — detecting failures 3–6 weeks before they happen, generating work orders scheduled for breaks and off-hours, and documenting every prevented failure for your board and your budget. 30 days to first predictive alerts. 5–8× ROI in year one.
Frequently Asked Questions
Do we need new sensors on every asset to use predictive maintenance?
No. Most university campuses already have BAS systems generating temperature, pressure, flow, and equipment runtime data that feed predictive models. For 80%+ of your buildings, existing BAS data is sufficient to begin detecting faults within the first two weeks. Targeted IoT sensor additions ($200–$500 per monitored point) enhance detection on specific high-value systems — vibration sensors on chiller compressors, power quality monitors on switchgear, flow sensors on distribution piping — but these are prioritized additions, not prerequisites. Start with what you have. Add sensors where the ROI justifies them.
Sign up free to see what your existing BAS data reveals about developing failures on your campus.
How accurate are the AI predictions, and what about false positives?
Initial deployment accuracy is 82–85%, improving to 92–96% by month 12 as the AI learns your campus-specific equipment behavior. False positive rates start at 10–15% and drop below 5% within 6 months. Every prediction includes a confidence score and the specific sensor evidence behind it — the technician can verify the AI’s diagnosis before acting. When a prediction is confirmed or corrected during repair, that outcome feeds back to the model. The system gets smarter with every work order closed. At 92%+ accuracy, the 8% miss rate is overwhelmingly offset by the 92% of correctly predicted failures that would have been emergencies without AI.
How does predictive maintenance integrate with our existing PM schedules?
Predictive maintenance does not replace PM — it enhances it. Calendar PM continues on assets where it is the right strategy (low-cost, high-volume, regulatory-driven). For high-value critical assets, AI predictions supplement PM by catching between-interval failures that calendar schedules miss and by extending PM intervals when the AI confirms the asset is healthy. Over time, the AI recommends which PM frequencies should increase (asset degrading faster than the schedule assumes) and which should decrease (asset healthier than the calendar suggests) — optimizing the total maintenance budget rather than just adding monitoring cost.
Can predictive maintenance schedule repairs during academic breaks automatically?
Yes — this is one of the highest-value capabilities for education. When the AI detects a developing failure with an estimated 18–22 day time-to-failure and the academic calendar shows Thanksgiving break in 12 days, the system schedules the repair for break week automatically. Parts are pre-ordered. The technician is assigned. The work order is ready to execute the first day of break. The result is zero student disruption, standard labor rates (no overtime), and standard parts pricing (no expediting).
Book a demo to see academic calendar integration scheduling predictive repairs into your upcoming break windows.
What is the realistic ROI for a university deploying predictive maintenance?
A mid-size university (50–100 buildings, 2,500+ major assets) typically invests $100K–$250K annually in predictive monitoring against $500K–$2M in documented annual savings — a 5–8× first-year ROI. The savings come from three sources: prevented emergency failures (the $487K chiller emergency becomes a $28K planned repair), extended asset life (30% longer useful life from condition-based rather than calendar-based maintenance), and energy waste correction (15% energy savings from detecting HVAC faults that waste energy invisibly). Most institutions see positive ROI within the first 60–90 days from the first 2–3 prevented emergency events alone.