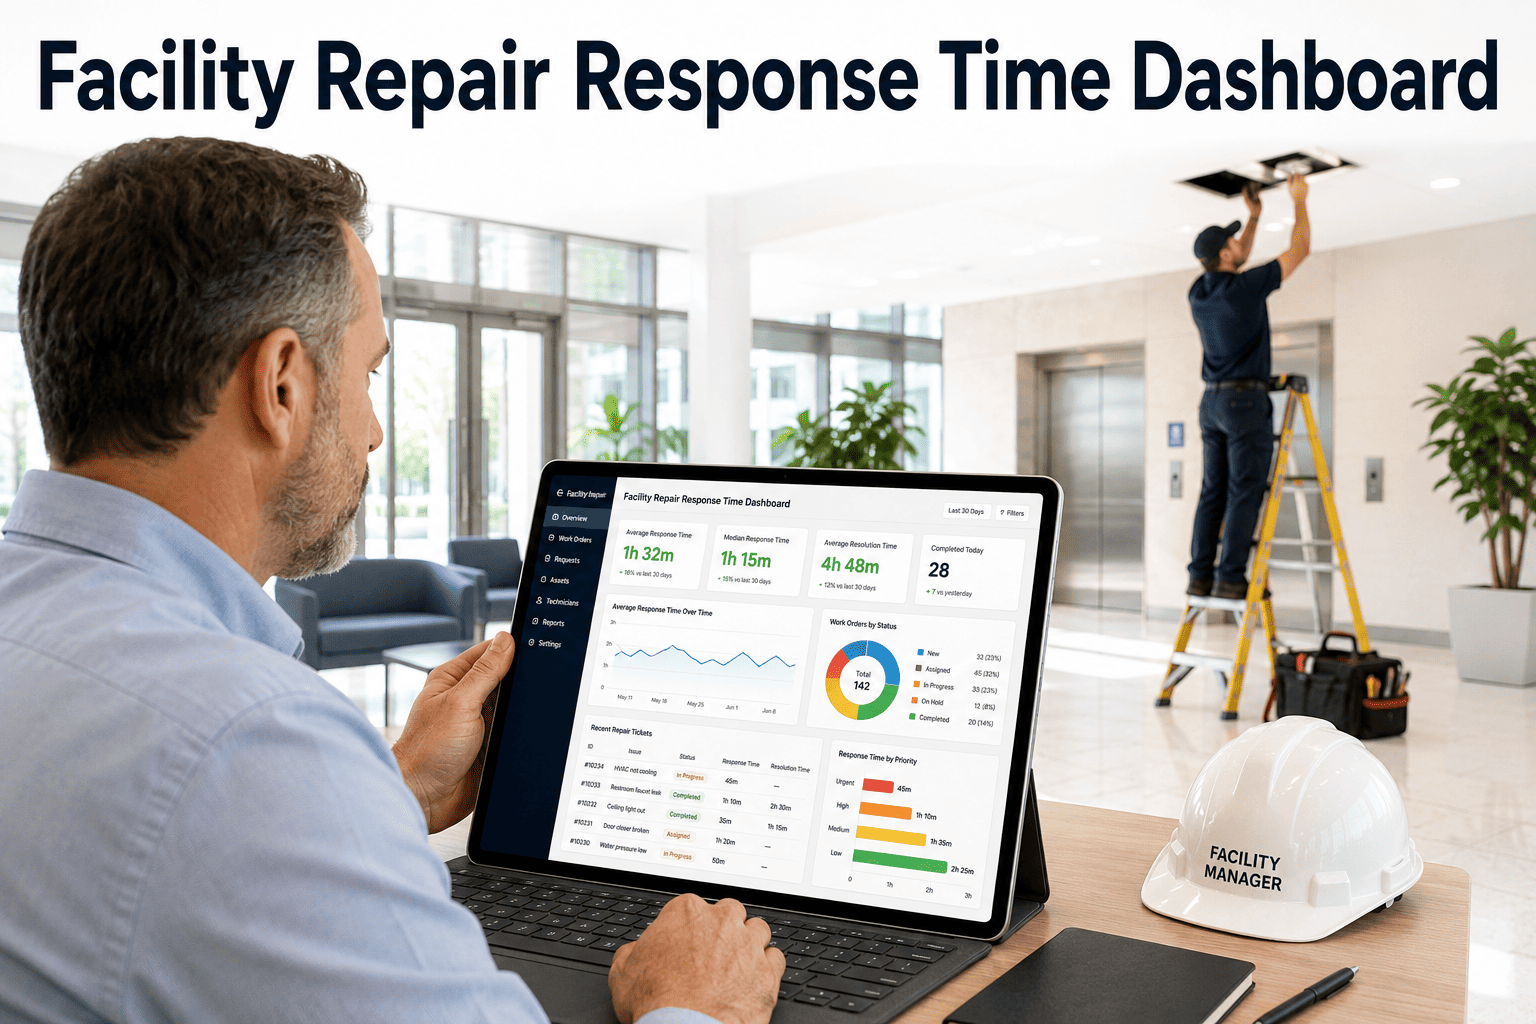
Building decarbonization is no longer a sustainability aspiration — it is a capital planning reality for commercial real estate owners, corporate facility teams, and public sector portfolios facing mandatory disclosure deadlines, carbon pricing exposure, and investor ESG expectations. Operational carbon from HVAC, lighting, and building systems typically accounts for 40 to 60% of a commercial building's total emissions, and the path to meaningful reduction runs through maintenance decisions: which assets get upgraded, in what sequence, and how the energy impact is measured. Oxmaint's Energy and ESG Reporting provides the asset intelligence and maintenance data infrastructure that decarbonization roadmaps require to move from target-setting to verifiable execution.
AI Building Decarbonization Maintenance Roadmap
40–60% of commercial building emissions are operational. They are controlled by maintenance decisions — not by capital projects alone.
The 4-Tier Decarbonization Action Framework
Effective decarbonization roadmaps organize actions by investment level and carbon impact per dollar spent. The highest-return interventions are typically maintenance-driven — fixing HVAC degradation, eliminating energy waste from faults, and optimizing controls — before capital-intensive asset replacements. Many buildings can achieve 20 to 30% operational carbon reduction through maintenance and controls optimization alone, without any capital equipment replacement.
- Setpoint optimization and scheduling
- Occupancy-based ventilation control
- HVAC fault correction (VAV, AHU)
- Utility interval data analysis
- LED lighting and controls retrofit
- Building automation optimization
- Variable speed drive installation
- Smart thermostat and sensor upgrades
- Heat pump HVAC replacement
- Low-GWP refrigerant transition
- High-efficiency chiller replacement
- Building envelope improvements
- Full HVAC electrification
- On-site renewable generation
- Thermal energy storage
- Net-zero building certification
Asset Prioritization Matrix for Decarbonization Planning
Not every asset upgrade produces the same carbon-per-dollar outcome. The prioritization matrix below provides a framework for ranking assets against their carbon intensity and remaining useful life — the combination that determines whether maintenance investment, retrofit, or full replacement delivers the highest decarbonization return. Oxmaint generates this matrix automatically from your asset registry and energy data.
| Asset Category | Remaining Useful Life | Carbon Intensity | Recommended Action | Priority |
|---|---|---|---|---|
| Gas boiler (>15 yrs old) | 0–3 years | Very High | Replace with heat pump | P1 Now |
| R-410A chiller fleet | 3–8 years | High (GWP + energy) | Transition plan 2026–2027 | P1 Plan |
| Constant-speed AHU fans | 5–10 years | Medium | VSD retrofit at next PM | P2 |
| VAV system with drift | 10+ years | Medium (fault-driven) | Fault correction + retune | P2 |
| New heat pump (<5 yrs) | 12–18 years | Low | Optimize PM and analytics | P3 Monitor |
Build Your Decarbonization Roadmap from Real Asset Data
Oxmaint's platform turns your maintenance history and asset registry into a prioritized decarbonization plan — with carbon impact estimates, upgrade schedules, and ESG reporting built in.
How Maintenance Data Feeds ESG Reporting
Carbon reporting for buildings — whether for GRESB, TCFD disclosure, SEC climate rules, or voluntary targets like Science-Based Targets initiative (SBTi) — requires defensible, traceable energy and emissions data at the asset level. Facilities teams that generate this data as a byproduct of structured maintenance programs spend a fraction of the time on disclosure that teams using retrospective data collection do — and produce far more credible numbers.
"The biggest misconception in building decarbonization is that it starts with capital. The fastest carbon reductions I have seen in the field come from fixing the maintenance backlog — HVAC faults running equipment at 70% efficiency, controls that were never recommissioned after a BAS upgrade, VFDs bypassed after a one-time failure and never restored. Getting the existing portfolio running as designed is frequently a 15 to 25% carbon reduction with near-zero capital spend. That is the baseline you build your investment case from. Then you know what the capital upgrades are actually buying."