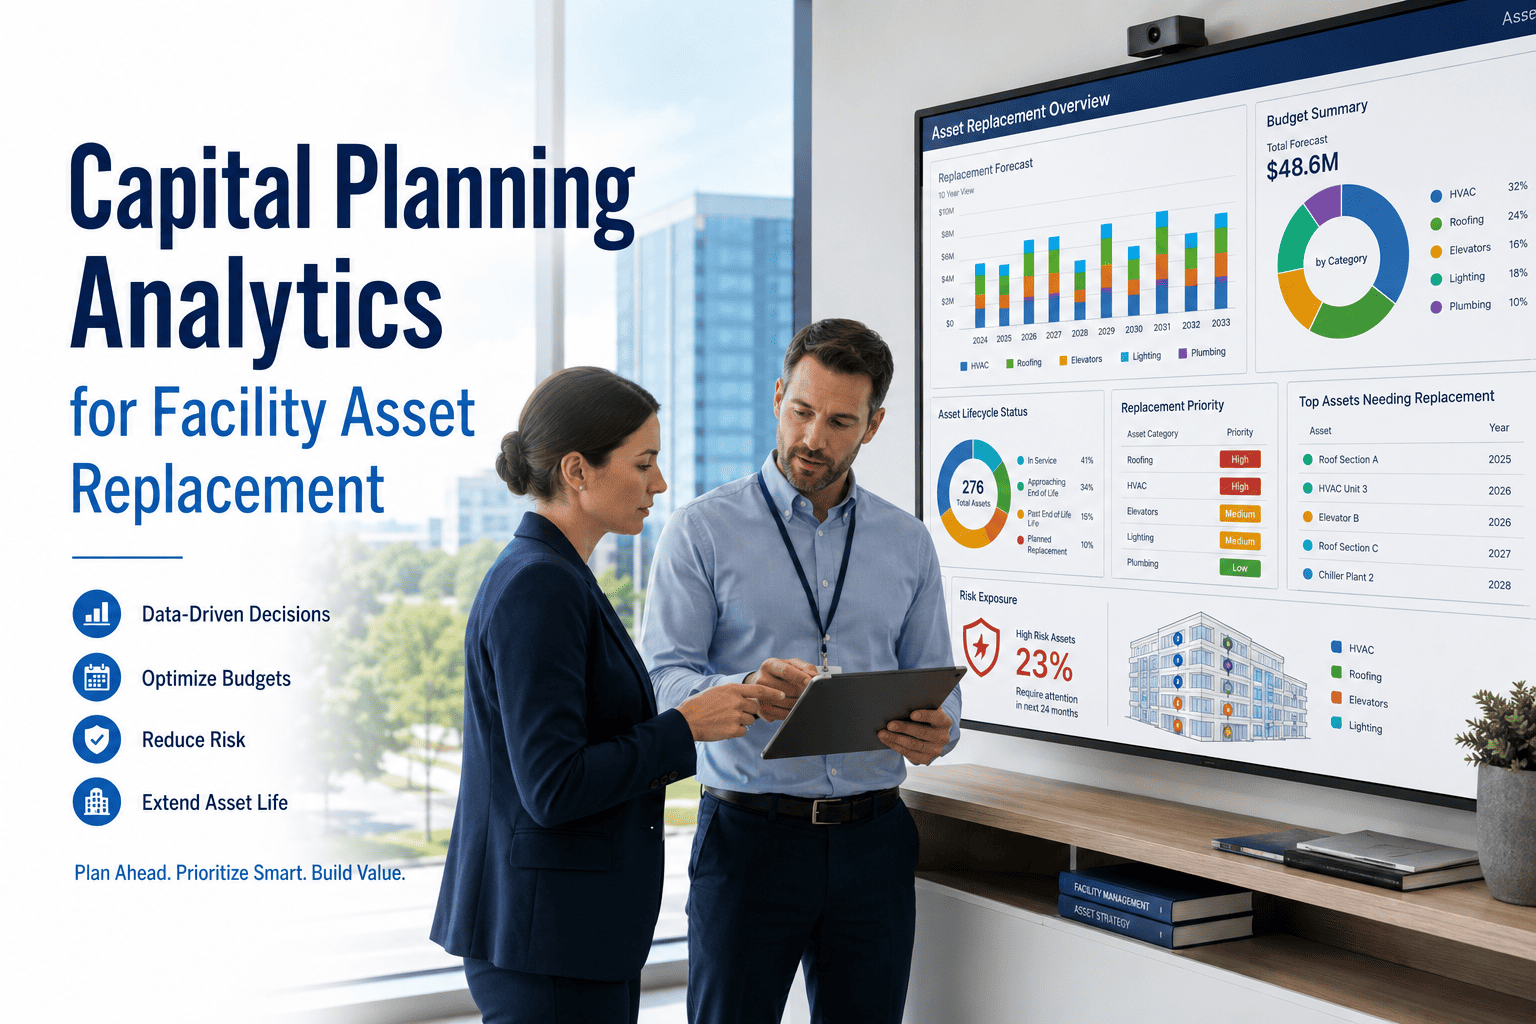
Every year, facility directors face the same impossible question: which assets do we replace now, and which can wait? Without structured capital planning data, the answer defaults to whoever complains loudest — not which asset poses the greatest risk or delivers the best lifecycle ROI. Oxmaint's capital planning analytics gives you a ranked, scored, and defensible asset replacement roadmap built on condition data, lifecycle cost, maintenance history, and risk — not politics. If you're preparing for your next CapEx cycle, book a 30-minute planning session and walk away with a prioritization framework tailored to your facility portfolio.
Capital Planning Intelligence
Replace the Right Assets at the Right Time — With Data, Not Guesswork
23%
Avg. CapEx saved through optimized replacement timing
4.2x
Lifecycle cost reduction: proactive vs. reactive replacement
68%
Facility teams using gut instinct for replacement decisions
The Four Inputs That Drive Smart Asset Replacement Decisions
Optimal replacement timing is never a single variable. These four data layers — when combined — give facility leaders the full picture before committing capital.
1
Lifecycle Cost Analysis
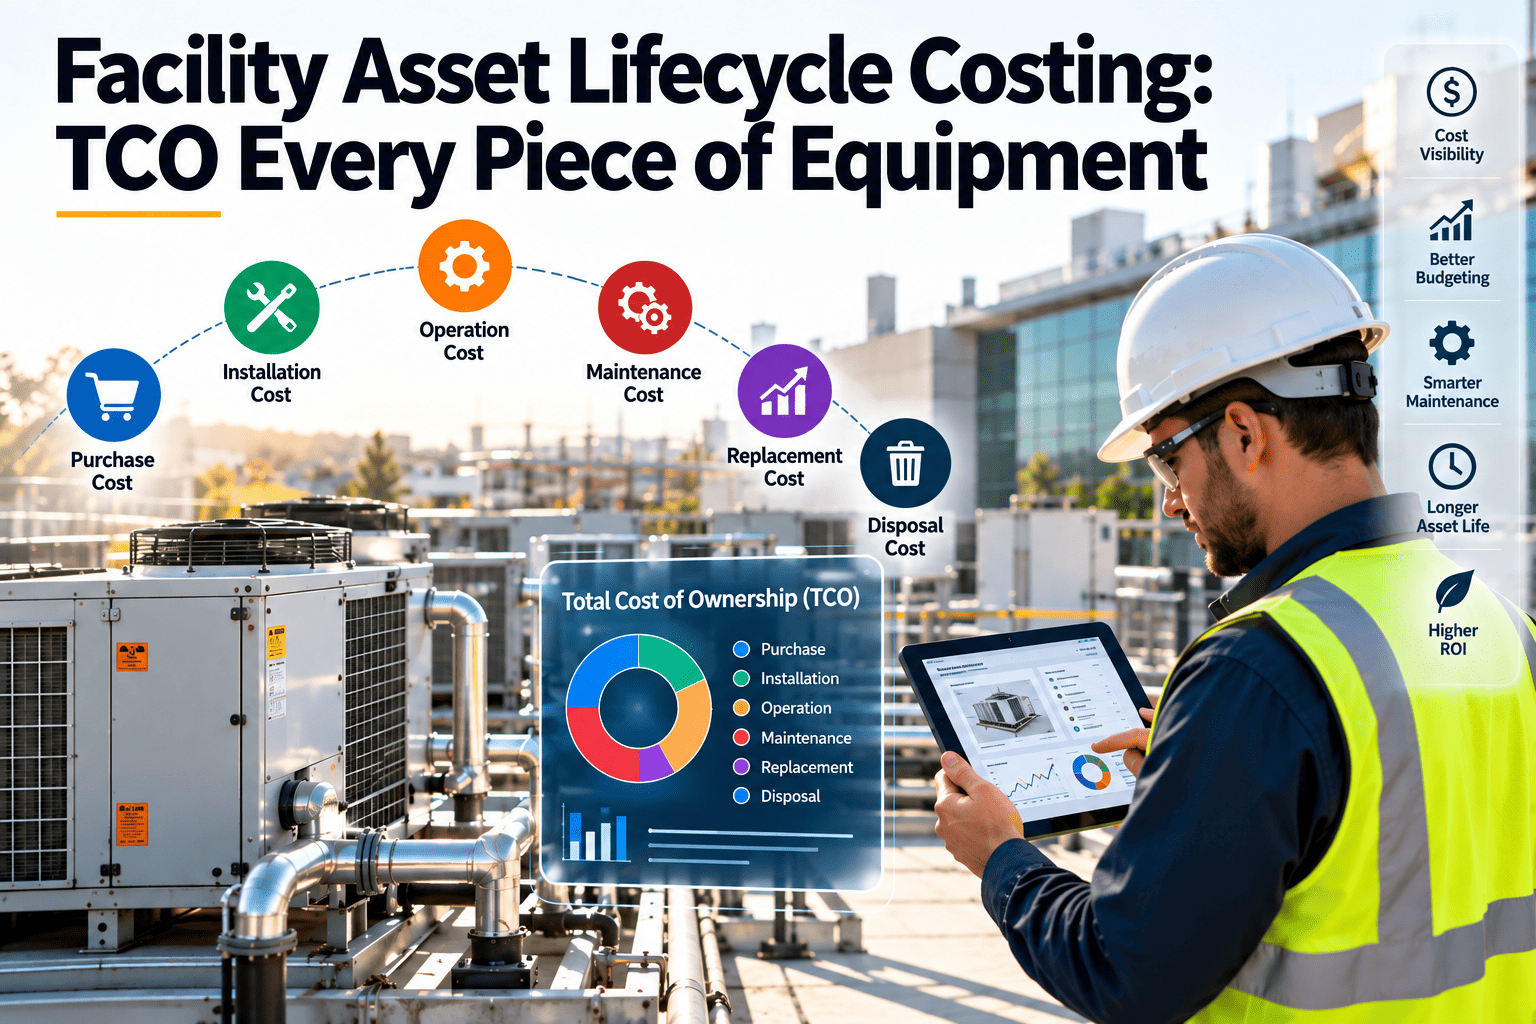
Compare total ownership cost of continuing maintenance against replacement cost amortized over projected asset life. AI calculates the crossover point where repair stops being rational.
2
Asset Condition Scoring
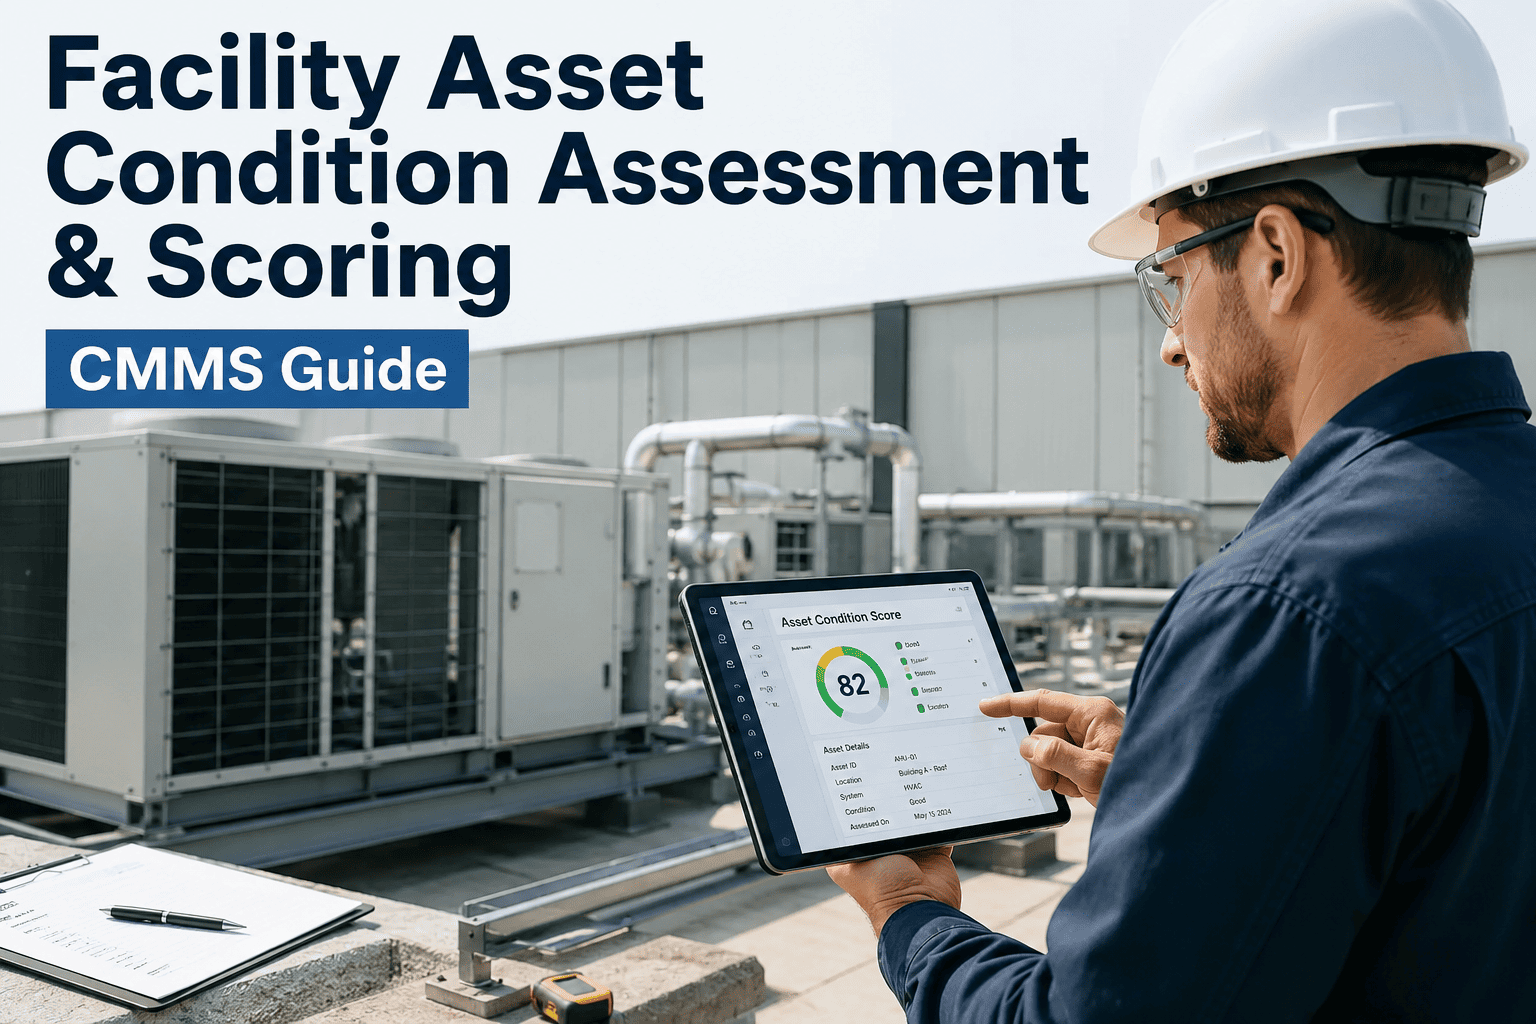
Real-time condition scores derived from IoT sensor data, inspection records, and technician assessments — giving every asset a health grade from 0 to 100.
3
Maintenance History Depth
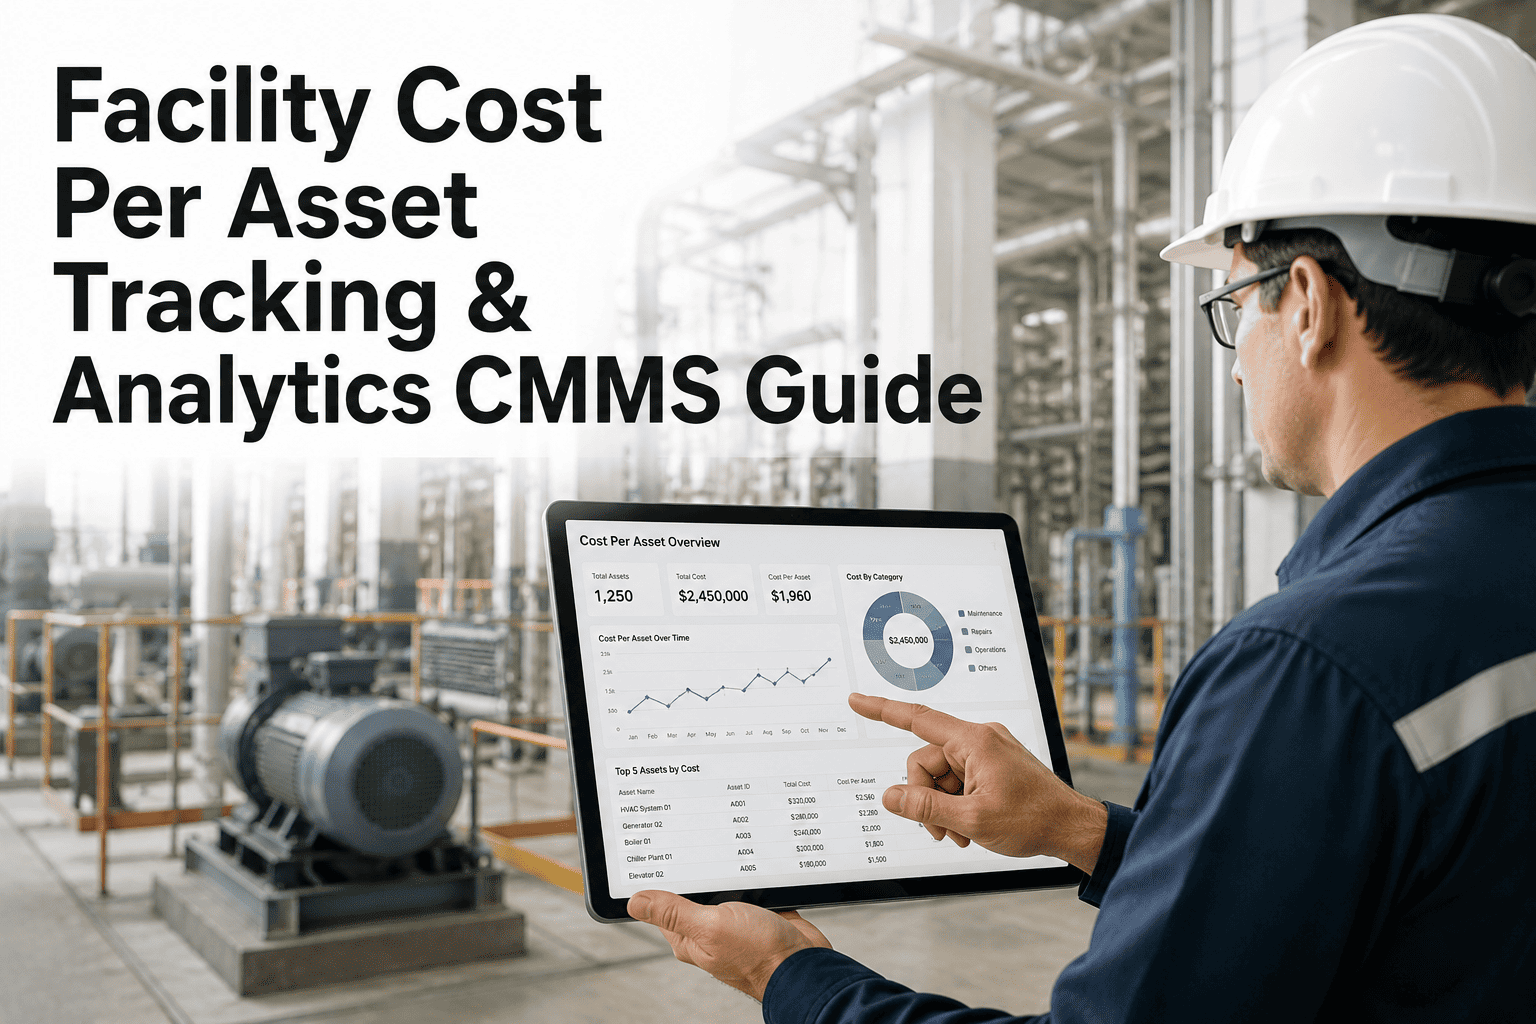
Work order frequency, labor hours, and parts spend over the last 3–5 years reveal assets that are consuming disproportionate maintenance budget relative to their remaining useful life.
4
Risk & Criticality Rating
Not all assets are equal. A failed HVAC unit in a hospital wing carries far greater consequence than the same failure in a storage room. Risk scoring weights consequence into every replacement priority rank.
Your next CapEx presentation deserves better than a gut-feel priority list. Let Oxmaint build your replacement roadmap with real data before your next board cycle.
Asset Replacement Priority Matrix
Oxmaint scores every asset across two dimensions — replacement urgency and consequence of failure — producing a ranked list that makes your CapEx conversation straightforward.
High Risk + High Cost
Replace Now
Immediate CapEx justification — budget first, defer nothing
High Risk + Low Cost
Replace This Quarter
Quick wins — small budget, outsized risk reduction
Low Risk + High Cost
Plan & Finance
Multi-year CapEx plan, lifecycle cost drives timing
Low Risk + Low Cost
Monitor & Maintain
Defer replacement — PM is the right answer for now
← Replacement Cost →
↑ Risk of Failure ↑
Capital Planning Analytics: What Gets Measured Gets Funded
| Decision Input |
Without Analytics |
With Oxmaint AI |
| Replacement Priority |
Leadership opinion, loudest request |
Ranked by lifecycle cost + risk score |
| CapEx Justification |
Narrative, no data backing |
Asset history + cost model export |
| Timing Accuracy |
Too early or too late — both waste money |
AI-predicted optimal replacement window |
| Multi-Site Planning |
Separate spreadsheets, no comparison |
Unified portfolio view across all sites |
| Board Confidence |
Low — decisions feel subjective |
High — data-backed with audit trail |
"
Capital planning decisions made without lifecycle cost modeling and condition scoring routinely result in 20–30% over-investment in assets with remaining useful life and chronic under-investment in failing critical systems. The facilities that solve this first gain a measurable financial advantage — not just operationally, but at the CFO level.
Dr. Patricia L. Nguyen
PhD in Facility Engineering, APPA Leadership in Educational Facilities — 18 years advising enterprise capital planning programs
Frequently Asked Questions
What data does Oxmaint need to build an asset replacement priority list?
Oxmaint needs your asset registry (age, class, location), maintenance history (work orders and costs), and any available condition assessment records. IoT sensor data enriches condition scoring further, but is not required to start. Most facility teams can import their existing asset data via CSV and receive a scored replacement list within the first session.
Start your free trial and test with your own portfolio.
How is "lifecycle cost" calculated for a specific asset?
Oxmaint calculates total cost of ownership by summing historical maintenance spend, projecting future PM and repair costs based on asset condition trends, and comparing that to replacement cost amortized over a new asset's projected life. The model uses your actual vendor rates and labor costs — not industry averages — for accuracy.
Book a demo to see a sample lifecycle model run on a real asset class in your sector.
Can Oxmaint help me prepare a CapEx presentation for leadership?
Yes. Oxmaint generates exportable asset replacement reports that include condition scores, maintenance cost trends, lifecycle analysis, and risk ratings — formatted for executive review. Teams consistently report shorter CapEx approval cycles when presenting data-backed replacement recommendations versus traditional narrative justifications.
Sign up free to access the reporting module immediately after setup.
Does Oxmaint support multi-site capital planning across a facility portfolio?
Oxmaint is built for enterprise multi-site operations. The capital planning dashboard shows asset replacement priorities ranked across all locations, allowing portfolio-level CapEx allocation decisions — not just site-by-site analysis. Directors managing 5 to 50+ locations use the portfolio view to standardize replacement criteria and eliminate local budget bias from prioritization.
Book a session to see the portfolio capital planning dashboard live.
Make Every CapEx Dollar Work Harder
Oxmaint ranks your assets by replacement urgency using lifecycle cost, condition, maintenance history, and risk — so your next capital planning cycle is built on evidence, not estimation.