Some maintenance problems aren't about a single broken asset — they're about a pattern. The third-floor HVAC unit that keeps tripping, the loading dock door that jams every winter, the same restroom plumbing issue reported four times this year from the same wing. These patterns are invisible in a flat list of work orders, but they jump out the moment you see them mapped by location. A building maintenance heat map dashboard visualizes repair frequency by floor, zone, and asset type — turning scattered tickets into a clear picture of where your building actually needs attention.
Blog · KPI & Reporting
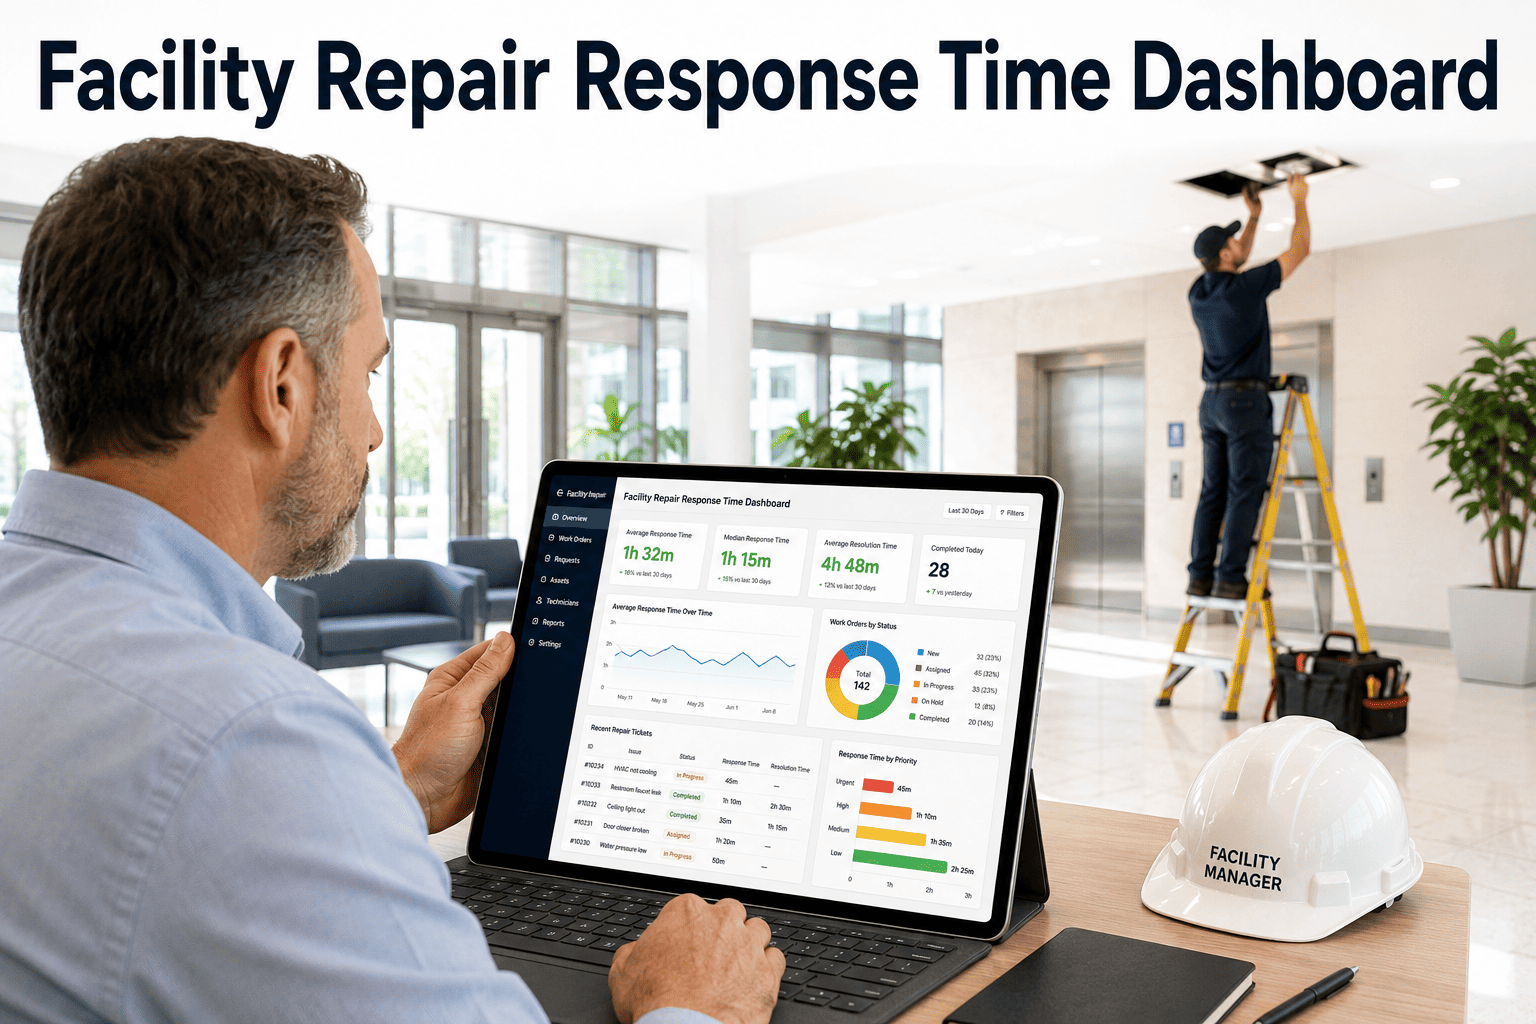
See Where Your Building Breaks Down Most — Visually
Heat-mapped repair frequency by floor, zone, asset type, and issue category reveals hotspots a ticket list never could.
Floor 13
Floor 29
Floor 317
Floor 42
Floor 58
Loading Dock14
Roof
Basement7
Low Activity
Moderate
Hotspot
Why Hotspots Hide in Plain Sight
A work order list shows individual tickets, each looking like a separate problem. But when 17 of those tickets are all coming from Floor 3, that's not 17 separate problems — it's one underlying issue showing up 17 times. Without a spatial view, that connection is easy to miss for months.
1
Repeat Equipment Failure
An aging HVAC unit or pump generates recurring tickets that look unrelated until grouped by location and asset.
2
High-Traffic Wear
Loading docks, main entrances, and high-footfall zones naturally generate more wear-related requests than quiet areas.
3
Environmental Factors
A zone with poor drainage, inconsistent temperature control, or exposure issues will keep generating related complaints.
4
Underlying Infrastructure Issue
Electrical or plumbing infrastructure serving one zone may be due for replacement rather than repeated patching.
Stop Treating Symptoms — See the Pattern
Oxmaint's heat map groups repair history by floor, zone, asset type, and issue category, so you can spot recurring patterns and address root causes instead of closing the same type of ticket over and over.
Repeat Repair Tracking by Zone
| Zone |
Repairs (90 Days) |
Most Common Issue |
Status |
| Floor 3 — East Wing |
17 |
HVAC temperature complaints |
Hotspot — Investigate |
| Loading Dock |
14 |
Dock door mechanism failure |
Hotspot — Investigate |
| Floor 2 — Central |
9 |
Lighting and electrical |
Moderate — Monitor |
| Floor 5 — West Wing |
8 |
Restroom plumbing |
Moderate — Monitor |
| Basement |
7 |
Drainage and water intrusion |
Moderate — Monitor |
| Floor 1 — Lobby |
3 |
Door hardware |
Normal Range |
From Hotspot to Resolution
Step 1
Identify the Hotspot
Heat map flags Floor 3 East Wing as generating disproportionate repair volume over the past quarter.
Step 2
Drill Into History
Filter by asset type reveals all 17 tickets trace back to the same HVAC unit's recurring compressor issue.
Step 3
Plan the Fix
Instead of another temporary repair, schedule a full unit replacement — addressing root cause, not symptoms.
Expert Review
"We'd been patching the same HVAC unit for almost a year, treating each ticket as a one-off. The heat map made it obvious — same zone, same asset, same issue, seventeen times. Once we saw it laid out visually, the case for replacement instead of repeated patching was impossible to ignore, and it paid for itself within two quarters in avoided service calls."
— Senior Facilities Engineer, Corporate Campus
Find Your Building's Hidden Hotspots
Book a 30-minute demo and see your repair history mapped by floor, zone, and asset — uncovering patterns that have been hiding in your ticket history all along.
Frequently Asked Questions
How does a maintenance heat map identify recurring problems?
The heat map groups repair tickets by location, zone, asset type, and issue category, visually highlighting areas with disproportionately high repair frequency.
Oxmaint calculates this automatically from existing work order data.
Can the heat map be filtered by specific asset types or issue categories?
Yes — filters let you isolate patterns by equipment type, such as HVAC or plumbing, or by issue category, helping distinguish between asset-specific problems and zone-wide environmental factors.
How far back does repair history data go for pattern analysis?
Historical data is retained as long as work orders exist in the system, allowing pattern analysis across months or years to distinguish seasonal issues from ongoing structural problems.
Does identifying a hotspot automatically create a follow-up task?
Hotspot zones can be flagged for review and converted directly into investigation or capital planning tasks within the same system.
Book a demo to see this workflow in action.