Picture a facility leader's morning: open repairs across three buildings, overdue preventive maintenance piling up, two assets flagged as high-risk, a compliance audit due next week, and a technician team whose workload nobody can see clearly. Checking all of this used to mean five different reports and a dozen phone calls. A facility maintenance command center dashboard brings every one of those signals — repairs, PMs, risk, compliance, workload, and cost — onto a single screen, so leaders spend their morning making decisions instead of hunting for data.
Blog · Analytics & Reporting
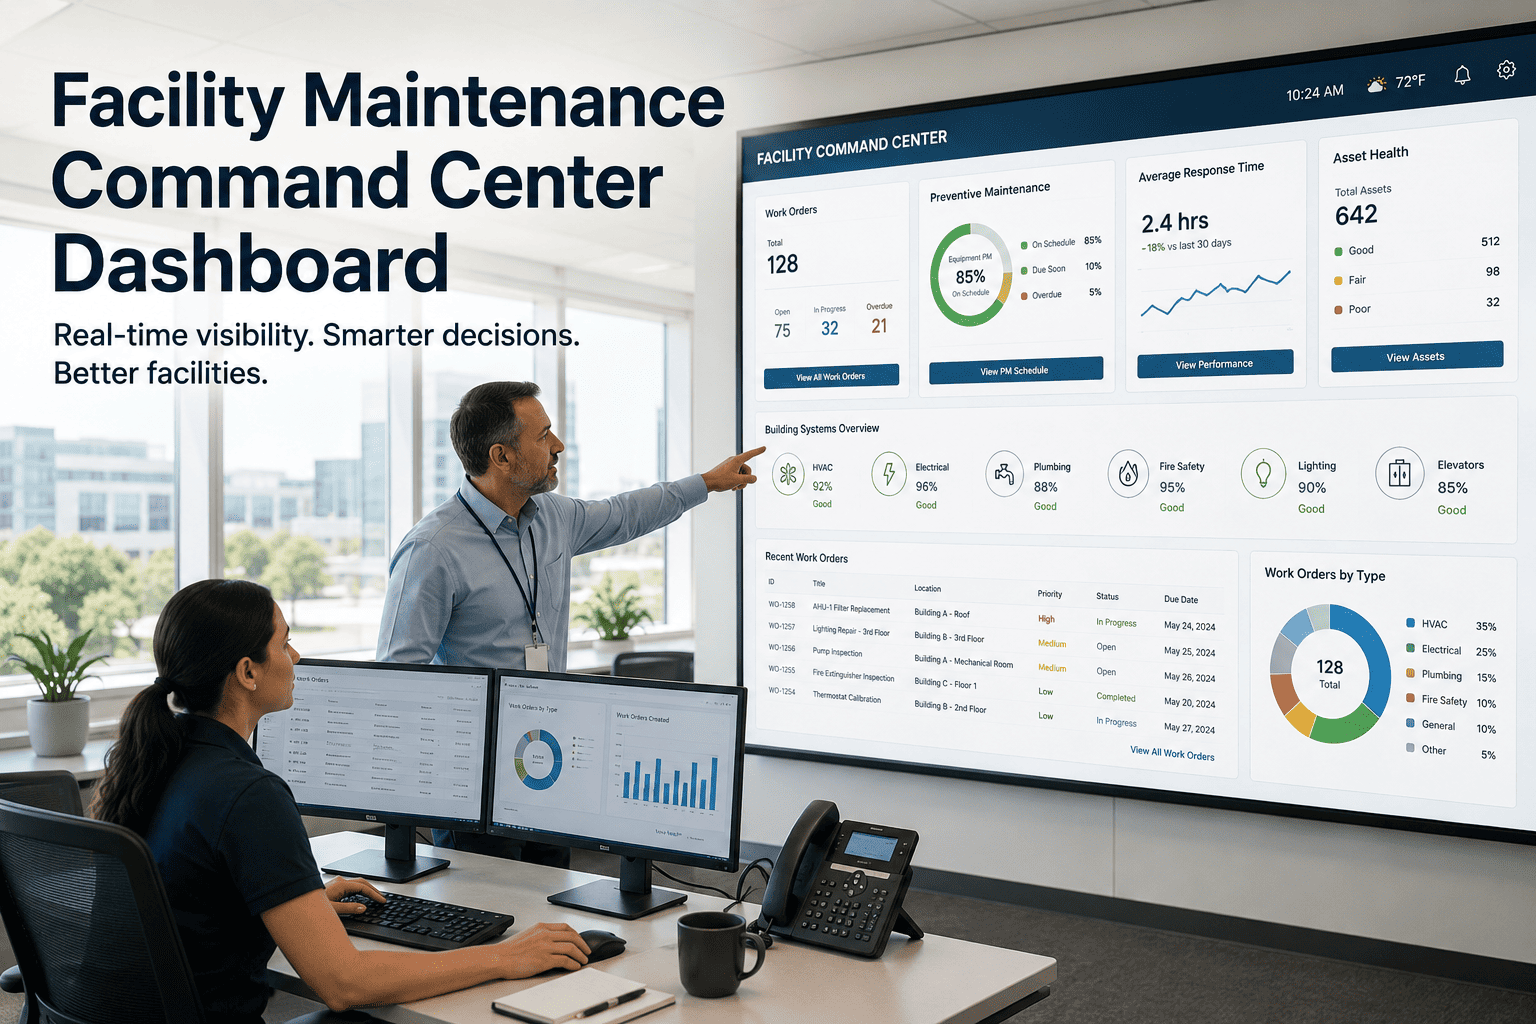
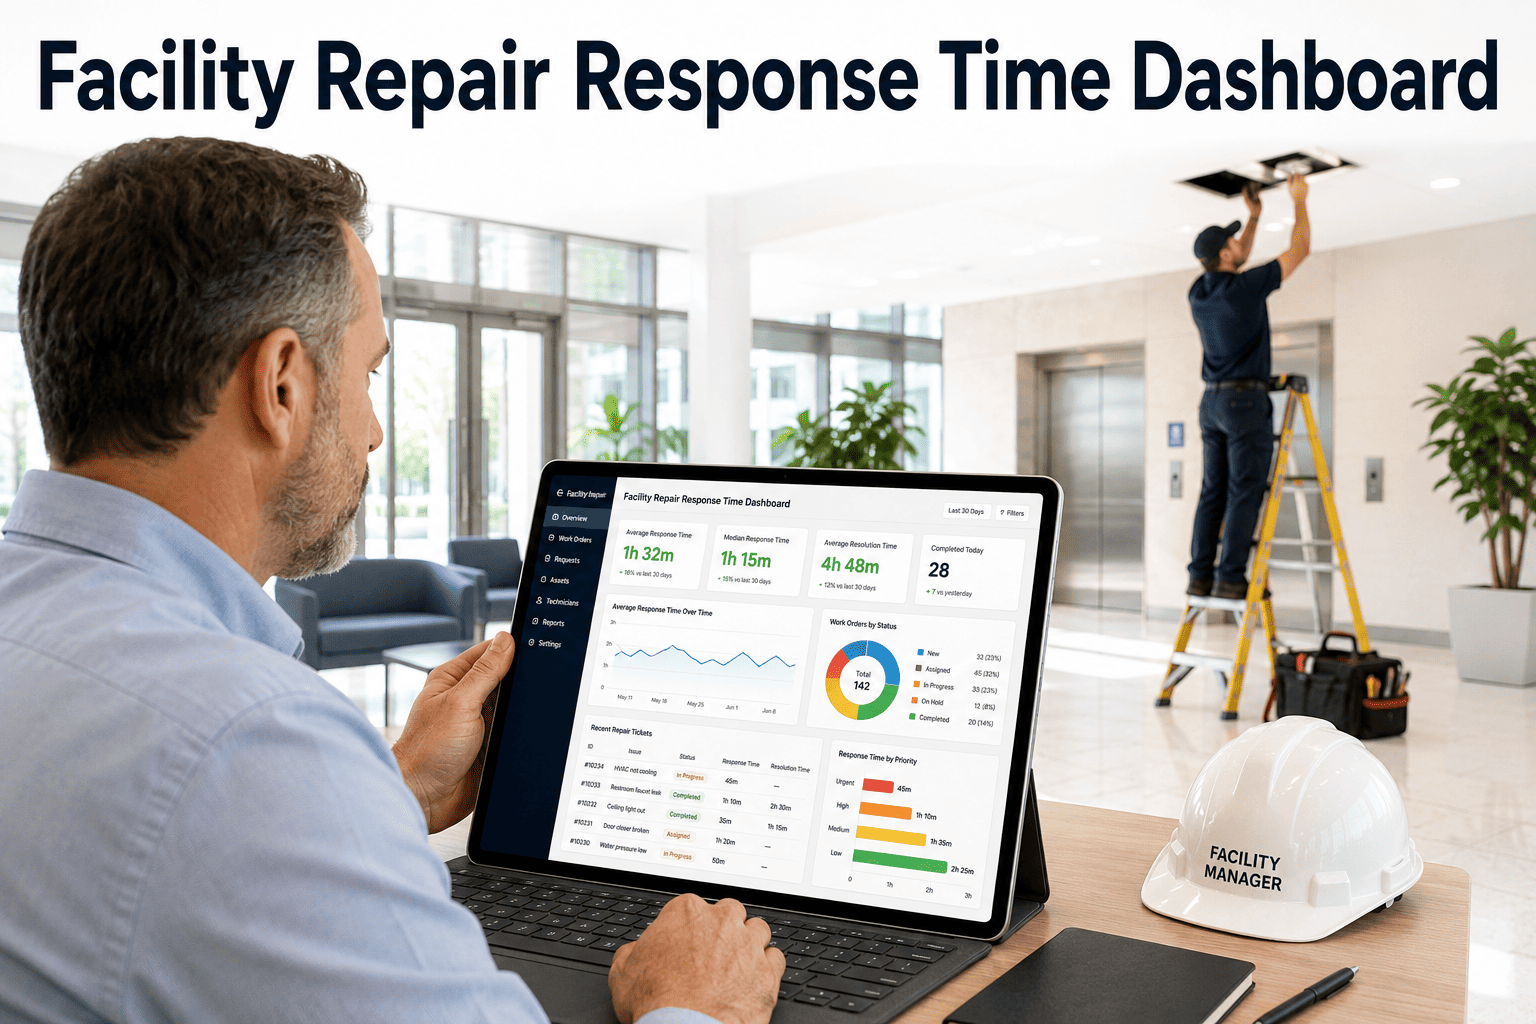
One Screen. Every Signal Your Facility Needs.
Open repairs, overdue PMs, asset risk, compliance status, technician workload, and cost — unified in a single command center view.
The Six Signals Every Facility Leader Needs Daily
Most facility teams already collect this data — it's just scattered across separate tools, spreadsheets, and inboxes. A command center dashboard doesn't create new data; it pulls existing signals into one view so patterns become visible and decisions happen faster.
01
Open Repairs
Live count of active work orders, grouped by priority and aging, so backlog growth is visible immediately.
02
Overdue PMs
Preventive maintenance tasks past their due date, flagged before they turn into reactive emergencies.
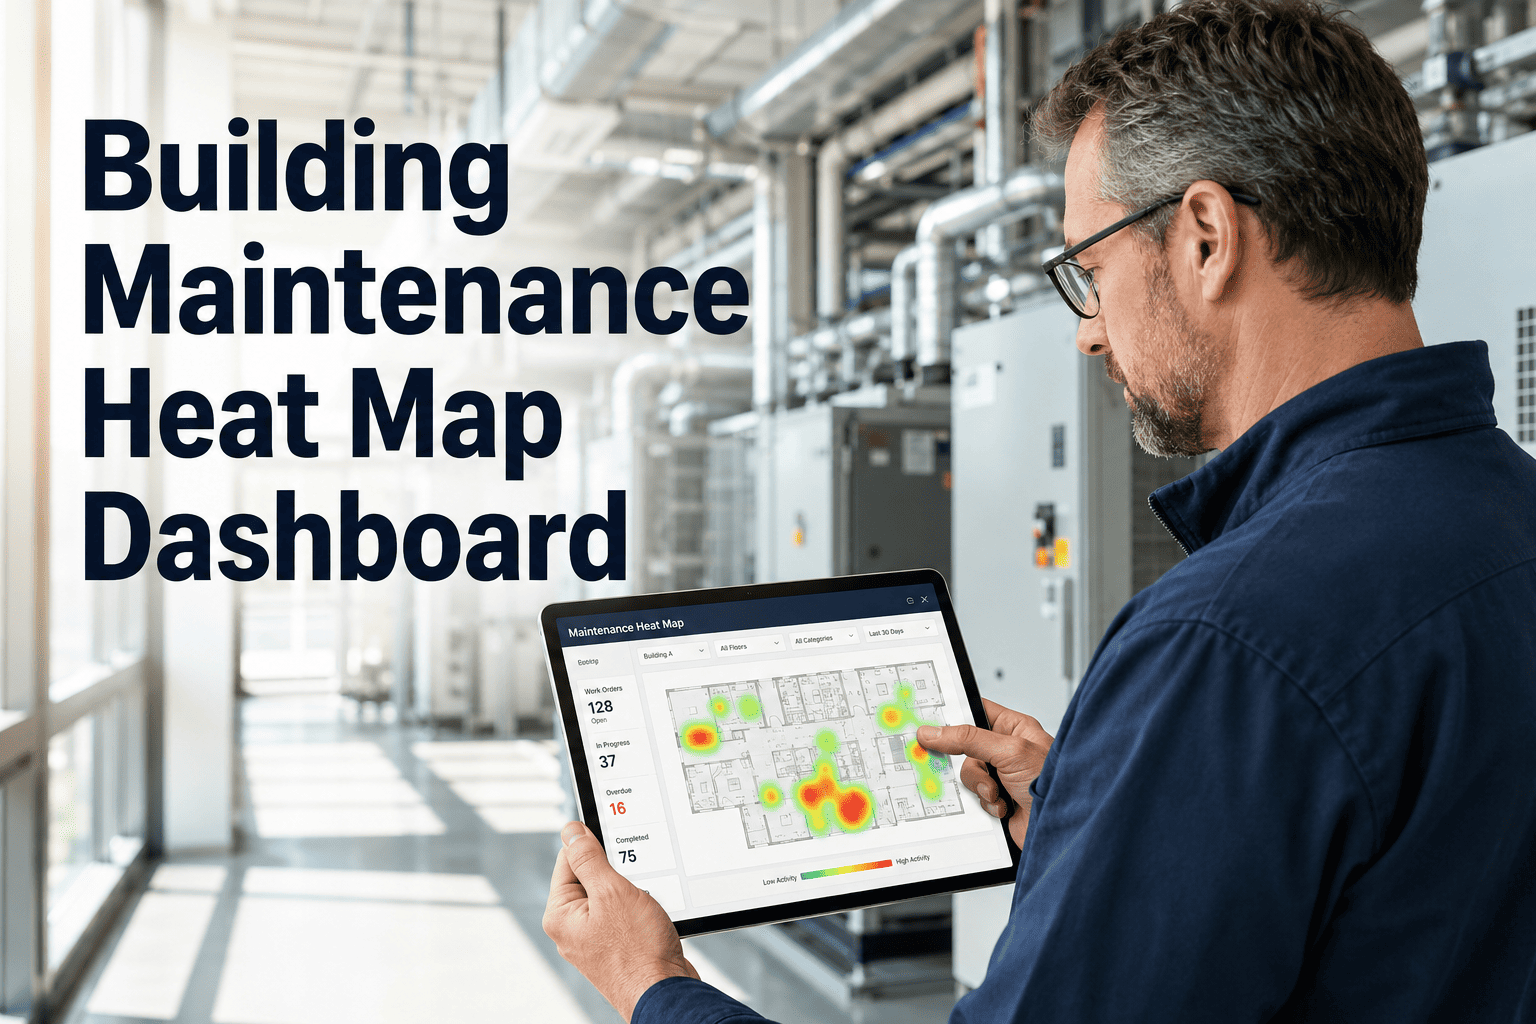
03
Asset Risk
Equipment flagged by repeat failures, age, or missed servicing — ranked by likelihood of breakdown.
04
Compliance Tasks
Inspection and certification deadlines tracked against regulatory calendars, with status at a glance.
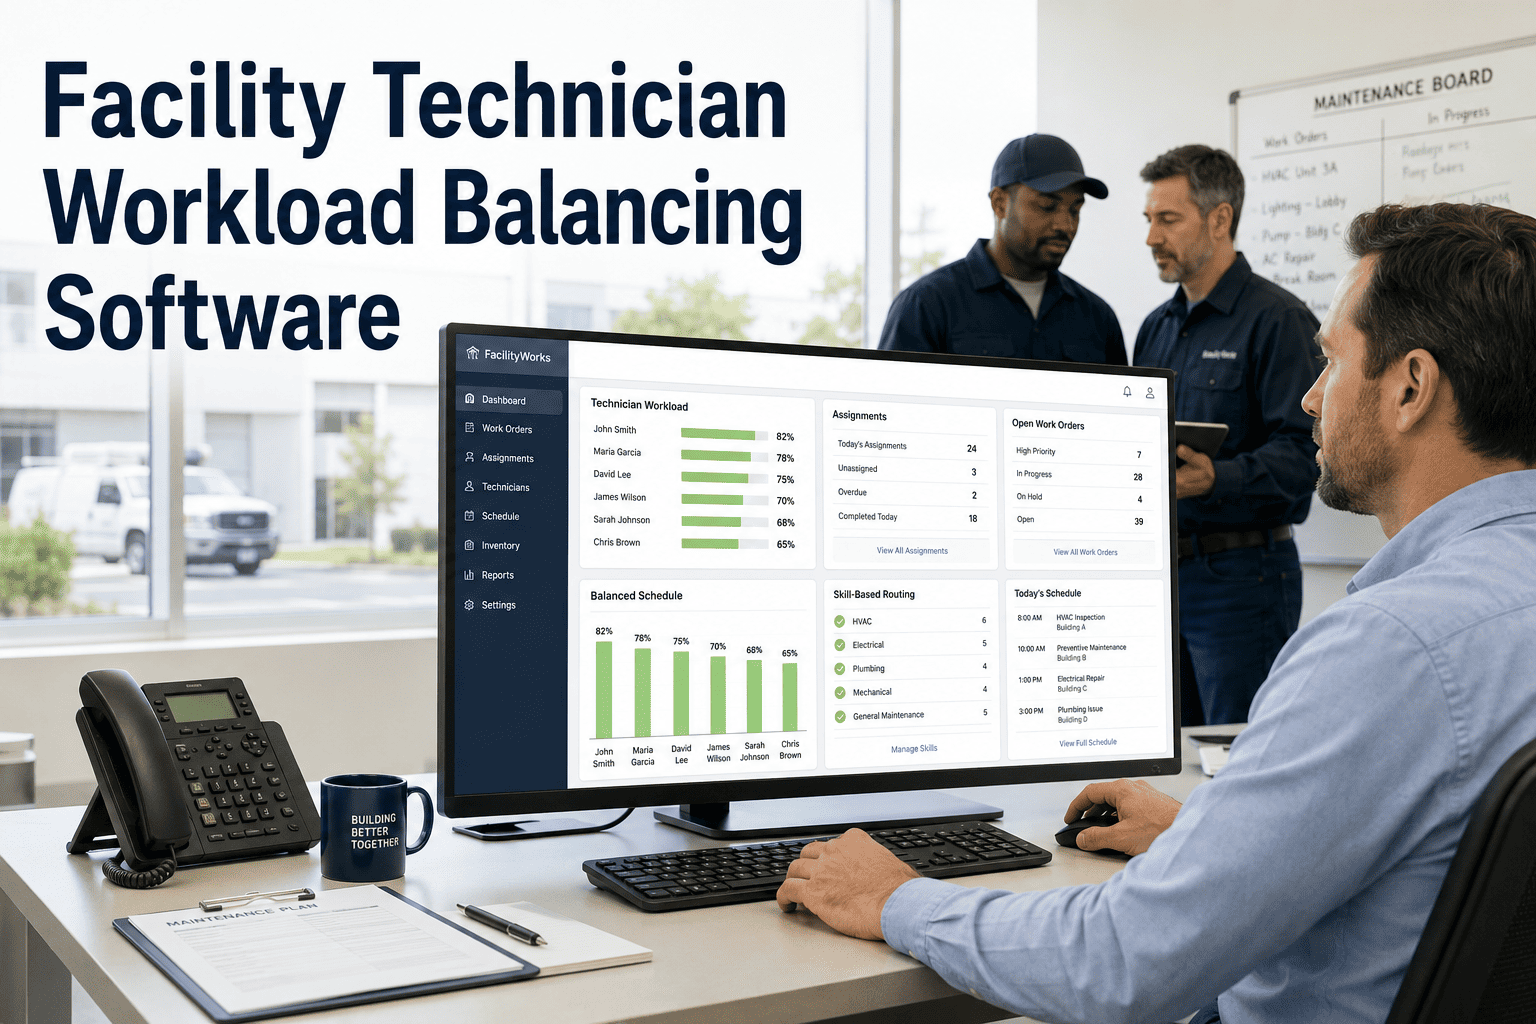
05
Technician Workload
Active assignments per technician, helping leaders spot overload before it causes delays.
06
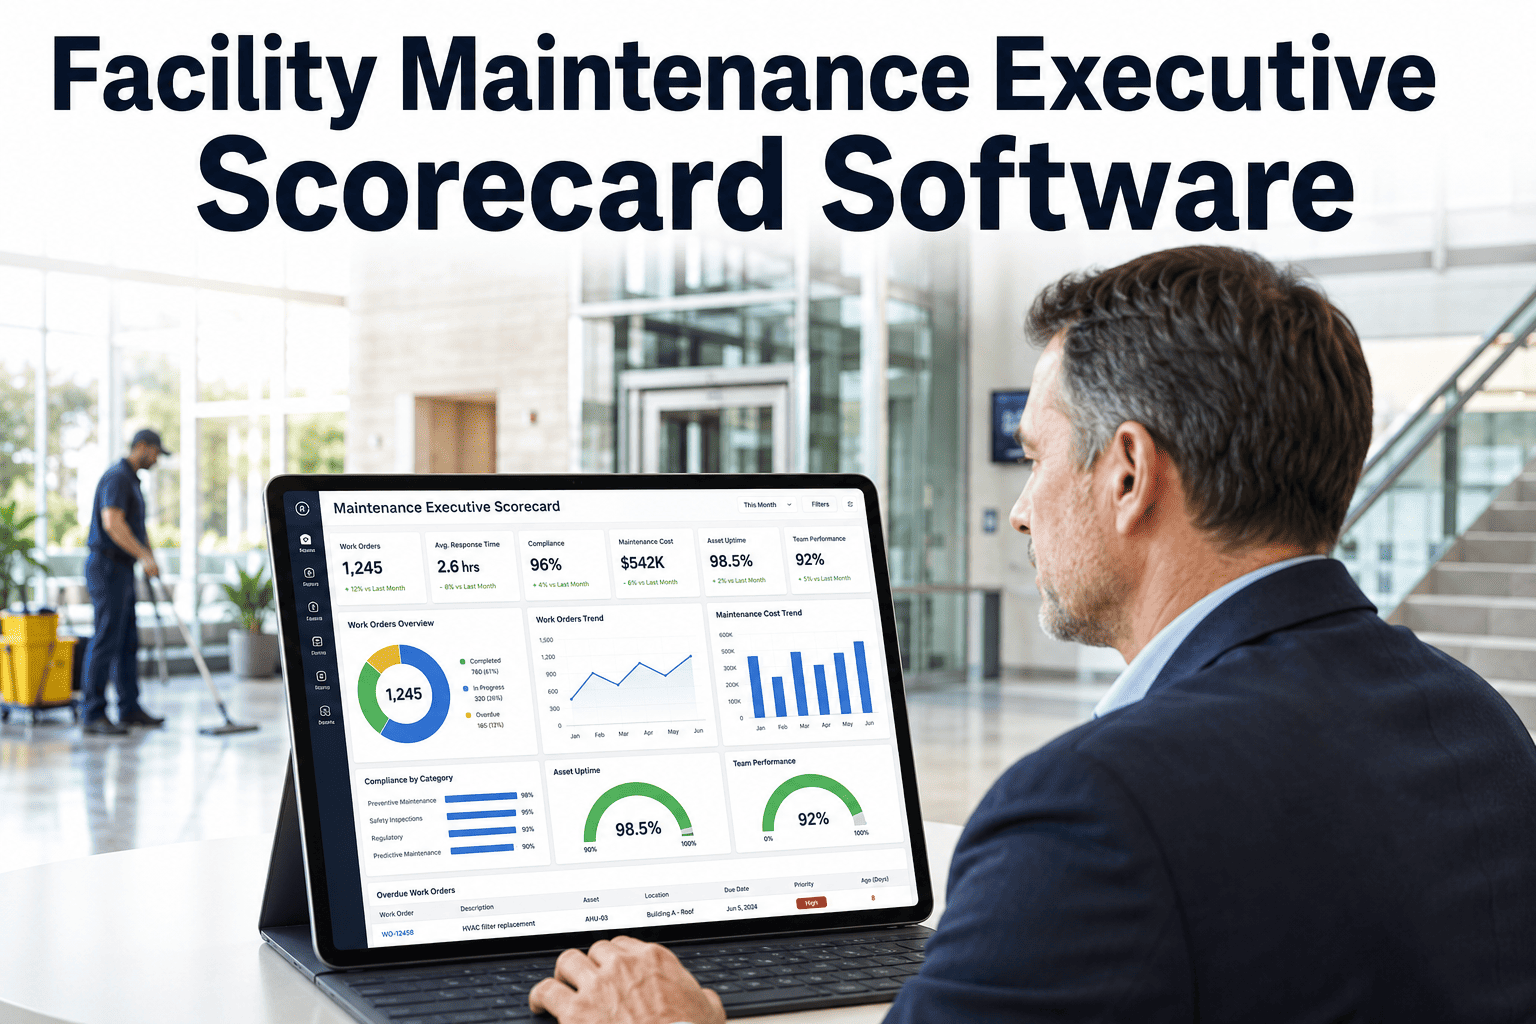
Maintenance Cost
Spend tracked by category and building, compared against budget in real time.
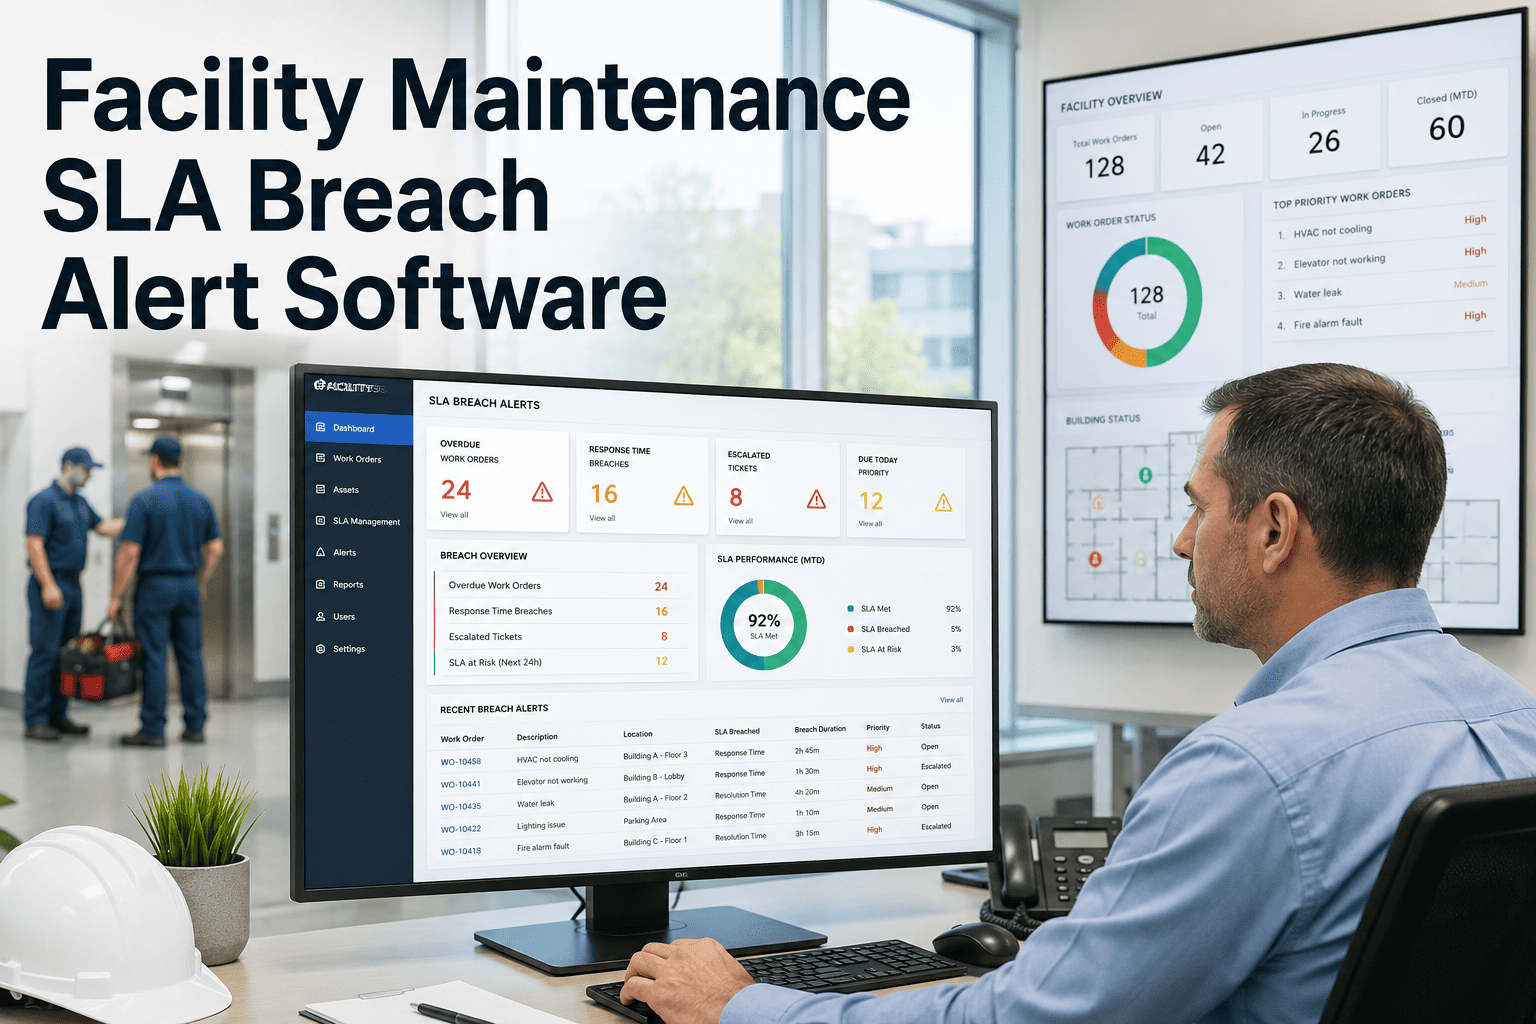
Replace Five Reports With One Live Dashboard
Oxmaint's command center pulls open repairs, overdue PMs, asset risk, compliance, workload, and cost into a single real-time view — built for facility leaders who need answers in seconds, not status meetings.
A Day in the Life: With and Without a Command Center
| Morning Task |
Without Dashboard |
With Command Center |
| Check open repairs |
Log into work order system, filter manually |
Visible on load, sorted by priority |
| Review overdue PMs |
Run a separate PM compliance report |
Flagged automatically in real time |
| Spot at-risk assets |
Cross-reference repair history manually |
Risk-ranked list updates continuously |
| Check compliance status |
Email compliance officer for update |
Live status against regulatory calendar |
| Review team workload |
Ask supervisors individually |
Assignment counts per technician, live |
| Track maintenance spend |
Wait for monthly finance report |
Real-time cost vs. budget tracking |
Why Visibility Changes Behavior, Not Just Reporting
58%
faster response to emerging asset risk when leaders see it daily, not monthly
31%
reduction in PM backlog within the first quarter of dashboard visibility
5hrs
saved weekly per manager on manual status reporting and report compilation
Expert Review
"Before, our managers spent the first hour of every Monday compiling status from five different sources just to know where things stood. Now that view exists the moment they open their laptop. The real shift wasn't the dashboard itself — it was that problems got addressed on the day they appeared instead of the week someone finally noticed them in a report."
— Director of Facilities, Multi-Site Commercial Portfolio
See Your Facility's Full Picture in One Demo
Walk through a live command center view configured around your buildings, assets, and team — and see exactly what your team will see every morning.
Frequently Asked Questions
What data sources feed into a facility maintenance command center dashboard?
The dashboard pulls directly from your existing work orders, preventive maintenance schedules, asset records, compliance calendars, and cost logs within
Oxmaint — no separate data entry or manual report compilation required.
Can the dashboard be customized for different roles, like regional managers vs. executives?
Yes — views can be filtered by building, region, or asset category, so a site manager sees their building's detail while an executive sees portfolio-wide summaries on the same underlying data.
How is asset risk calculated on the dashboard?
Risk ranking factors in repair frequency, asset age, missed servicing intervals, and downtime history, surfacing the equipment most likely to fail next so attention goes where it matters most.
How long does it take to set up a command center dashboard for our facilities?
Most teams have a working dashboard within their first week, using data already present in the system.
Book a demo to see a sample configuration for your portfolio.