Ask any facility manager how long repairs actually take from request to resolution, and most will give you an estimate — not a number. That gap between "roughly a day" and "actually 18 hours, but 6 of those were spent waiting for a technician to even see the ticket" is exactly where service quality quietly erodes. A facility repair response time dashboard breaks the repair lifecycle into measurable stages — response time, first-touch time, completion time — so teams can see precisely where delays happen and fix the actual bottleneck instead of guessing.
Blog · KPI & Reporting
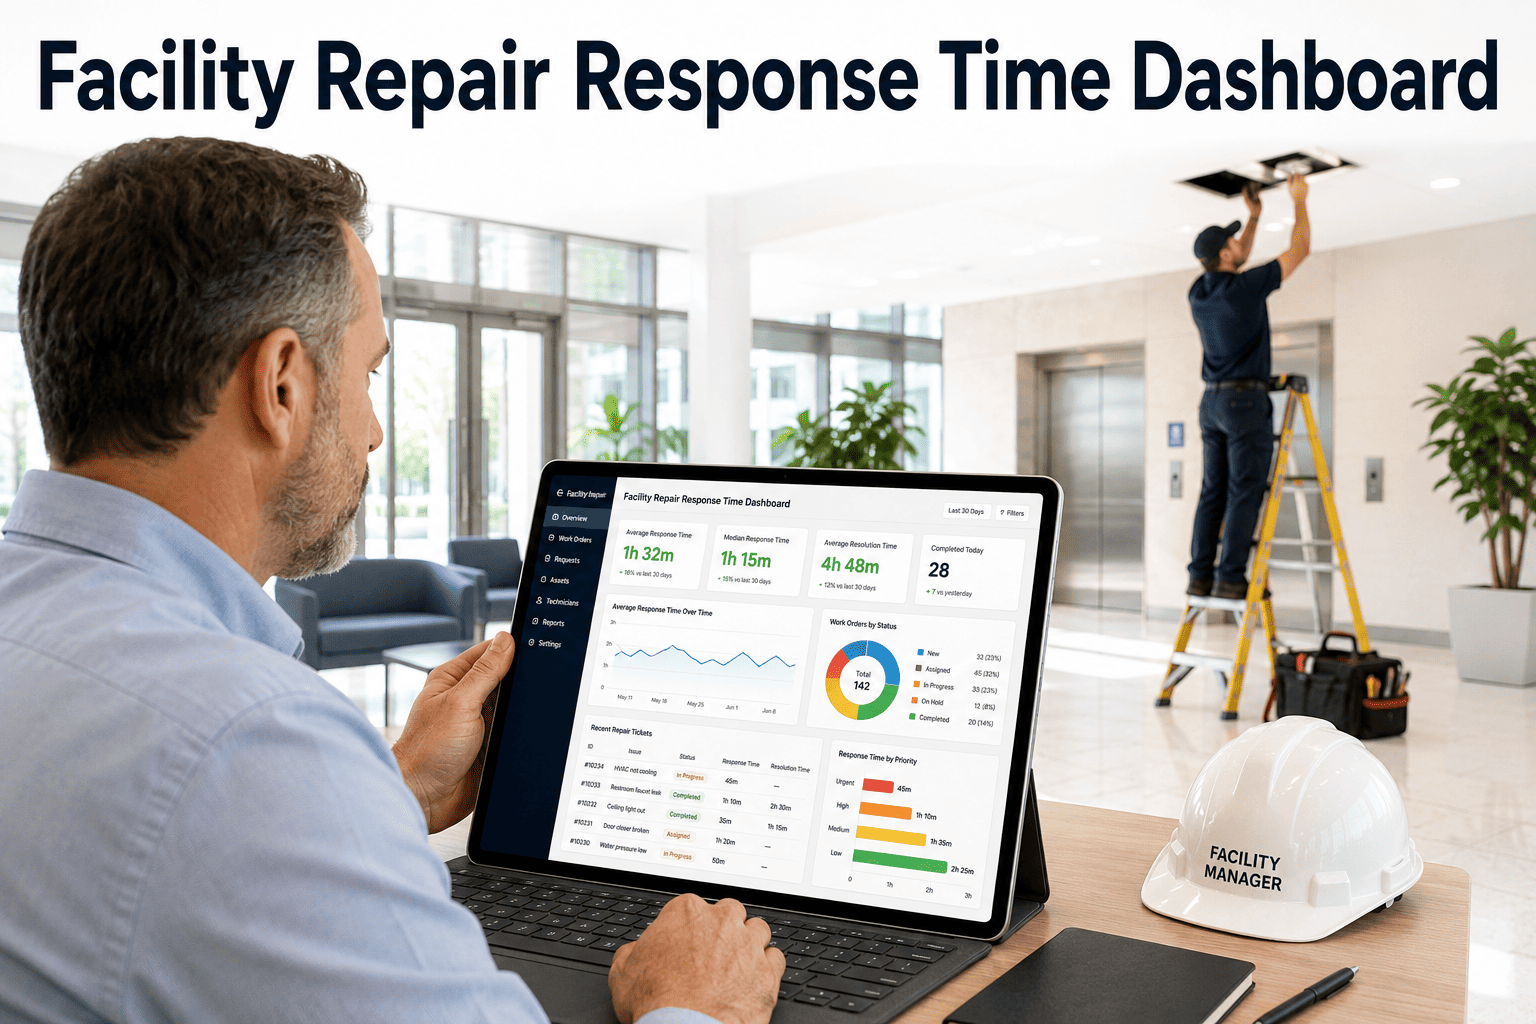
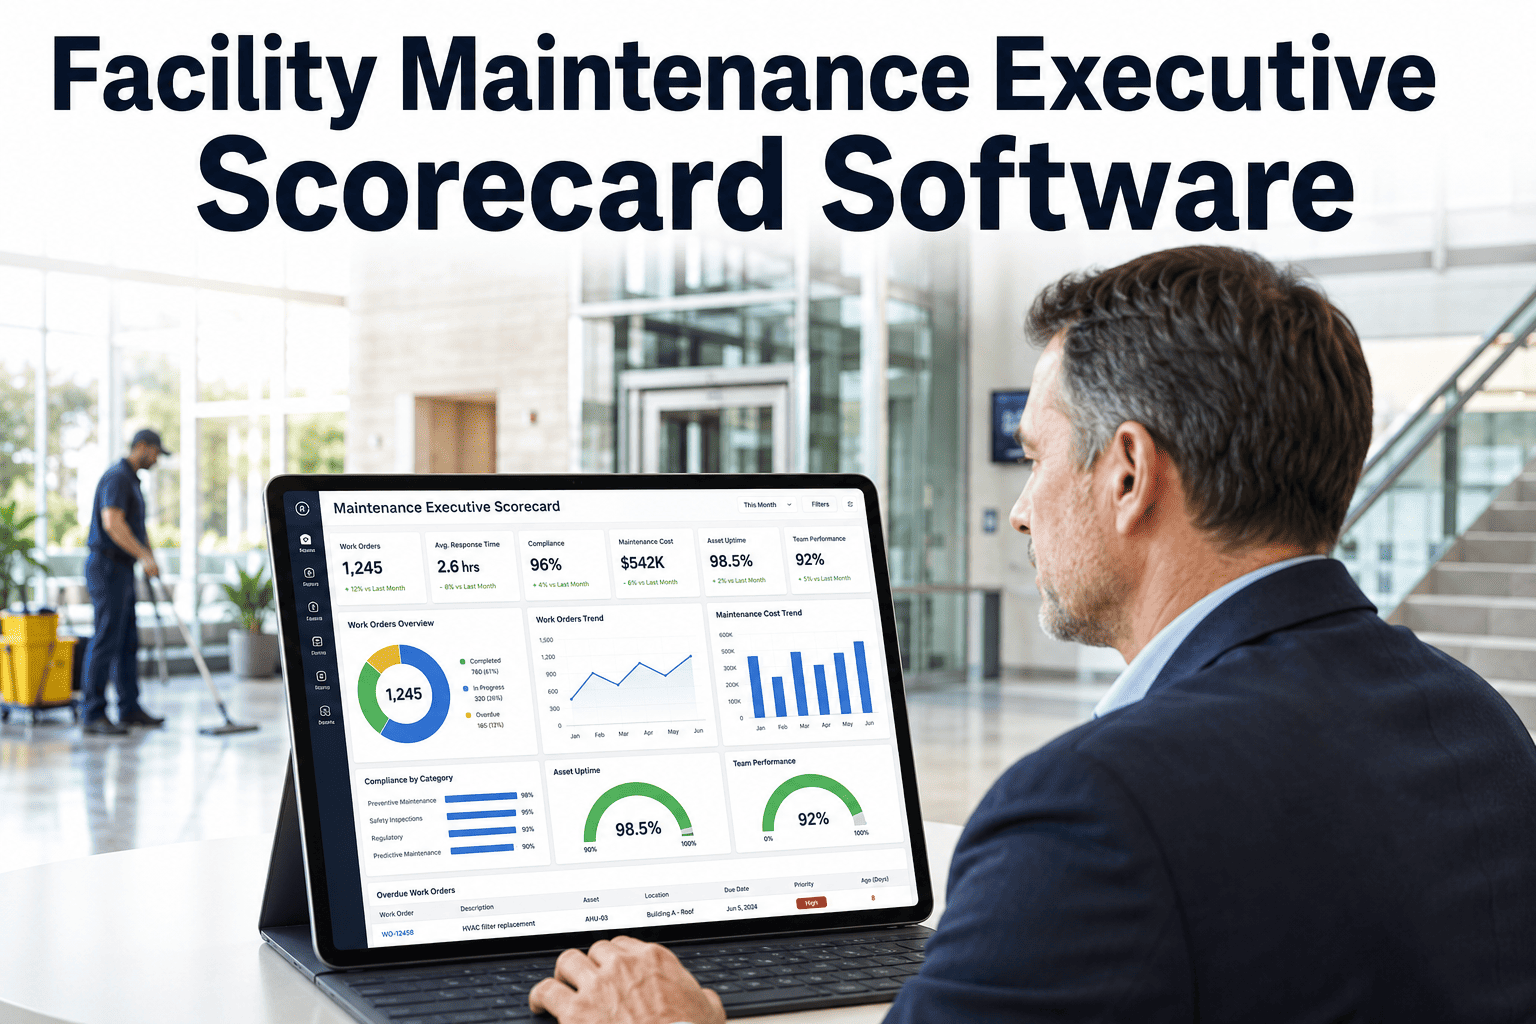
Measure Every Stage of a Repair, Not Just the End Result
Response time, first-touch time, completion time, and SLA performance — tracked for every repair request across your buildings
The Four Timestamps That Tell the Real Story
A single "resolution time" number hides where the delay actually happened. Breaking a repair into four timestamps shows whether the bottleneck is in dispatch, technician response, parts availability, or workmanship — and each of those has a completely different fix.
T0
Request Submitted
Ticket enters the system with timestamp and priority level
T1
First Response
Time until a technician acknowledges or is assigned
T2
First Touch
Time until a technician physically begins work on-site
T3
Completion
Time until the repair is marked complete and verified
Sample Response Time Breakdown by Building
| Building |
Avg. Response Time |
Avg. First-Touch |
Avg. Completion |
SLA Met |
| Tower A — North Campus |
22 minutes |
1.4 hours |
4.2 hours |
94% |
| Tower B — South Campus |
51 minutes |
3.1 hours |
7.8 hours |
76% |
| Annex — East Wing |
18 minutes |
1.1 hours |
3.6 hours |
97% |
| Parking Structure |
1.2 hours |
4.5 hours |
9.4 hours |
63% |
A side-by-side view like this immediately shows that Tower B and the Parking Structure share a pattern — slow first-touch times — pointing to a dispatch or staffing issue specific to those locations, not a general performance problem.
Find Your Bottleneck Stage in Minutes, Not Months
Oxmaint tracks response, first-touch, and completion times automatically for every work order — so you can pinpoint exactly which stage is slowing your team down and fix it with data, not guesswork.
What Each Bottleneck Pattern Usually Means
Slow Response Time
Tickets sit before anyone is assigned — usually a triage or staffing coverage gap, not a technician performance issue.
Slow First-Touch
Assigned but delayed arrival — often travel distance, conflicting priorities, or unclear scheduling for the assigned technician.
Slow Completion
Work starts promptly but drags on — frequently a parts availability issue or a job that was under-scoped at intake.
All Stages Slow
Consistent delays across every stage usually point to overall technician-to-workload ratio being too low for that location.
Technician Productivity Snapshot
4.6
average tickets closed per technician per day
86%
of repairs completed within first-touch on the same visit
2.3hrs
average gap between response and first-touch portfolio-wide
Expert Review
"We assumed our slow buildings had slow technicians. The data showed the opposite — the same technicians performed well once they were on-site, but dispatch delays in those buildings were nearly three times longer than our best-performing site. We fixed a scheduling rule, not a person, and SLA compliance in that building jumped almost twenty points within a month."
— Regional Facilities Manager, Commercial Real Estate Group
See Your Response Time Breakdown, Building by Building
Book a 30-minute demo and we'll show you how response, first-touch, and completion times look across your portfolio — and where your biggest opportunity for improvement is hiding.
Frequently Asked Questions
What's the difference between response time and first-touch time?
Response time measures how quickly a ticket is acknowledged or assigned, while first-touch time measures how long until a technician actually arrives and begins work.
Oxmaint tracks both separately because they point to different problems.
Can response time data be broken down by building or technician?
Yes — the dashboard filters by building, floor, technician, and priority level, making it easy to compare performance across locations or teams and identify localized bottlenecks.
How does tracking these metrics actually improve SLA compliance?
By showing exactly which stage of the repair process is slow, teams can target the real cause — staffing, scheduling, or parts — rather than applying broad fixes that don't address the actual delay.
Is historical response time data available for trend analysis?
Yes — historical data is retained so teams can track whether changes to staffing or workflows are actually improving response times over time.
Book a demo to see sample trend reports.