A cleaning programme without a scoring system is a cleaning programme without accountability. Facility managers who assess cleaning quality through visual impressions or reactive complaints cannot hold contractors to a measurable standard, cannot identify which zones consistently underperform, and cannot demonstrate hygiene compliance to auditors who arrive unannounced. A structured audit scoring system changes this by converting subjective assessments into quantified performance data — enabling contractor benchmarking, trend analysis, and evidence-based service level decisions. Book a demo to see how OxMaint's Analytics & Reporting feature schedules audit rounds, captures weighted scores by zone, and builds cleaning performance trends across your facility portfolio.
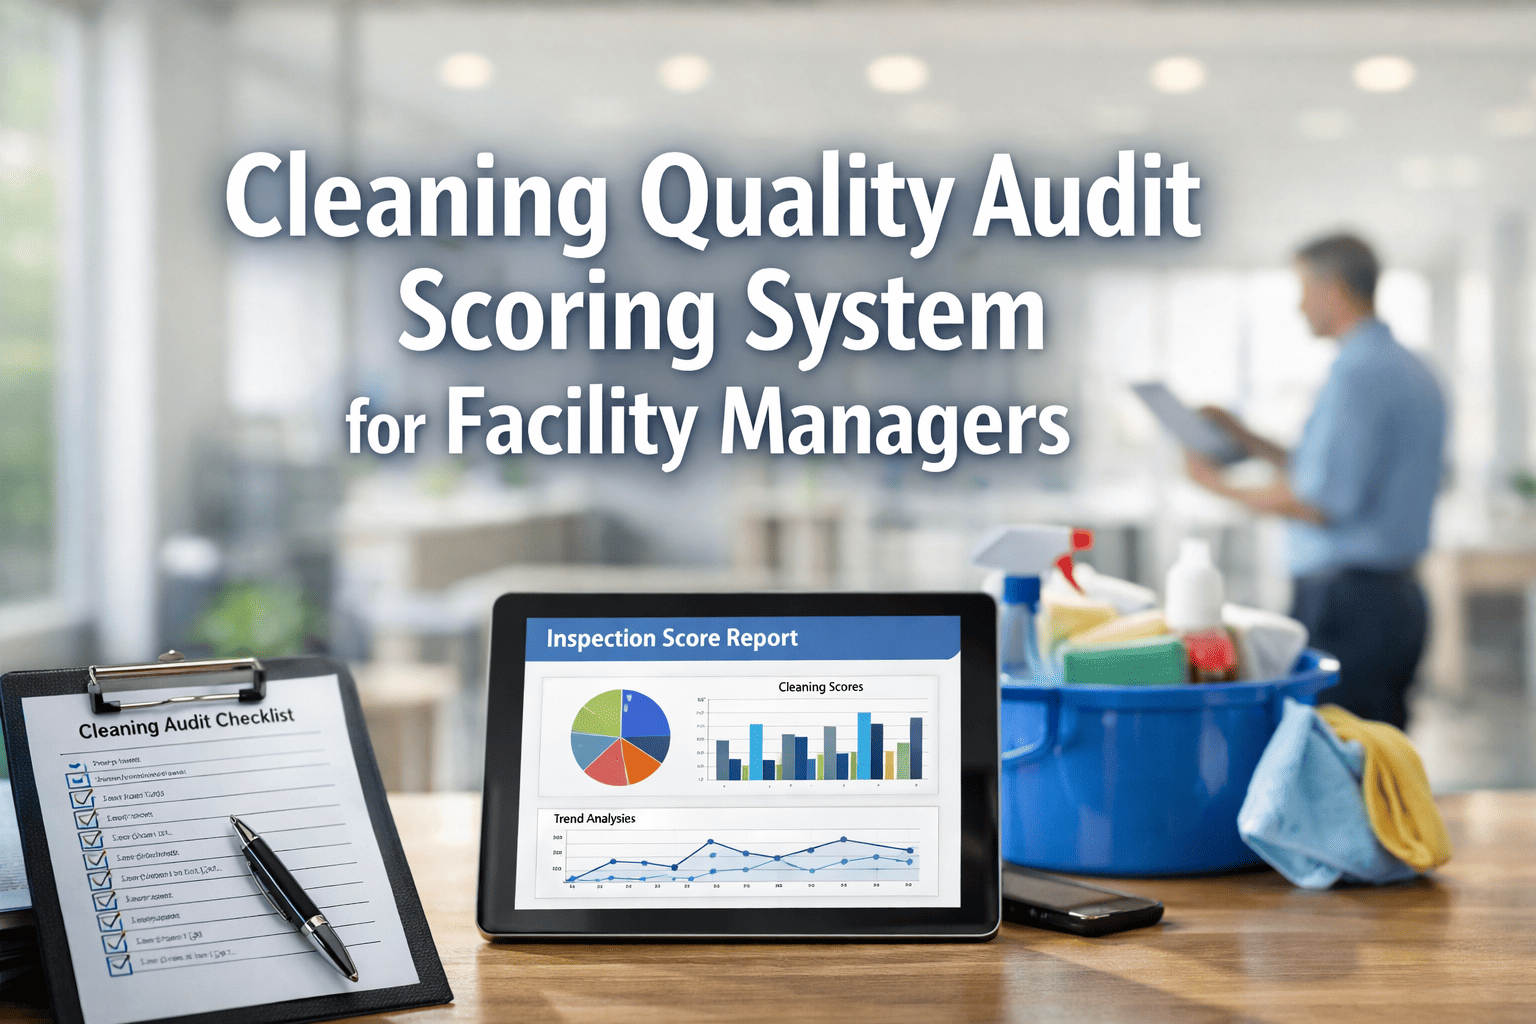
Cleaning Quality Audit Scoring System for Facility Managers
Weighted scoring framework, zone classification, area-specific audit items, contractor KPIs, and performance benchmarks — a complete system for measurable cleaning quality management in commercial, healthcare, education, and mixed-use facilities.
Building a Weighted Scoring System That Reflects Actual Hygiene Risk
Not all cleaning deficiencies carry equal risk. A missed bin liner in a storage room and a contaminated restroom surface represent fundamentally different hygiene exposures — treating them as equal in a scoring system produces data that does not reflect actual facility risk. A weighted scoring model assigns higher point values to items where cleaning failure creates health risk, regulatory exposure, or occupant complaint volume.
Scoring formula: Final zone score = (Points earned ÷ Maximum possible points) × 100%. This enables direct comparison across zones, shifts, time periods, and contractors on a common percentage scale.
Zone Classification: Matching Audit Intensity to Hygiene Risk
An effective cleaning audit programme does not inspect all areas at the same frequency or against the same criteria. Zone classification aligns inspection intensity with hygiene risk, occupant sensitivity, and compliance obligation.
| Zone Class | Typical Spaces | Min. Audit Frequency | Passing Threshold | Weight Profile |
|---|---|---|---|---|
| Class A — Critical | Healthcare clinical, food prep, childcare, labs | Daily or per-shift | 90%+ | 70% Tier 1 — disinfection dominates |
| Class B — High Traffic | Restrooms, break rooms, lobby, lifts | Weekly (daily visual check) | 85%+ | 50% T1 · 40% T2 · 10% T3 |
| Class C — Standard | Open offices, meeting rooms, corridors | Weekly to fortnightly | 75%+ | 30% T1 · 50% T2 · 20% T3 |
| Class D — Low Use | Storage, plant rooms, car parks, external | Monthly | 65%+ | 20% T1 · 40% T2 · 40% T3 |
Audit Items by Facility Area
Each item below should be scored as 0 (fail — deficiency present), partial (minor issue, half value), or full value (passes standard). Tier designation drives the weighting contribution to the zone score.
Schedule zone audits automatically, capture weighted scores on mobile, and build trend charts that make contractor performance conversations objective.
KPIs & Performance Benchmarks
A scoring system without KPIs is data collection without direction. These metrics convert audit score data into the performance indicators that support contractor management, budget decisions, and continuous improvement.
| KPI | How to Calculate | Target | OxMaint Reporting |
|---|---|---|---|
| Portfolio Average Score | Mean of all zone scores in the audit period | ≥85% across all zones | Dashboard with period comparison and trend line |
| Zone Fail Rate | Zones below threshold ÷ total zones audited | <5% of zones below passing threshold | Zone heat map showing pass/fail by area |
| Tier 1 Pass Rate | Tier 1 items passed ÷ total Tier 1 items inspected | ≥95% — sanitation-critical items are non-negotiable | Tier-split view separating critical from cosmetic scores |
| Repeat Deficiency Rate | Deficiencies in 2+ consecutive audits ÷ total deficiencies | <10% — repeat items indicate systemic failure | Recurring deficiency flag per item and zone |
| Audit Completion Rate | Audits completed on schedule ÷ total scheduled audits | 100% — incomplete programmes invalidate trend data | Auto-scheduled audits with overdue escalation alerts |
| 3-Month Score Trend | Current period average vs 3-month rolling average | Stable or improving — any downward trend triggers review | Rolling trend chart per zone and contractor |
Using Audit Scores for Contractor Performance Management
A scoring system is only as useful as the conversations it enables. The audit scorecard should be shared with cleaning contractors on a defined schedule, with a structured response framework tied to score bands. Contractors who receive monthly score reports with zone breakdowns and item-level detail can actually improve — a single pass/fail verdict gives no actionable information.
What Facility Cleaning Quality Professionals Say
The facility managers who get the most from cleaning audit systems are the ones who use scores to have structured conversations with contractors, not just to calculate penalty deductions. Score granularity — zone breakdowns and item-level detail — is what makes the difference between a compliance exercise and a quality improvement programme.
Certified Facility Manager (CFM), BIFM Member — 18 Years FM Operations & Contractor ManagementTier 1 pass rate is the number that matters most — not the overall score. A building can achieve 82% overall while sanitation-critical items are passing only 74%. A system that reports aggregate scores alone masks this distinction entirely. Always split your scorecard by tier before reporting to management or contracting teams.
Senior Hygiene & Facilities Consultant, Healthcare and Education Sector — 22 Years Cleaning Quality ManagementThe repeat deficiency rate transformed how we managed our cleaning contract. We were scoring 84% average and thought performance was acceptable — until trend analysis in OxMaint showed the same six items had failed in every weekly audit for four months. The contractor was addressing them reactively each time without touching the root cause: understaffing on the Friday evening shift.
Operations Director, Multi-Site Commercial Property Group — 14 Locations, 1.1M sq ft Under ManagementFrequently Asked Questions
A Cleaning Score Without a Trend Is a Number Without Meaning.
OxMaint's Analytics & Reporting platform schedules zone-based audits, captures weighted scores on mobile, flags repeat deficiencies, and builds the trend charts that make contractor performance conversations objective — and your cleaning programme continuously improvable.