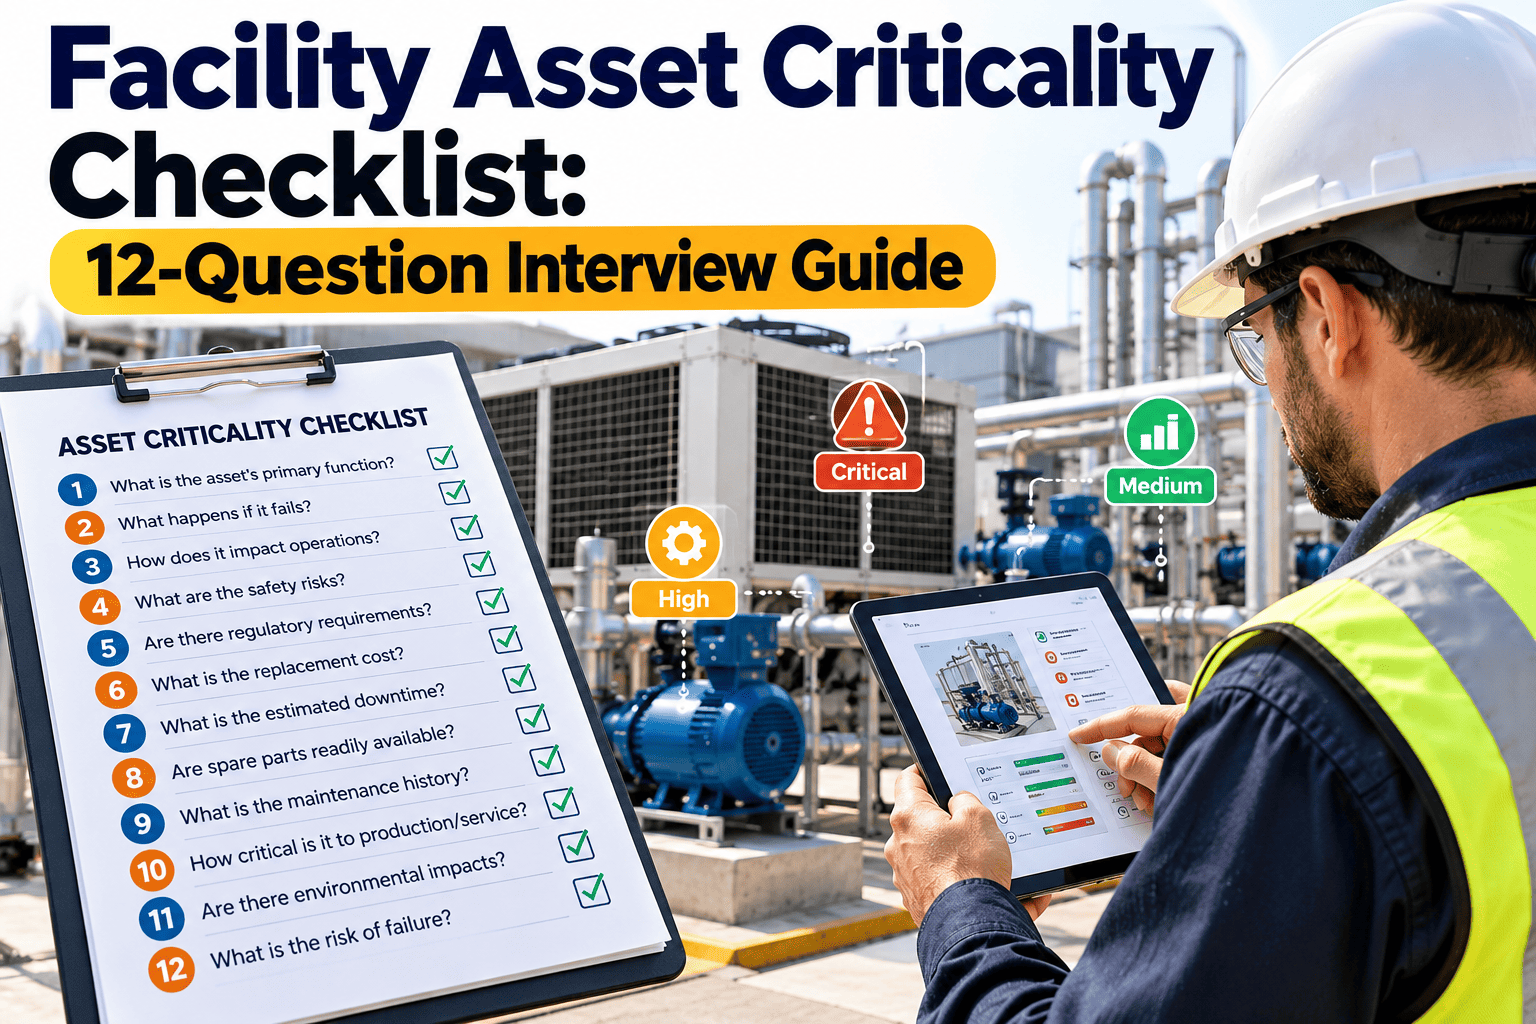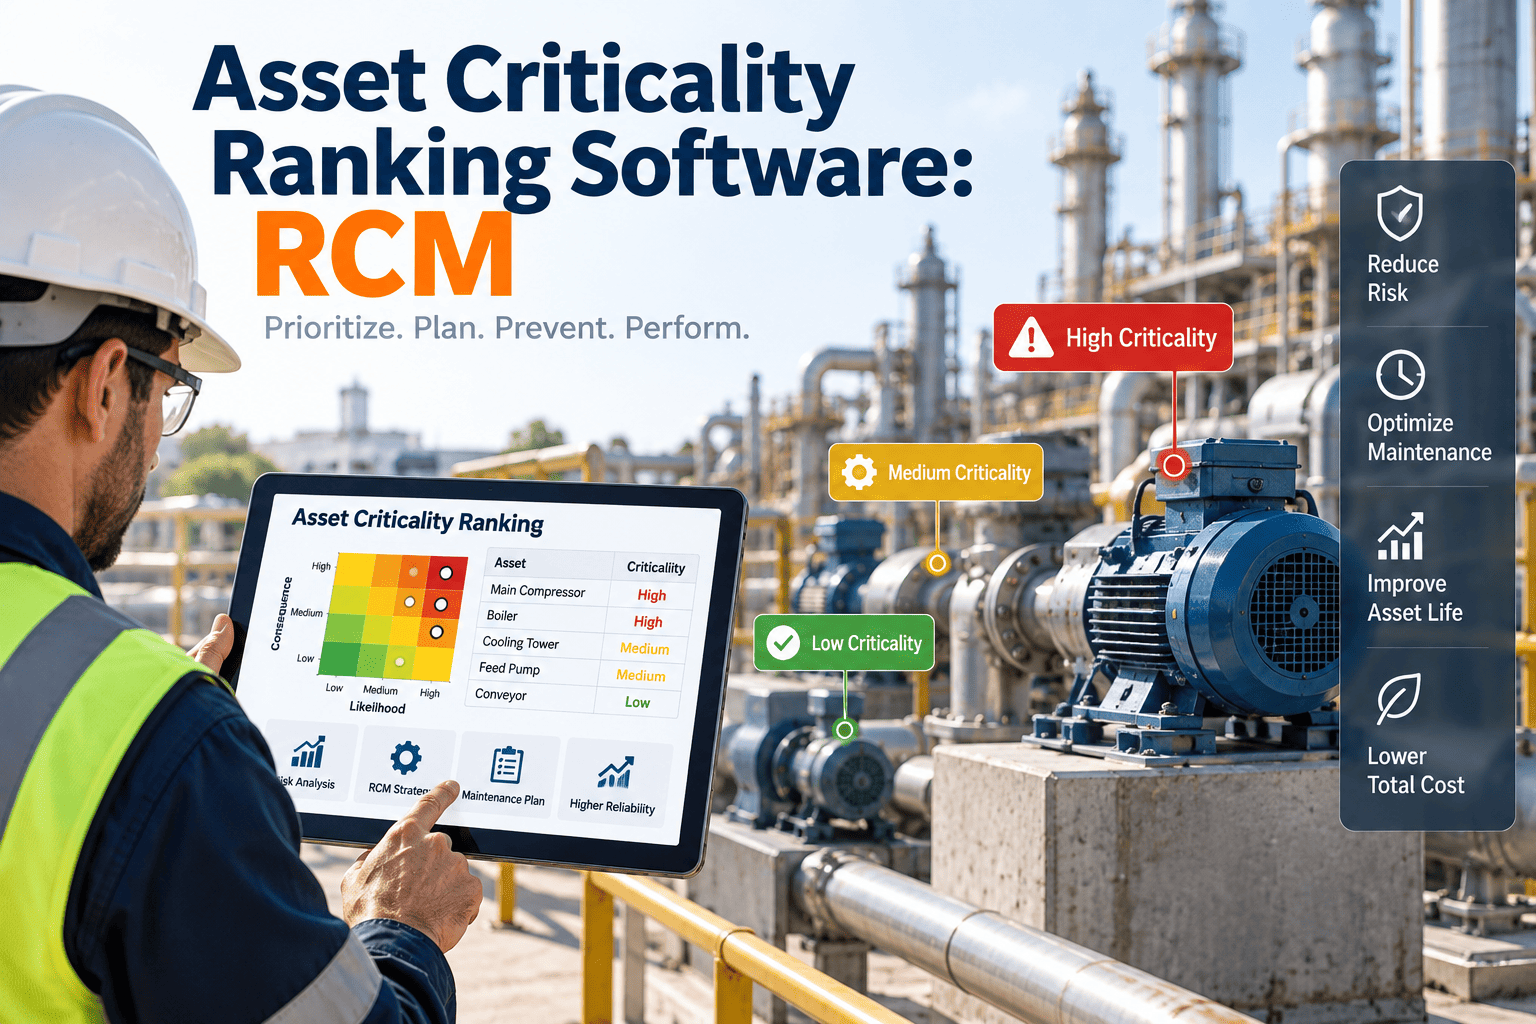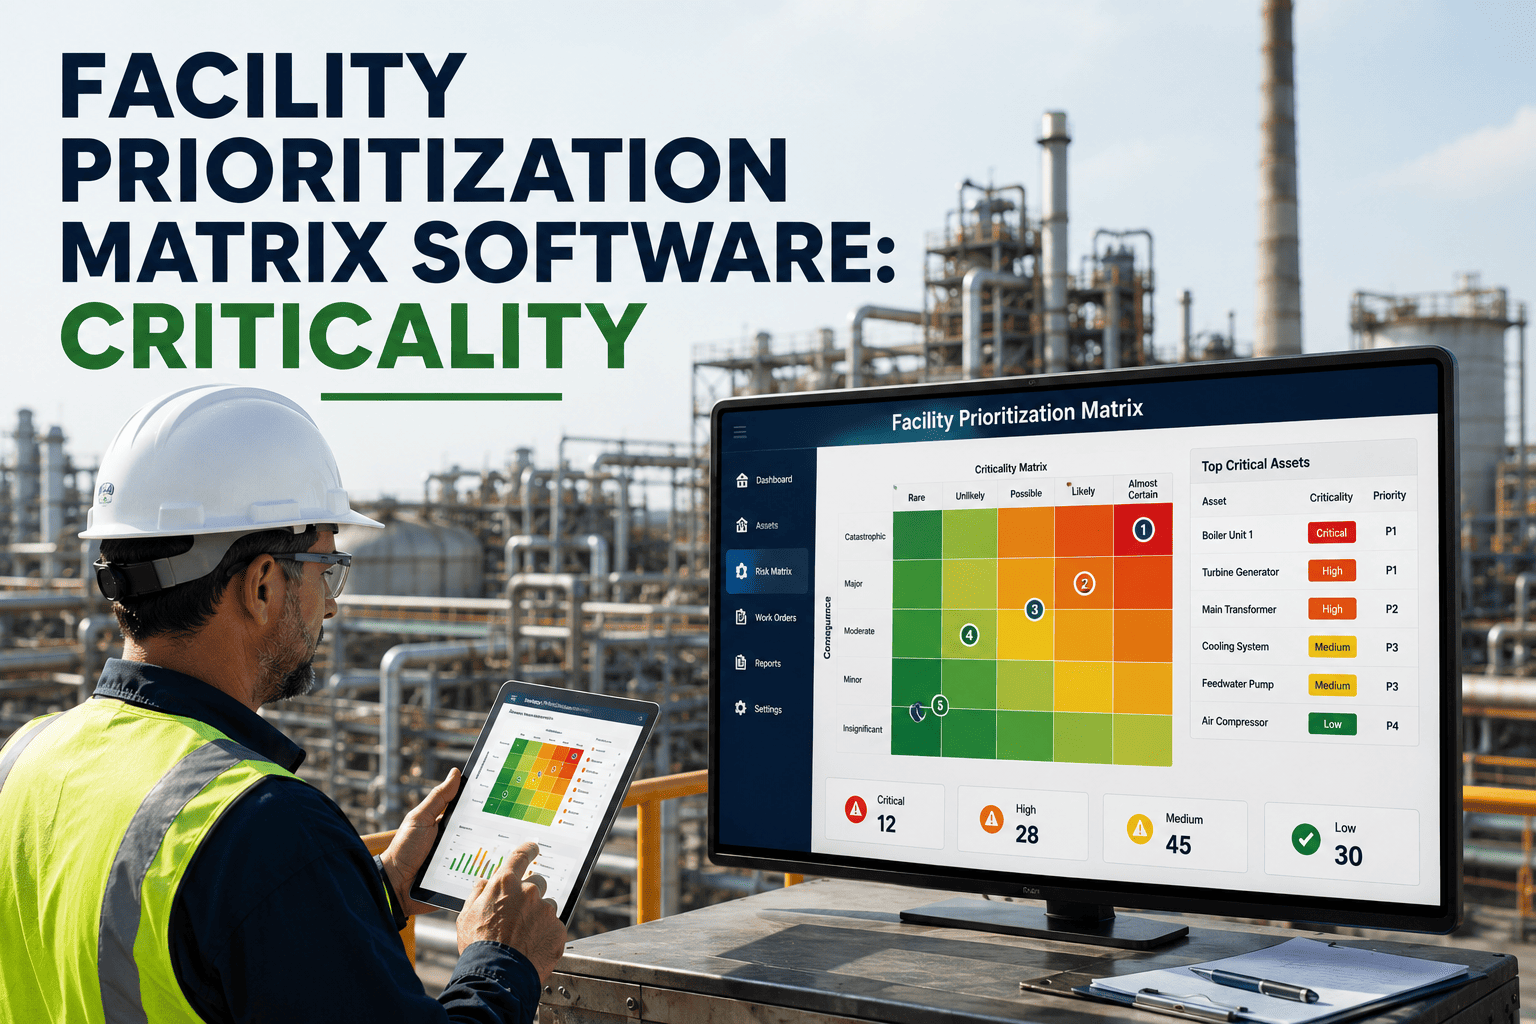
Every facility carries hundreds or thousands of assets, yet only a small share justify the sensors, analysis time, and technician hours that predictive maintenance demands. Critical asset identification is the step that decides where those limited resources go. Without a defensible ranking, PdM budgets get spent on whatever is easiest to instrument or whatever failed last month. A structured criticality score built on consequence, likelihood, and detectability turns opinion into a ranked list, and a CMMS such as Oxmaint can keep that ranking attached to every asset record.
Critical Asset Identification: Prioritize Equipment for Predictive Maintenance
Not every asset deserves PdM. Score each one on three factors, rank the register, and point condition monitoring only at the equipment where a failure genuinely hurts the building, the occupants, or the budget.
Why Most Assets Should Never Get a PdM Program
Predictive maintenance has real costs, and spreading it across the whole register is the fastest way to make it fail.
The familiar Pareto rule of thumb says a minority of assets drive most of the operational risk. The exact split varies by building type, which is why you score your own register rather than assume a ratio.
Symptoms of a Facility Without a Criticality Ranking
- Monitoring follows convenience. Sensors go on assets with easy access, not on the ones that shut down tenants or operations.
- Everything is labeled urgent. When every request is high priority, technicians fall back on whoever calls loudest.
- Spare parts mismatch. Critical equipment has no on-site spares while low-impact items fill the storeroom.
- PM schedules are uniform. A rooftop unit serving a data room gets the same interval as a unit serving a storage corridor.
- Capital plans lack evidence. Replacement requests cannot be defended because no one can show which assets carry the most risk.
The Three-Factor Criticality Scoring Model
The model below is a practical, FM-friendly adaptation of the risk logic used in reliability-centered maintenance, scored from 1 to 5 on each factor.
Consequence of Failure
Measures what happens when the asset stops: safety exposure, occupant impact, regulatory breach, lost revenue, damage to other equipment, and repair cost.
Likelihood of Failure
Uses work order history, age against expected life, operating hours, environment, and known failure modes to estimate how probable a failure is.
Detectability
Asks whether degradation shows up early enough to act. Low detectability raises the score, because blind failures are the ones PdM is best placed to catch.
Scoring Guide: What Each Rating Means
| Score | Consequence | Likelihood | Detectability |
|---|---|---|---|
| 1 | Cosmetic or minor inconvenience | No failures in several years | Obvious failure, easy to spot early |
| 2 | Local comfort complaint, quick workaround | Occasional failure, well understood | Routine rounds usually catch it |
| 3 | Area disruption or moderate repair cost | Recurring failures on similar assets | Detectable only with scheduled inspection |
| 4 | Tenant or operations shutdown, secondary damage | Frequent failures or aging past expected life | Degradation hard to see without instruments |
| 5 | Life safety, regulatory violation, or major loss | Active failure pattern or known defect | Fails with little or no warning |
Worked Example: Scoring Five Common Facility Assets
The scores below are illustrative, to show how the multiplication separates assets that look similar on a list.
| Asset | C | L | D | Score | Suggested strategy |
|---|---|---|---|---|---|
| Chiller serving a data hall | 5 | 3 | 4 | 60 | PdM: vibration, oil analysis, performance trending |
| Main distribution switchgear | 5 | 2 | 4 | 40 | PdM: infrared thermography, scheduled testing |
| Cooling tower fan motor | 4 | 3 | 3 | 36 | PdM: vibration route, plus time-based PM |
| Standard office VAV box | 2 | 3 | 2 | 12 | Time-based PM or inspect-and-repair |
| Corridor light fixture | 1 | 2 | 1 | 2 | Run to failure |
Notice the switchgear: its likelihood is modest, but consequence and low detectability push it to the top tier. Likelihood alone would have hidden it.
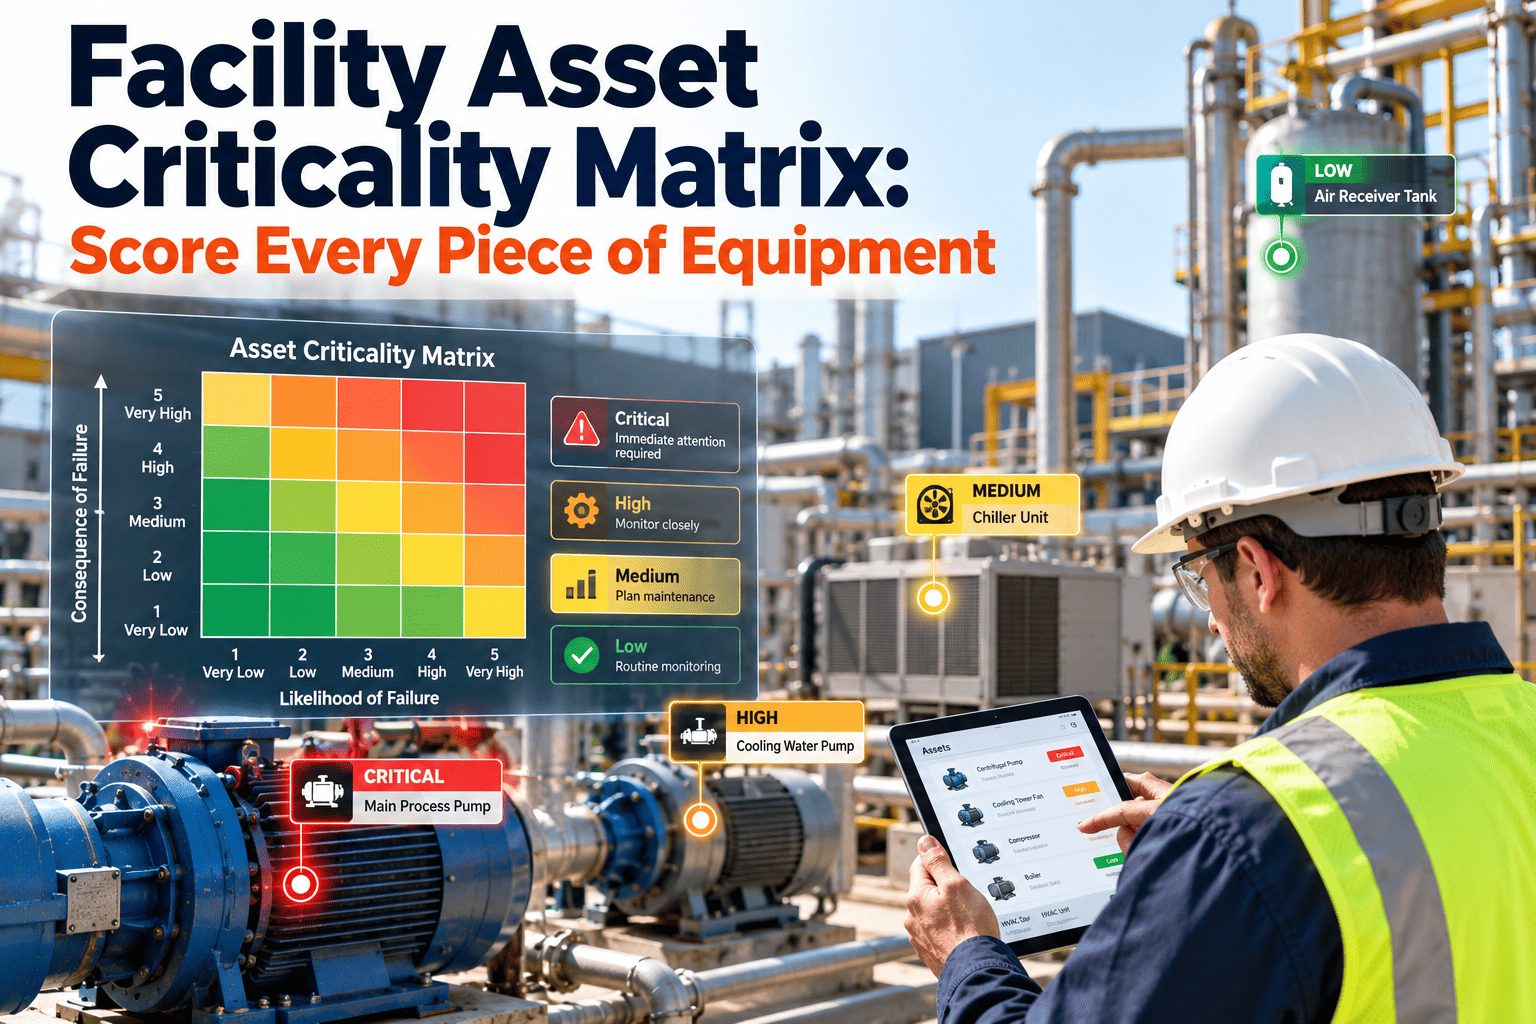
Reading the Risk Matrix
Plotting consequence against likelihood shows where detectability should break ties.
Step-by-Step: Building the Critical Asset List
Clean the asset register
Remove duplicates, confirm locations, and group assets by system so scoring is consistent.
Define consequence criteria
Agree in writing what a 5 means for safety, occupants, compliance, and cost in your building.
Pull failure history
Use work orders, downtime logs, and technician knowledge to set likelihood scores.
Rate detectability
For each failure mode, ask whether a measurable symptom appears before functional failure.
Calibrate in a group session
Bring operations, engineering, and the lead technician together to challenge outliers.
Assign a strategy and review
Match each tier to PdM, PM, inspection, or run to failure, then re-score at least annually.
Matching Criticality Tiers to Maintenance Strategies
| Tier | Typical assets | Primary strategy | Spares and response |
|---|---|---|---|
| Tier 1: Critical | Chillers, switchgear, generators, fire pumps, main air handlers | Predictive and condition-based, plus targeted PM | Critical spares on site, defined emergency response |
| Tier 2: Important | Cooling towers, boilers, secondary pumps, elevators | Preventive maintenance with periodic condition checks | Key spares stocked, next-day repair |
| Tier 3: Standard | VAV boxes, exhaust fans, small pumps | Time-based PM or inspect and repair | Common spares, scheduled repair |
| Tier 4: Low | Light fixtures, minor fittings, non-essential equipment | Run to failure | Order on demand |
Common Criticality Mistakes: Before and After
- Criticality set by the loudest tenant or manager
- One score, usually based only on cost
- Ranking done once and never revisited
- PdM applied to every asset a vendor can instrument
- Scores kept in a spreadsheet no technician sees
- Criteria written down and agreed across teams
- Three factors scored and multiplied
- Re-scored after major failures, retrofits, and annual reviews
- PdM reserved for assets with a detectable failure signal
- Criticality field visible on every work order
When PdM Is Not the Right Answer for a Critical Asset
High criticality does not automatically mean predictive monitoring.
- No measurable precursor. If a component fails suddenly with no early symptom, condition monitoring adds cost without warning. Redundancy or scheduled replacement works better.
- Failure interval is too short. If degradation runs from detectable to failed faster than you can inspect, sensing must be continuous or the strategy changes.
- Cheap to replace. A critical but inexpensive part is often better handled with a stocked spare and a fast swap.
- Regulated testing already applies. Some life safety systems follow mandated inspection and test schedules, which should be tracked as compliance work first.
Turn Your Criticality Scores Into a Working Priority List
Store the ranking against each asset and let it drive work order priority, PM intervals, and PdM selection.
Aligning With SAE JA1011 and SMRP Practice
Criticality scoring works best when it sits inside a recognized reliability framework.
SAE JA1011
Defines the minimum criteria a process must meet to be called reliability-centered maintenance, including identifying functions, failure modes, and consequences. Your scoring should trace back to those elements.
SMRP guidance
Society for Maintenance and Reliability Professionals frameworks treat criticality as the basis for allocating maintenance effort and for choosing which equipment metrics to track.
How Oxmaint Supports Critical Asset Management
A ranking only helps if technicians and planners see it where they work.
- Asset management. Keep hierarchy, location, and criticality fields together so any technician can see what matters.
- Inspections on mobile. Capture readings from vibration, temperature, or thermography routes against Tier 1 assets and trigger corrective work when limits are crossed.
- Inventory. Link critical spares to the assets that need them and flag low stock before a failure.
- Compliance records. Store inspection and test history for assets where documentation is required.
KPIs to Prove the Prioritization Works
Frequently Asked Questions
How many assets should be classed as critical?
There is no fixed number. Most facilities find a small minority qualify once consequence is scored honestly, and the list can be refined inside Oxmaint.
How often should criticality be reviewed?
At least annually, and after major failures, retrofits, or changes in building use.
Can a low-cost asset be critical?
Yes. A cheap sensor or valve that shuts down a critical system scores high on consequence.
Why include detectability?
It separates failures you can predict from those you cannot, which guides whether PdM is worth funding.
Can we set this up with help?
Yes, you can book a demo to walk through criticality fields and priority rules.
Gathering the Data Before You Score
Scores are only as good as the evidence behind them. Collect these inputs first so the workshop debates facts, not memories.
- Asset register extract. Equipment ID, system, location, install date, manufacturer, and model for every candidate asset.
- Work order history. Count corrective jobs, repeat repairs, and emergency callouts per asset over a meaningful period.
- Downtime and impact notes. Which areas, tenants, or processes lost service, and for how long.
- Single points of failure. Systems with no redundancy, such as one chiller feeding an entire floor.
- Regulatory and safety flags. Assets tied to life safety, environmental limits, or contractual service levels.
- Lead times and vendor support. How long a replacement part or specialist takes to arrive.
How Criticality Shifts by Facility Type
The same equipment can score very differently depending on what the building does. Adjust your consequence definitions to match.
| Facility type | Consequence drivers | Assets that often score high |
|---|---|---|
| Hospital or clinic | Patient safety, infection control, regulatory exposure | Emergency power, medical gas, air handlers serving critical rooms |
| Data center | Uptime commitments, thermal limits | Chillers, CRAH units, UPS, switchgear |
| Commercial office | Tenant comfort, lease obligations, elevator availability | Central plant, vertical transport, main air handlers |
| School or campus | Occupant safety, seasonal heating needs | Boilers, fire alarm, ventilation for dense spaces |
| Retail or hospitality | Customer experience, revenue per hour | Rooftop units, refrigeration, point-of-sale power |
| Light industrial | Production loss, product quality | Compressed air, process cooling, motor control centers |
Using Criticality to Set Spares and Response Targets
A ranking should change what you stock and how fast you respond, not just which assets get sensors.
- Critical spares. For Tier 1 assets with long lead times, hold the parts most likely to fail, such as contactors, belts, bearings, and control boards.
- Response expectations. Define target response times by tier so the dispatcher knows a Tier 1 alarm outranks a Tier 3 comfort call.
- Contractor agreements. Match service contracts to tier, with faster response and emergency coverage reserved for critical systems.
- Redundancy checks. Where a Tier 1 asset has a standby unit, verify the standby is actually tested and rotated.
Getting Stakeholders to Agree on the Scores
Bring the right people
Operations knows what the building needs, technicians know what actually breaks, and finance knows what downtime costs. Scores improve when all three are in the room.
Settle disputes with evidence
When two people disagree on a rating, return to the written criteria and the work order history. Record the reasoning so the decision survives staff changes.
Keeping the Ranking Current
A criticality list that is never updated becomes another stale spreadsheet. Build review triggers into the process.
- After a major failure. Revisit consequence and likelihood scores for the failed asset and its neighbors.
- After a retrofit or replacement. New equipment resets age, failure history, and sometimes detectability.
- When building use changes. A converted floor, new tenant, or added process can raise consequence overnight.
- When monitoring is added. Improved detectability can lower a score, freeing effort for other assets.
- On a fixed annual review. Even if nothing dramatic happened, confirm the top tier still reflects reality.
Treat the scoring sheet as a living record. Version it, date it, and name who approved each change.
Avoiding Bias When Scoring
- Recency bias. The asset that failed last week feels more critical than the one that quietly carries the building. Check history over several years.
- Cost bias. Expensive equipment is not automatically critical, and cheap parts can stop an entire system.
- Familiarity bias. Teams over-score what they know well. Have someone from a different shift review the list.
- Ownership bias. Each department will argue its equipment matters most. Use the written criteria as referee.
Put PdM Where Failure Costs the Most
Rank your assets, assign the right strategy to each tier, and keep the results visible on every work order.