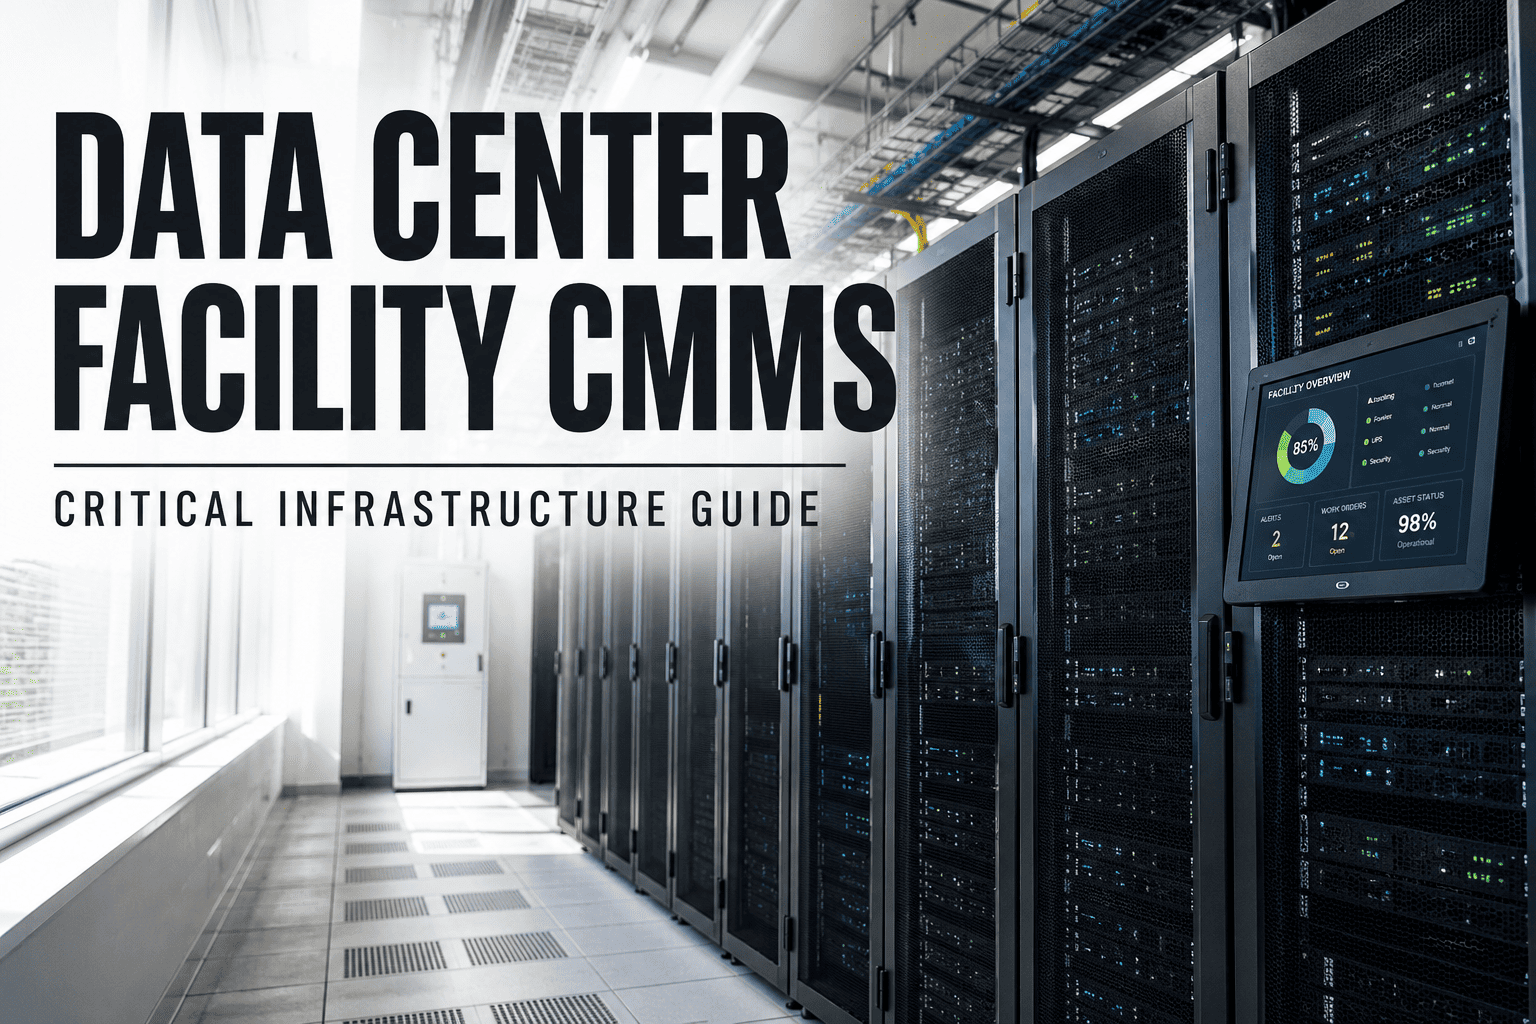
A Tier III colocation data center operator was treating every UPS module, CRAC unit, and generator on the floor with roughly the same PM frequency — which sounds cautious until you realize it means the assets that actually gate uptime get the same attention as a spare cooling fan in a low-load hall. After a string of near-miss outages tied to aging UPS batteries, the facilities team ran a full criticality analysis, rebuilt its redundancy documentation, and restructured spare-parts stock around failure impact instead of shelf convenience. The result was a 78% cut in unplanned downtime over the following year, detailed below alongside how Start Free Trial supported the rollout.
How a Tier III data center cut unplanned downtime 78% with criticality-driven maintenance
A composite case built on patterns reported across Uptime Institute's annual outage research, showing what happens when a facilities team stops maintaining every asset equally and starts maintaining by consequence of failure.
Facility snapshot
Before: uniform maintenance, uneven risk
Uptime Institute's 2025 Global Data Center Survey found power issues account for 45% of impactful outages industry-wide, most often tied to UPS problems, with cooling issues a distant second at 14%. This facility's own incident log matched that pattern almost exactly — but its maintenance calendar didn't reflect it.
The facility had grown from a single hall to a three-hall campus over six years, and its maintenance program had grown by addition rather than redesign: every new asset got added to whichever PM template looked closest, rather than being scored against the assets already in the register. By the time the criticality program started, the CMMS held over 600 mechanical and electrical assets on effectively three PM frequencies — weekly, monthly, and annual — with almost no documented rationale for which asset landed on which cycle beyond "that's what the last team set up."
- UPS batteries tested on the same annual cycle as non-critical lighting panels
- No documented redundancy map — technicians relied on institutional memory of which CRAC unit backed up which zone
- Spare parts stocked by purchase-order convenience, not by which failures would actually cause an outage
- Near-miss events (a failed UPS module caught during routine rounds) went unlogged as data
- UPS and generator assets moved to the top criticality tier with tightened test cadence
- Full redundancy map built into the asset hierarchy, documenting N+1 relationships per zone
- Spares stocked against a criticality-weighted list, prioritizing single points of failure
- Every near-miss logged and reviewed as leading-indicator data, not dismissed as a save
What the near-miss review actually found
The event that triggered the program wasn't a full outage — it was a UPS module that failed its internal self-test during a routine weekly round, caught only because a technician happened to notice an alarm LED that had been active for two days without anyone logging it. Digging into that gap surfaced a pattern that had been building for years.
UPS battery strings tested on a fixed annual schedule regardless of age or prior internal resistance trend
Alarm events on non-shutdown-triggering faults routinely went unlogged, since they didn't interrupt service that day
The "redundant" CRAC unit in the affected zone had been running at reduced capacity for months after a prior repair, unknown to the current shift team
None of these three findings would have caused an outage on their own. Together, they meant the facility was one coincident failure away from an event that Uptime Institute's data suggests would have had roughly a 50/50 chance of costing over $100,000 to resolve, based on industry-wide reporting on outage costs at facilities of comparable scale.
Three workstreams run over nine months
Criticality analysis across the mechanical and electrical asset base
Every asset on the power and cooling path was scored on consequence of failure — outage impact, redundancy depth, and repair lead time — and sorted into three tiers, separating true single points of failure from assets with deep redundancy. Scoring took six weeks and involved facilities engineering, the site's operations manager, and a review of two years of incident tickets to make sure the tiers reflected actual failure history, not just design intent.
Redundancy audit and documentation
The team mapped every N+1 relationship in the power and cooling chain into the asset hierarchy, closing gaps where "redundant" capacity assumptions hadn't been verified against actual load in over two years. This is where the degraded CRAC unit from the root-cause review got flagged and repaired, along with two similar cases elsewhere in the facility that hadn't yet caused a noticeable problem.
Spare parts optimization by criticality tier
Stock levels for top-tier assets — UPS modules, generator control boards, CRAC compressors — were rebuilt around consequence of stockout, not historical order patterns, cutting time-to-repair on the failures that matter most. A parts audit found the facility was holding six months of stock on a low-criticality lighting contactor and zero spares on a generator control board with a four-week vendor lead time — exactly backward from what a criticality-weighted stocking policy would have set.
What other facility teams can take from this rollout
Near misses are data, not luck
The catch that started this program only became useful once it was treated as a leading indicator worth investigating, rather than a story about an alert technician.
Redundancy has to be verified, not assumed
A backup system that hasn't been load-tested recently is a documentation entry, not a guarantee — the degraded CRAC unit had looked fully redundant on paper for months.
Spares strategy should follow criticality, not order history
Stocking by what's been ordered before tends to overstock convenient, low-consequence parts and understock the ones with the longest lead times and highest impact.
Twelve months after rollout
Industry-wide, Uptime Institute's 2025 outage survey found more than half of operators reporting a significant, serious, or severe outage in the past year with a cost over $100,000, and roughly one in five above $1 million. Avoiding even one severe event of that scale is enough on its own to justify the criticality program's cost.
The 78% downtime reduction figure covers unplanned outage hours specifically, but the secondary effects mattered nearly as much to the facilities team. Mean time to repair on Tier 1 asset failures dropped by more than half once the right spare was reliably on the shelf, since technicians were no longer waiting on emergency freight for a part that should have been stocked. Technician confidence in the redundancy documentation also improved measurably — post-rollout surveys of the operations team showed far fewer instances of staff manually re-verifying a backup path before trusting it during a live event, which by itself cut response time during the two minor incidents that did occur in the following year.
How the criticality tiers were scored
The team scored each asset across three dimensions rather than relying on a single "critical or not" judgment call, since a purely binary system had been part of what let the degraded CRAC unit slip through unnoticed for months.
| Scoring dimension | What it measures | Example finding |
|---|---|---|
| Outage impact | What fails downstream if this asset stops working right now | UPS module failure affects an entire hall, not just one rack row |
| Redundancy depth | Whether a verified backup absorbs the failure, and how recently that backup was tested | One CRAC unit's "redundant" status hadn't been load-verified in over a year |
| Repair lead time | How long it takes to source a replacement part or vendor technician | Generator control boards carried a four-week vendor lead time with zero spares on hand |
An asset scoring high on outage impact and repair lead time, but low on verified redundancy depth, moved to Tier 1 regardless of its original equipment cost — which is how a mid-priced CRAC unit ended up ranked above several more expensive assets elsewhere in the facility.
See how OxMaint structures criticality tiers and redundancy mapping
Walk through an asset hierarchy built around consequence of failure, not just equipment type — book a session with your own critical power and cooling assets.
What changed operationally inside the CMMS
The criticality program only became durable once it lived inside the same system technicians already used for daily work orders, rather than a one-time spreadsheet exercise that would drift out of date within a quarter.
Tiered asset hierarchy
Every UPS, generator, and CRAC unit tagged with its criticality tier and redundancy relationship, visible from the top-level dashboard down to individual components.
Tier-based PM scheduling
PM frequency and inspection depth automatically set by criticality tier rather than a single facility-wide default.
Near-miss logging
Catches during routine rounds get logged as inspection findings, feeding the same trend reporting as full failures.
Criticality-weighted spares
Reorder points and stocking priority set by tier, ensuring single-point-of-failure components never sit at a standard reorder threshold.
Data center criticality analysis: frequently asked questions
What is a criticality analysis for a data center?
It's a structured ranking of every mechanical and electrical asset by consequence of failure and redundancy depth, used to set maintenance priority instead of treating all equipment the same. The output is typically a tiered list — critical, important, standard — that then drives PM frequency, spares stocking, and monitoring investment for each asset.
Why did UPS assets carry the highest criticality tier?
Power issues, and UPS problems specifically, are consistently the leading cause of impactful data center outages industry-wide, making them the highest-consequence failure points on the critical path. In this facility's case, the near-miss that triggered the whole program was a UPS battery string issue, which made the case for tightening that asset class especially direct.
How is this different from a general asset criticality analysis?
Data center criticality work has to account for redundancy architecture — N+1, 2N — explicitly, since a failed component behind verified redundancy carries a very different risk profile than the same failure on a true single point of failure. A generic manufacturing criticality model that scores purely on asset cost or replacement time misses this distinction entirely.
How long does a criticality rollout typically take?
This facility's full rollout, from initial scoring to tier-based scheduling live across the asset base, took nine months. Smaller facilities with fewer redundant paths to document can move faster.
Does criticality-based maintenance replace redundancy, or work alongside it?
Alongside it. Redundancy protects against a single failure causing an outage; criticality-driven maintenance reduces how often that failure happens in the first place. Book a demo at calendly.com/oxmaintapp/30min to see both working together.
Build your own criticality-tiered maintenance program
Map redundancy, tier your critical assets, and set spares strategy by consequence of failure — the same structure behind this facility's 78% downtime reduction.