Deferred maintenance doesn't disappear — it compounds. Every repair pushed to next quarter adds risk, cost, and complexity to your capital planning horizon. Facilities teams managing large backlogs without a structured prioritisation framework typically overspend on low-impact repairs while critical assets continue to deteriorate. This guide explains how to apply Facility Condition Index (FCI) scoring alongside safety and operational risk data to build a defensible, data-driven backlog reduction strategy that connects directly to capital planning.
MAINTENANCE STRATEGY
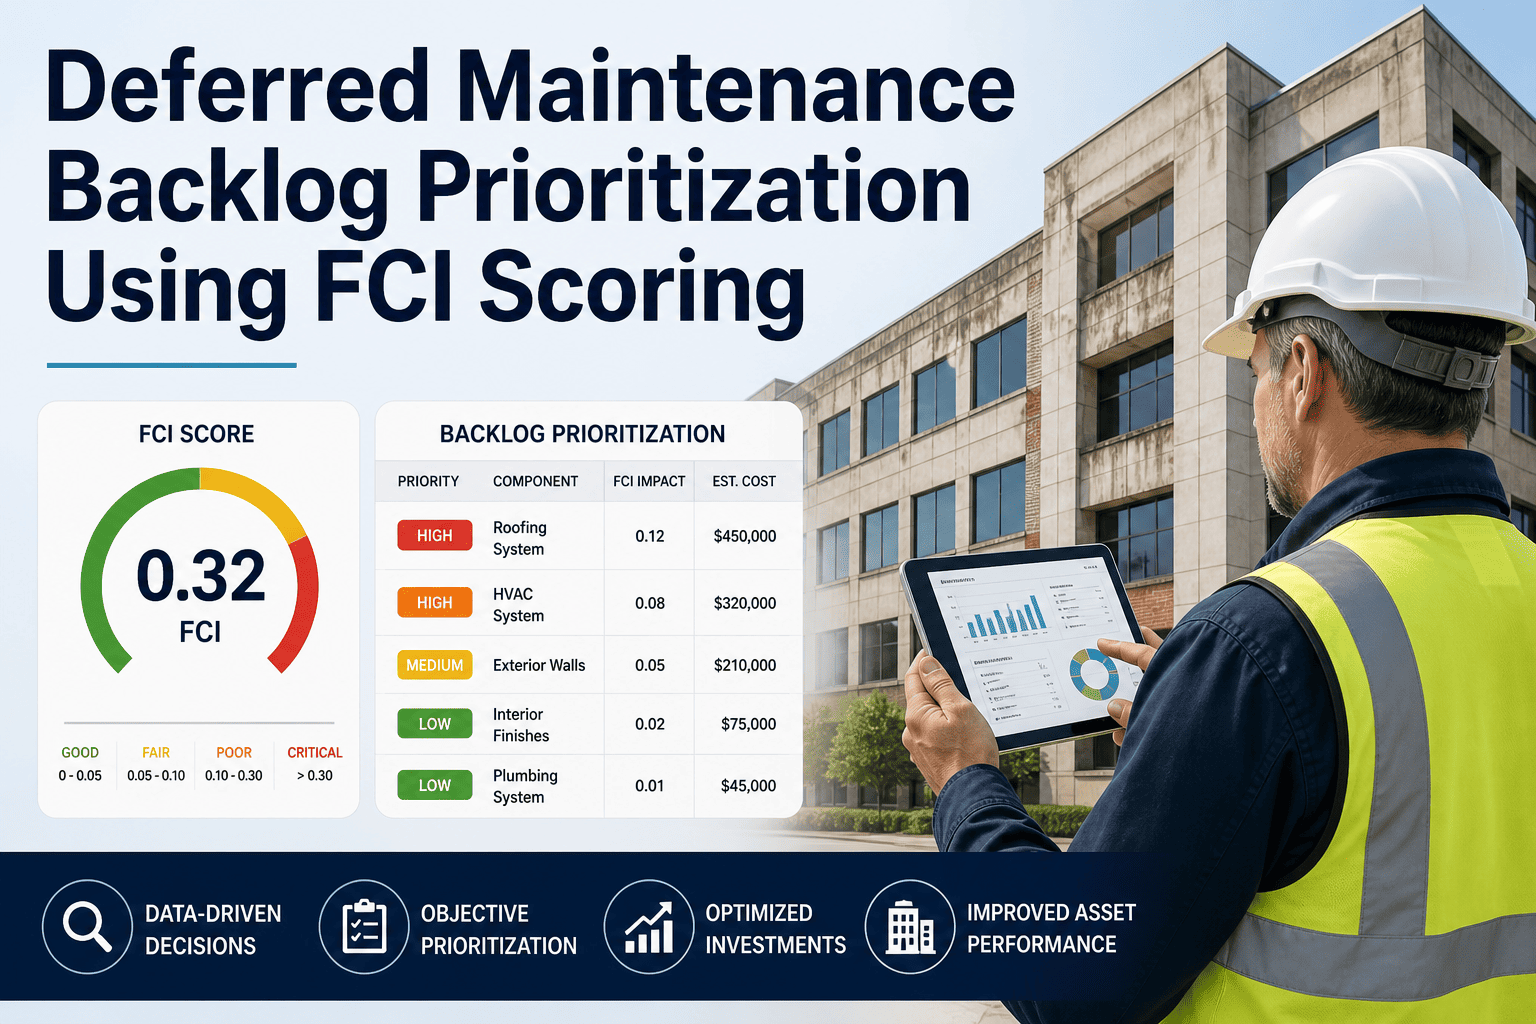
Deferred Maintenance Backlog Prioritisation Using FCI Scoring
Stop spending on the loudest problems. FCI-based prioritisation directs capital to the repairs with the highest safety, operational, and financial return — before failures force your hand.
The Scale of the Deferred Maintenance Problem
Deferred maintenance backlogs have reached crisis levels across commercial, healthcare, education, and government facilities. Budget constraints force teams to defer repairs year after year until minor issues become major capital events. Understanding the true scale of the problem is the first step to building a strategy that executive teams and capital committees will fund.
$650B
Estimated deferred maintenance backlog across US public facilities — growing at approximately 10% annually without structured intervention
4:1
Ratio of future repair costs to current deferral cost when critical maintenance is postponed beyond the manufacturer's recommended service interval
34%
Average portion of deferred maintenance backlogs classified as immediate or urgent risk — yet most teams address these items last due to lack of formal scoring
What Is the Facility Condition Index (FCI)?
The Facility Condition Index is the industry-standard metric for expressing building condition as a ratio of deferred maintenance cost to current asset replacement value. Originally developed by APPA (Association of Physical Plant Administrators), FCI is now used by healthcare systems, universities, government agencies, and commercial property managers as the foundation for capital planning and budget justification.
0 – 0.05
Good
Facility in good condition. Routine PM and minor repairs sustain asset performance.
0.05 – 0.10
Fair
Moderate backlog. Capital planning required. Targeted investment can restore to Good.
0.10 – 0.30
Poor
Significant deferred backlog. High risk of system failures. Prioritised capital programme required.
0.30 +
Critical
Replacement or major renovation often more cost-effective than continued maintenance.
The Four-Factor Prioritisation Framework
FCI alone tells you how bad the problem is — but not what to fix first. A comprehensive backlog prioritisation framework scores each deferred item across four factors to generate a composite priority score that drives capital allocation decisions and creates a defensible audit trail for board-level reporting.
Factor 1
Safety & Regulatory Risk
Items that create direct risk of injury, death, or regulatory non-compliance receive the highest weighting. Any deferral that generates a statutory compliance gap or personal injury liability must be elevated to the top of the priority queue regardless of cost or operational impact score.
Weight: 40% of composite score
Factor 2
Operational Impact
Deferred items affecting building habitability, production capacity, revenue-generating systems, or critical infrastructure receive high priority. Loss of HVAC in a hospital operating wing or failure of refrigeration in a food storage facility are examples of high-impact operational deferrals.
Weight: 30% of composite score
Factor 3
Deterioration Rate
Some deferred items deteriorate rapidly if left unaddressed, creating cascading failures that multiply cost. Roof membrane failures, water ingress, and structural corrosion are classic examples where deferring by six months can increase the repair cost by three to five times.
Weight: 20% of composite score
Factor 4
Capital Efficiency
Items where a small investment prevents a large future capital event score highly on efficiency. If a $15,000 chiller repair avoids a $120,000 replacement within three years, the capital efficiency score drives that item ahead of higher-cost but lower-leverage repairs in the queue.
Weight: 10% of composite score
FCI Scoring by Asset Class
Applying FCI at the whole-building level masks the condition variance between asset classes within the same facility. A building with an overall FCI of 0.08 may have specific systems — roofing, HVAC, or electrical infrastructure — in critical condition while other systems remain sound. Asset-class FCI scoring gives capital committees the granularity to direct investment precisely.
| Asset Class |
Typical Useful Life |
High-Risk FCI Threshold |
Common Deferred Items |
Cascade Risk if Deferred |
| Roofing Systems |
20–30 years |
0.08 |
Membrane replacement, flashing, drainage |
Structural damage, mould, insulation failure |
| HVAC & Mechanical |
15–25 years |
0.10 |
Chiller overhaul, AHU replacement, controls |
Comfort failure, air quality, production loss |
| Electrical Infrastructure |
25–40 years |
0.07 |
Switchgear, panel upgrades, cabling |
Power outage, fire risk, equipment damage |
| Building Envelope |
30–50 years |
0.09 |
Cladding, windows, waterproofing, glazing |
Water ingress, thermal loss, structural decay |
| Plumbing & Fire Systems |
20–35 years |
0.06 |
Pipework replacement, sprinkler heads, pumps |
Water damage, compliance failure, recall risk |
| Lifts & Vertical Transport |
20–25 years |
0.05 |
Drive systems, control modernisation, cabin refurb |
Entrapment, statutory violation, service outage |
ANALYTICS-DRIVEN BACKLOG MANAGEMENT
Score, Rank and Fund Your Backlog — With Data, Not Gut Feel
Oxmaint's analytics module calculates FCI by asset class, scores deferred items across safety and operational risk dimensions, and generates capital planning reports that get approved at board level.
Building the Prioritised Backlog Register
A prioritised backlog register is the output of the scoring framework applied to every deferred maintenance item in your facility. This document becomes the primary tool for capital committee presentations, budget justifications, and rolling 5-year capital plans. The register structure below represents best practice for organisations managing backlogs above $1M in deferred cost.
1
Capture Every Deferred Item
Extract all open defects, overdue PMs, and identified repair needs from your CMMS, site inspections, and contractor reports. Every item needs a cost estimate, asset ID, and system classification before scoring.
2
Calculate Asset-Level FCI
Group deferred costs by asset and divide by current replacement value for each asset class. This produces the granular FCI scores that reveal which systems are most degraded and where capital will have the highest impact.
3
Apply Four-Factor Scoring
Score each deferred item on safety risk, operational impact, deterioration rate, and capital efficiency using a standardised 1–5 scale. Apply the weighting formula to calculate a composite priority score for every item in the register.
4
Segment Into Planning Horizons
Organise the ranked register into three horizons: immediate (0–12 months, safety and critical compliance items), near-term (1–3 years, operational risk and high-deterioration items), and planned (3–5 years, efficiency and lifecycle items).
5
Connect to Budget Cycle
Map the prioritised register to annual capital and operational budgets. The scoring framework provides the narrative for capital committee presentations: each investment is justified by its priority score, FCI impact, and cascade risk avoided rather than by FM team preference.
Backlog Reduction: Paper-Based vs Analytics-Driven
Capability
Manual / Spreadsheet
Oxmaint Analytics
FCI calculation
Manual per asset — quarterly at best, error-prone
Live FCI dashboard updated with every work order close
Priority scoring
Subjective ranking by team experience or seniority
Weighted composite score applied consistently across all items
Capital reporting
Days to compile for board presentation, often outdated
One-click report export with FCI trends and priority queue
Cascade risk identification
Not modelled — discovered after failures occur
Deterioration flags on high-cascade-risk deferrals
5-year capital planning
Static spreadsheet refreshed annually
Rolling plan updated in real time as backlog changes
Expert Review
Catherine Patel, CFM, IFMA Fellow
Director of Facilities Strategy, Major Healthcare Network — 22 Years in FM Capital Planning
The fundamental problem with deferred maintenance management in most organisations is that priority decisions are driven by who complains loudest, not by which deferrals carry the most risk. FCI scoring changes that conversation entirely. When you can show a capital committee that Roof Section C has an FCI of 0.24 and a cascade risk multiplier of 3.8x, the investment decision becomes straightforward rather than political. The four-factor model described here reflects exactly how sophisticated FM teams justify capital requests. I've seen this framework reduce first-year reactive spend by over 30% simply because teams stop surprises before they happen. Platforms like
Oxmaint that keep FCI scores live rather than as annual snapshots are the difference between proactive capital management and perpetual crisis mode.
Frequently Asked Questions
What data do I need to calculate FCI for my facility?
FCI requires two inputs: the total cost of deferred maintenance items (repair or replacement costs for all known deficiencies) and the current replacement value of your facility or asset class. Replacement value data is available from quantity surveyor assessments, insurance valuations, or APPA cost tables. Deferred maintenance costs should come from your CMMS defect log, condition surveys, and contractor assessments. The quality of your FCI score is only as good as the completeness of your defect register — which is why a live CMMS integration produces significantly more accurate FCI than annual spreadsheet exercises.
Oxmaint's analytics module automates FCI calculation as work orders are created and closed.
How often should the deferred maintenance backlog register be updated?
For effective capital planning, the backlog register should be updated continuously through CMMS integration and formally reviewed quarterly. Annual updates are insufficient because deterioration rates, safety risks, and operational priorities shift throughout the year. New defects identified through reactive work orders or statutory inspections should be scored and added to the priority queue within five business days of identification. Waiting for the annual review cycle is how urgent items get missed until they become emergencies, at which point deferral costs have typically increased by a factor of three to five.
How do I present deferred maintenance prioritisation to a capital committee?
The most effective presentations frame every capital request as risk mitigation rather than maintenance expenditure. Present your FCI score by asset class alongside the cascade risk and cost consequence of continued deferral. A slide showing that the $80,000 HVAC investment prevents a $340,000 replacement within three years — supported by current FCI data and deterioration modelling — is far more persuasive than a maintenance team requesting funding. Oxmaint generates board-ready capital planning reports that include FCI trends, priority-ranked backlog, and 5-year investment scenarios directly from live data, removing the manual compilation burden from the FM team.
Is FCI applicable to all facility types or only large commercial buildings?
FCI is applicable to any facility where deferred maintenance cost can be calculated and replacement value estimated — from single buildings to multi-site portfolios. It is widely used in healthcare, higher education, government, retail, and industrial facilities. For smaller buildings, the same framework applies but can be simplified: calculate whole-building FCI rather than asset-class FCI, and apply a three-factor scoring model if the four-factor version is operationally burdensome. The core principle — directing capital to the repairs with the highest risk-weighted return — is universally applicable regardless of facility type or size.
OXMAINT ANALYTICS AND REPORTING
Turn Your Backlog Into a Capital Plan That Gets Funded
Oxmaint calculates live FCI scores, applies priority scoring to every deferred item, and generates board-ready capital reports — so your maintenance backlog becomes a strategic investment case, not a growing problem.