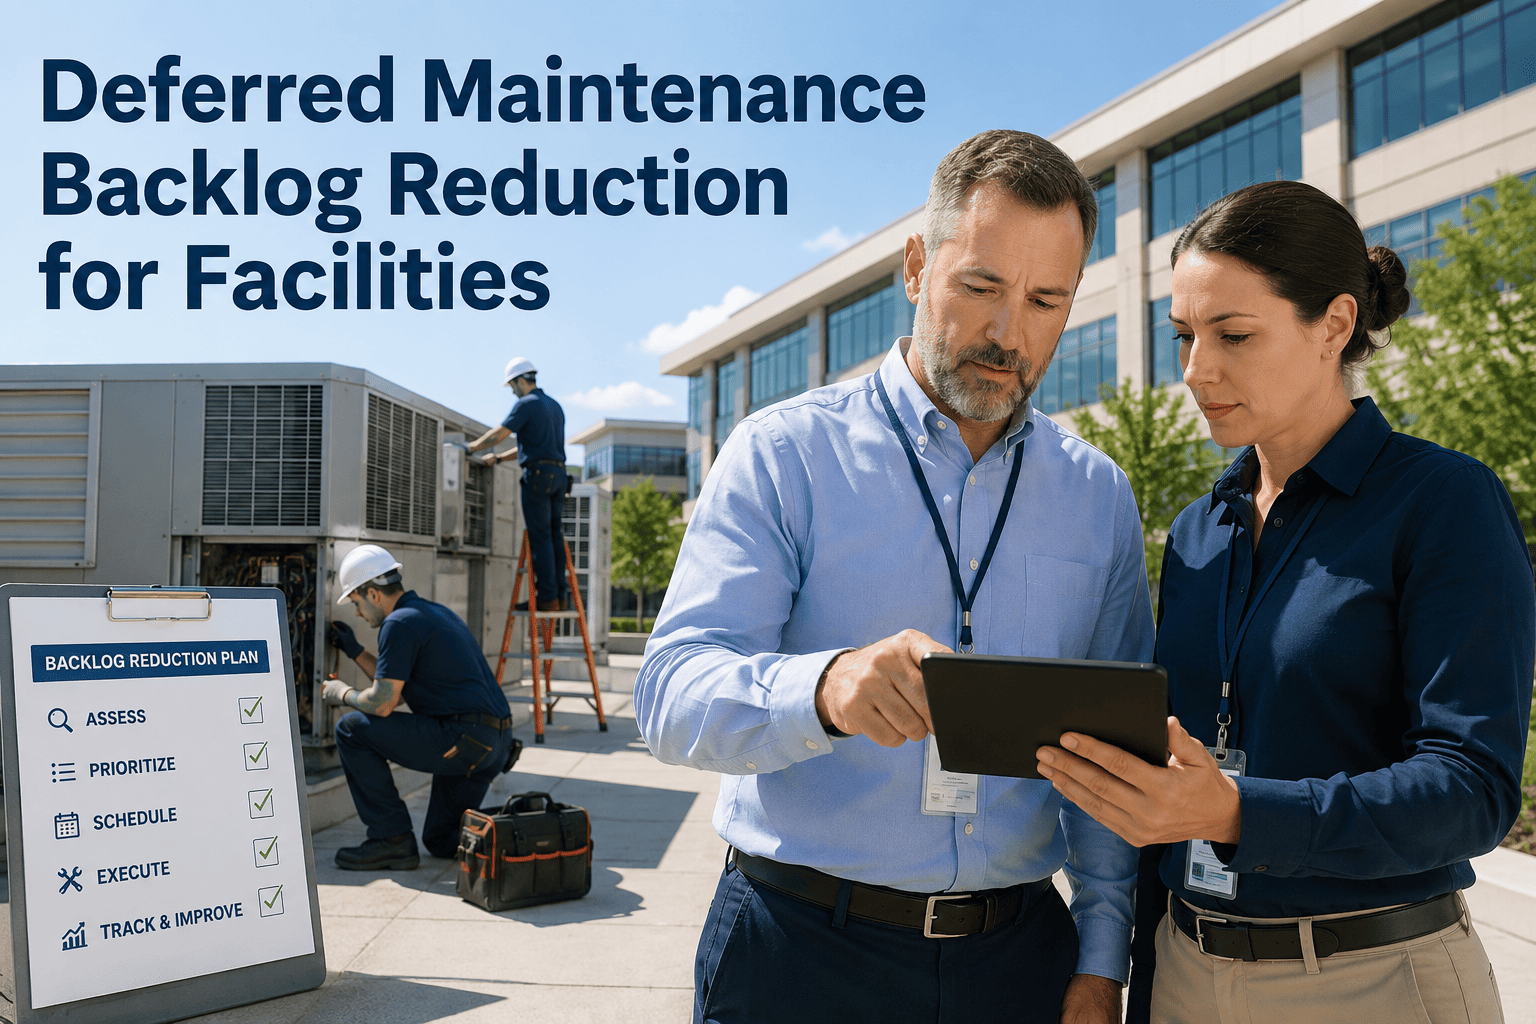
Deferred maintenance rarely arrives as a single decision. It builds through postponed roofs, extended equipment life, and repairs that lost out in budget season until the backlog is large enough to show up in the Facility Condition Index. Reducing it is possible, but it takes a sequence: know what you have, rank it by risk, secure funding, and execute without letting new backlog form behind you. This playbook lays out a 24-month path and shows where Oxmaint maintenance management software keeps the work organized and measurable.
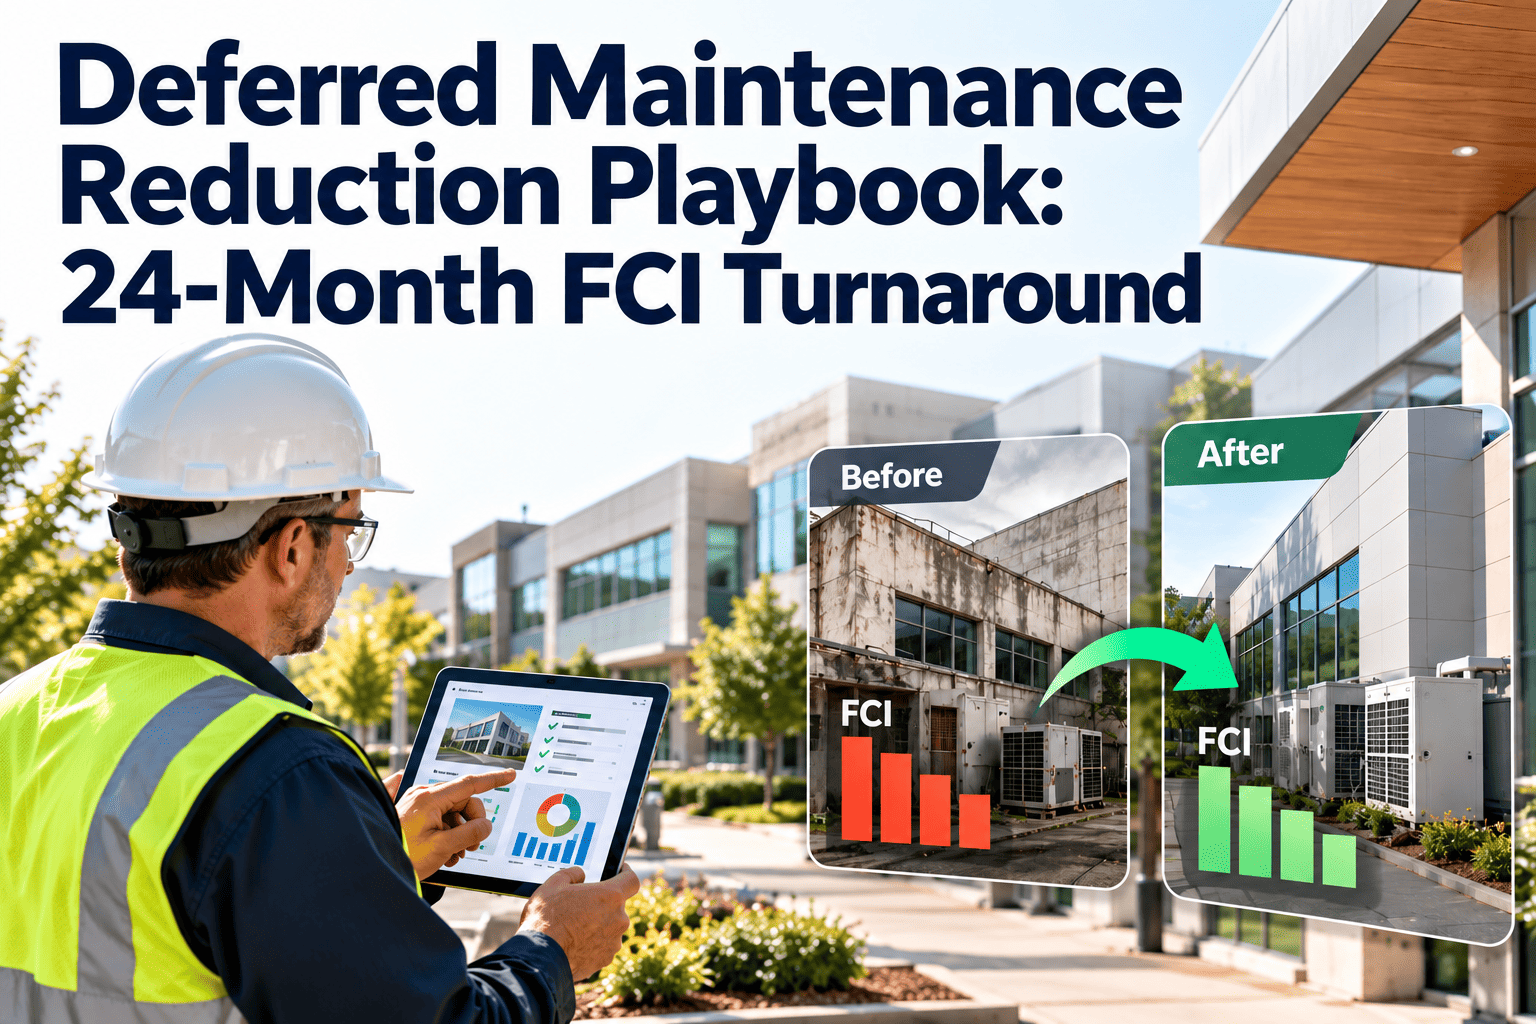
Deferred Maintenance Reduction Playbook: 24-Month FCI Turnaround
A four-phase plan to assess the backlog, prioritize by risk, secure capital, and execute, aimed at moving FCI several points in two years.
Understand What FCI Measures
FCI compares the cost of deferred maintenance and repair needs to the current replacement value of the facility.
| FCI range | Commonly used reading | Typical implication |
|---|---|---|
| Below 5% | Good | Maintain; keep inflow of backlog low |
| 5% to 10% | Fair | Targeted programs and planned renewal |
| 10% to 30% | Poor | Capital plan and risk-based sequencing |
| Above 30% | Critical | Consider major renewal or replacement |
Thresholds vary by organization and sector. Use them as a guide, and agree on your own definitions with stakeholders.
Illustrative FCI Movement
Net reduction means work completed minus new backlog created. If new deferrals keep arriving, gross spend will not move the index.
Phase 1: Assess
- Complete or refresh a facility condition assessment for each building.
- Register every major asset with age, condition, and replacement cost.
- Separate true deferred maintenance from planned capital renewal.
- Validate estimates with contractors on the largest items.
- Load the findings into one system so the backlog has a single source.
Common assessment gaps
- Old audits that no longer reflect current conditions
- Cost estimates without contingency or escalation
- Backlog scattered across spreadsheets and emails
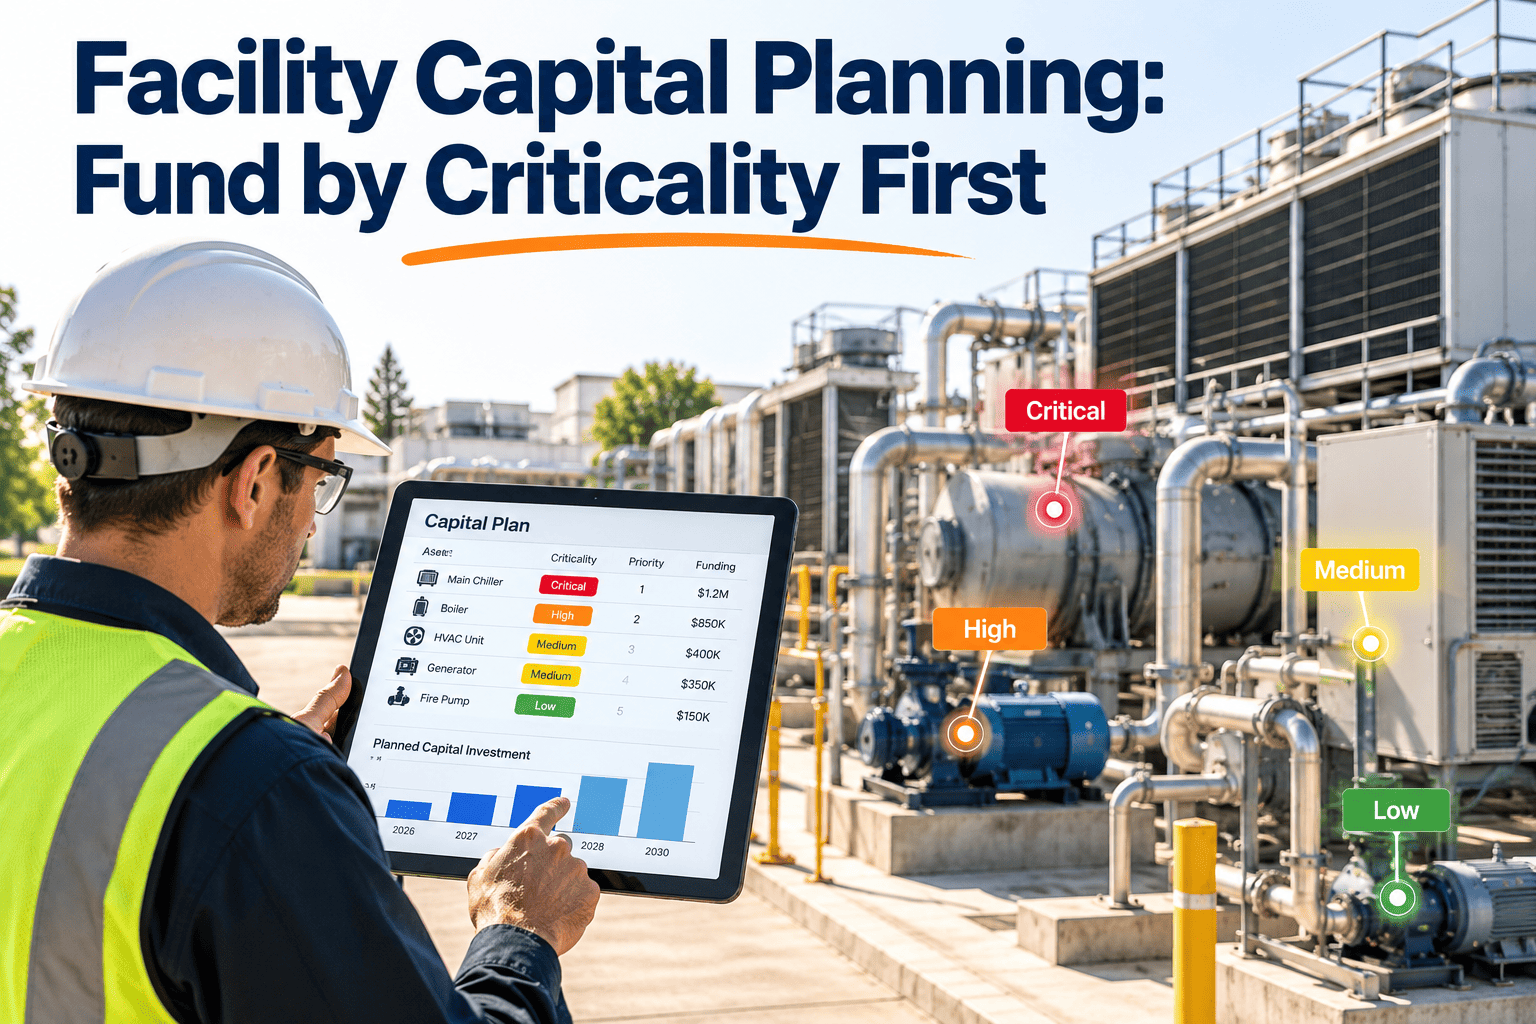
Phase 2: Prioritize by Risk
Scoring criteria
- Consequence of failure to people, operations, and property
- Likelihood based on age, condition, and failure history
- Cost of delay, including damage that compounds
- Regulatory or insurance exposure
Start With a Single Backlog You Can Trust
Bring assessments, assets, and deferred work into one platform so priorities are based on data, not on whoever shouts loudest.
Phase 3: Secure Capital
Phase 4: Execute Without Creating New Backlog
- Sequence projects by risk and by access windows
- Track each project from approval to closeout
- Report burn-down monthly against plan
- Reassess remaining items as conditions change
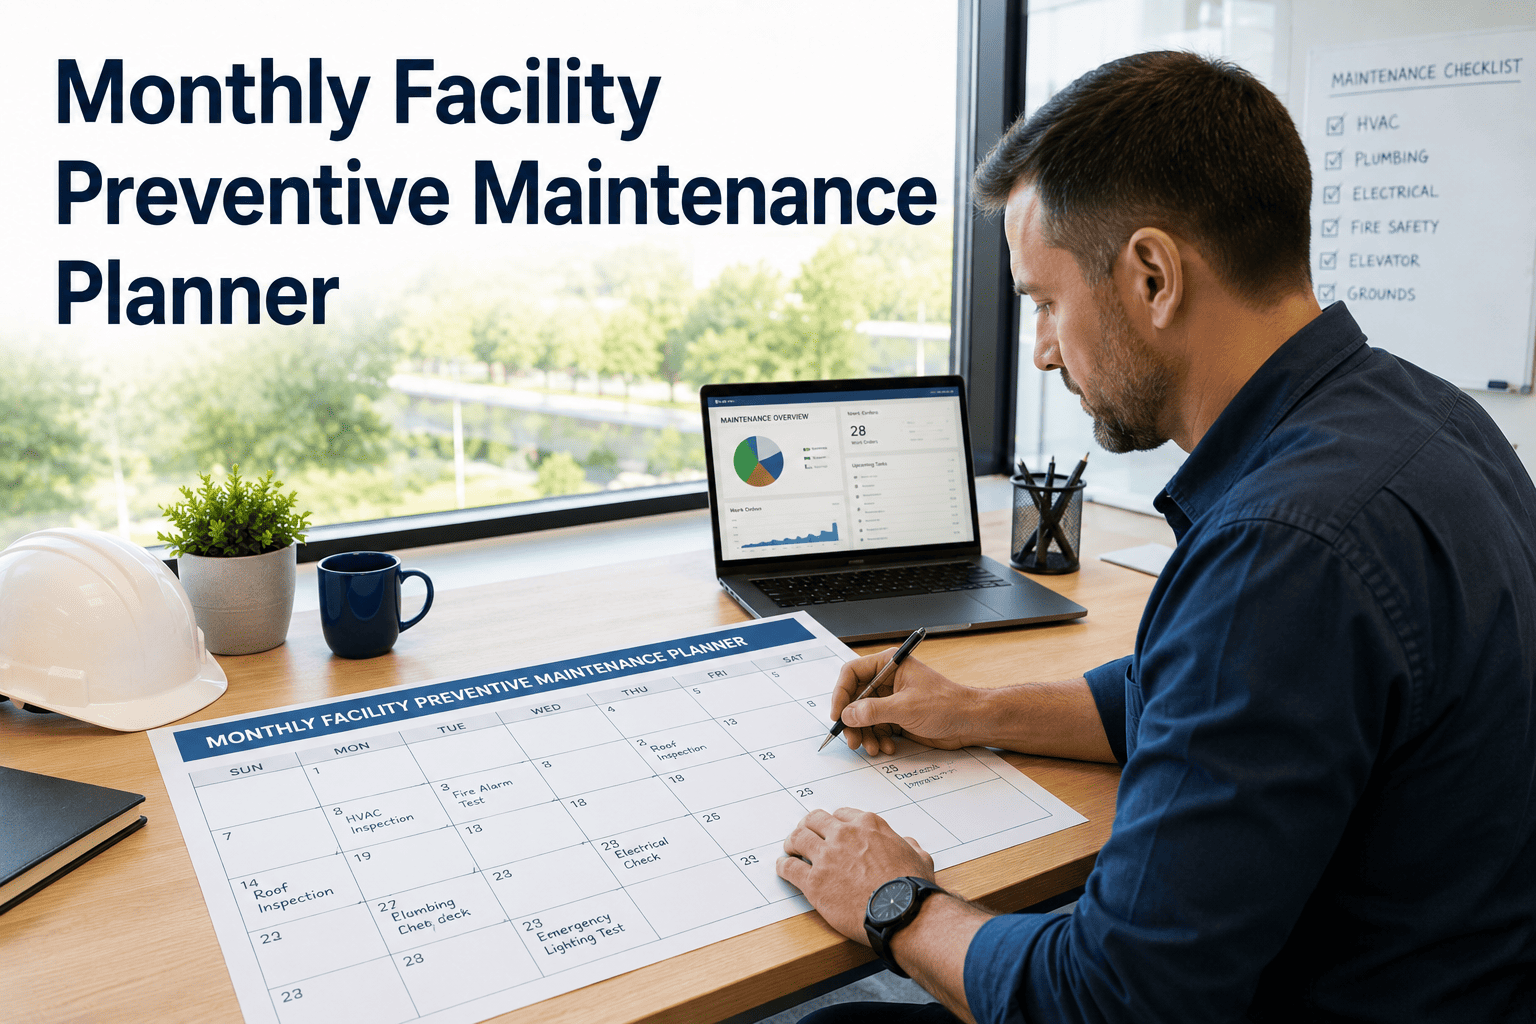
- Run preventive maintenance on schedule
- Fix small defects before they become large ones
- Plan equipment replacement before failure
- Track overdue PM as an early warning
A burn-down that ignores inflow is a treadmill. Preventive maintenance discipline is what makes FCI gains last.
Milestones to Track Across 24 Months
How Oxmaint Supports the Program
Deferred Maintenance FAQs
How long does an FCI turnaround take?
Is FCI the same as deferred maintenance?
Why did FCI not improve after spending?
Where should I start?
Can software lower FCI by itself?
Why Deferred Maintenance Accumulates
Understanding the causes matters as much as clearing the backlog. If the same conditions remain, the backlog will return within a few budget cycles.
- Operating budgets are cut first when finances tighten, and maintenance is easier to postpone than payroll.
- Failures that have not happened yet are easy to defer because nothing visible is wrong.
- Responsibility is split between operations and capital planning, so renewals fall between teams.
- Poor asset data hides how old and how close to failure key systems really are.
- Emergency repairs consume labor and funds that planned work needed.
- Leadership changes reset priorities and interrupt multi-year plans.
Warning signs in your own data
- Preventive maintenance completion that falls below target for several quarters.
- A rising share of reactive work orders.
- Equipment operating well beyond its expected service life.
- Repeated repairs on the same asset.
Assessment Detail: What to Capture Per Asset
| Data point | Why it is needed | Common problem |
|---|---|---|
| Asset identity and location | Links cost and history to the correct item | Duplicate or missing records |
| Install date and expected life | Estimates remaining life and renewal timing | Guessed or unknown ages |
| Condition rating | Separates urgent from monitoring items | Inconsistent scoring between assessors |
| Replacement or repair cost | Builds the backlog value and FCI | Outdated unit costs |
| Criticality | Weights the risk of failure | No agreed definition |
| Failure and repair history | Shows repeat problems and true reliability | History stored in paper or emails |
Rating scales only help if assessors apply them the same way. Calibrate on a few assets together before the full survey.
Building the Business Case for Capital
Arguments that tend to land with finance
- Cost of delay: small defects become larger repairs the longer they wait.
- Emergency premium: unplanned repairs cost more than scheduled ones.
- Insurance and compliance exposure tied to specific systems.
- Asset value protection and tenant or occupant retention.
Sequencing the Work Across 24 Months
- Close life-safety and code-related items.
- Address active water intrusion and envelope failures.
- Replace equipment at highest risk of imminent failure.
- Establish monthly burn-down reporting.
- Deliver packaged system renewals such as roofs and HVAC.
- Bundle energy-saving projects with related replacements.
- Reassess the remaining backlog and update costs.
- Re-measure FCI and reset the next cycle.
Execution practices that keep projects on track
- Name a single owner for each project package.
- Schedule work around occupancy and seasonal demand.
- Confirm parts lead times before committing dates.
- Close out each project with updated asset records.
Protecting the Gains: Preventive Maintenance Discipline
Backlog reduction without a prevention plan is temporary. Preventive and condition-based work keep systems from falling back into deferral.
- Build PM schedules from manufacturer guidance and your own failure history.
- Track PM compliance by building and trade every month.
- Treat overdue PM on critical assets as a priority, not a footnote.
- Use inspections to find small defects while they are cheap to fix.
- Reserve budget for lifecycle replacement so renewals are planned, not deferred.
Indicators that the program is working
- Reactive share of work orders declining.
- Backlog dollars falling faster than new items are added.
- Fewer repeat repairs on the same assets.
- PM completion rising and staying above target.
Reporting Progress to Stakeholders
Risks That Derail an FCI Turnaround
| Risk | How it shows up | Mitigation |
|---|---|---|
| Funding gets cut mid-program | Projects stall, backlog stops falling | Secure multi-year commitment and protect high-risk items first |
| Costs escalate | Estimates exceed budget before work starts | Include contingency and update estimates annually |
| Contractor capacity | Work cannot be scheduled on time | Package work and engage trades early |
| Occupied-building constraints | Access windows limit progress | Plan around occupancy and seasonal use |
| New failures | Unplanned items push backlog up | Hold reserve and strengthen PM |
| Data decay | Backlog list no longer matches reality | Update condition data as work closes |
Questions to ask at the quarterly review
- How much backlog did we close, and how much did we add?
- Are the highest-risk items still ahead of schedule?
- Has any asset condition changed enough to reprioritize?
- Is spending on pace with the approved funding profile?
- Which projects need a decision from leadership this quarter?
Roles and Responsibilities
Checklist: Is Your Organization Ready to Start?
- An executive sponsor has agreed that backlog reduction is a funded priority.
- Asset inventories exist, or there is a plan and budget to complete them.
- Replacement values are defined and agreed, so FCI is calculated consistently.
- A single system will hold backlog items, project status, and closeout records.
- Preventive maintenance schedules exist for critical systems.
- Procurement can support packaged projects and multi-year contracts.
- Reporting dates for leadership reviews are already on the calendar.
What to do if the answer is no
- If data is weak, spend the first quarter on condition assessment and asset records.
- If sponsorship is unclear, bring a short risk summary to leadership before starting.
- If procurement is slow, agree pre-qualified vendors for common trades.
- If PM is inconsistent, fix scheduling and completion tracking in parallel with the backlog work.
Typical categories in a deferred maintenance backlog
- Roofing and building envelope, including windows, sealants, and facades.
- Mechanical systems such as boilers, chillers, air handlers, and controls.
- Electrical distribution, switchgear, lighting, and emergency systems.
- Plumbing, water heating, and drainage.
- Fire protection and life-safety systems.
- Vertical transportation such as elevators and escalators.
- Interior finishes, flooring, and accessibility upgrades.
- Site work including paving, drainage, and parking structures.
Key Takeaways for Facility Leaders
- FCI falls only when net backlog falls, so track additions as carefully as closures.
- Rank every item by risk and consequence, not by who asked loudest.
- Package work by system and building to speed approval and procurement.
- Present funding options with the FCI result each would produce.
- Protect gains with preventive maintenance and lifecycle replacement reserves.
- Report to leadership quarterly using the same definitions every time.
Turn Backlog Into a Plan With a Finish Date
Organize assets, inspections, and corrective work in one system and measure your progress against a 24-month target.