Every facility team eventually faces the same budget question: which assets actually deserve a vibration sensor, an oil analysis contract, or a thermal imaging route, and which ones are fine on standard preventive maintenance? Get the answer wrong in one direction and you're paying for continuous monitoring on a backup exhaust fan nobody would notice failing. Get it wrong in the other direction and the chiller that keeps the whole building comfortable runs without any early warning at all. The difference in payback period between those two decisions isn't small — predictive maintenance on a genuinely critical asset typically pays back in months, while the same investment on a non-critical asset can take years or never break even, which is exactly why Start Free Trial ties PdM recommendations to documented criticality tiers rather than applying one policy plant-wide.
Predictive maintenance pays for itself fast on critical assets — and slowly, or never, on everything else
A criticality-driven ROI model tells you exactly which assets justify the sensor and analysis cost of predictive maintenance, and which are better served by a solid preventive schedule.
PdM isn't a technology decision — it's a criticality decision
Predictive maintenance sensors, gateways, and analysis subscriptions cost roughly the same whether they're monitoring an asset that would shut down production or one that would go unnoticed for a week. What changes is the value of the failure they prevent — and that's the number that determines payback.
Failure cost is where criticality tier does all the work in this formula — a critical asset's failure cost includes downtime impact and safety exposure, not just the repair invoice, which is why the same equation produces wildly different payback periods for a chiller versus a spare pump.
How payback period shifts by criticality tier
| Tier | Failure consequence | Typical PdM payback | Recommended investment |
|---|---|---|---|
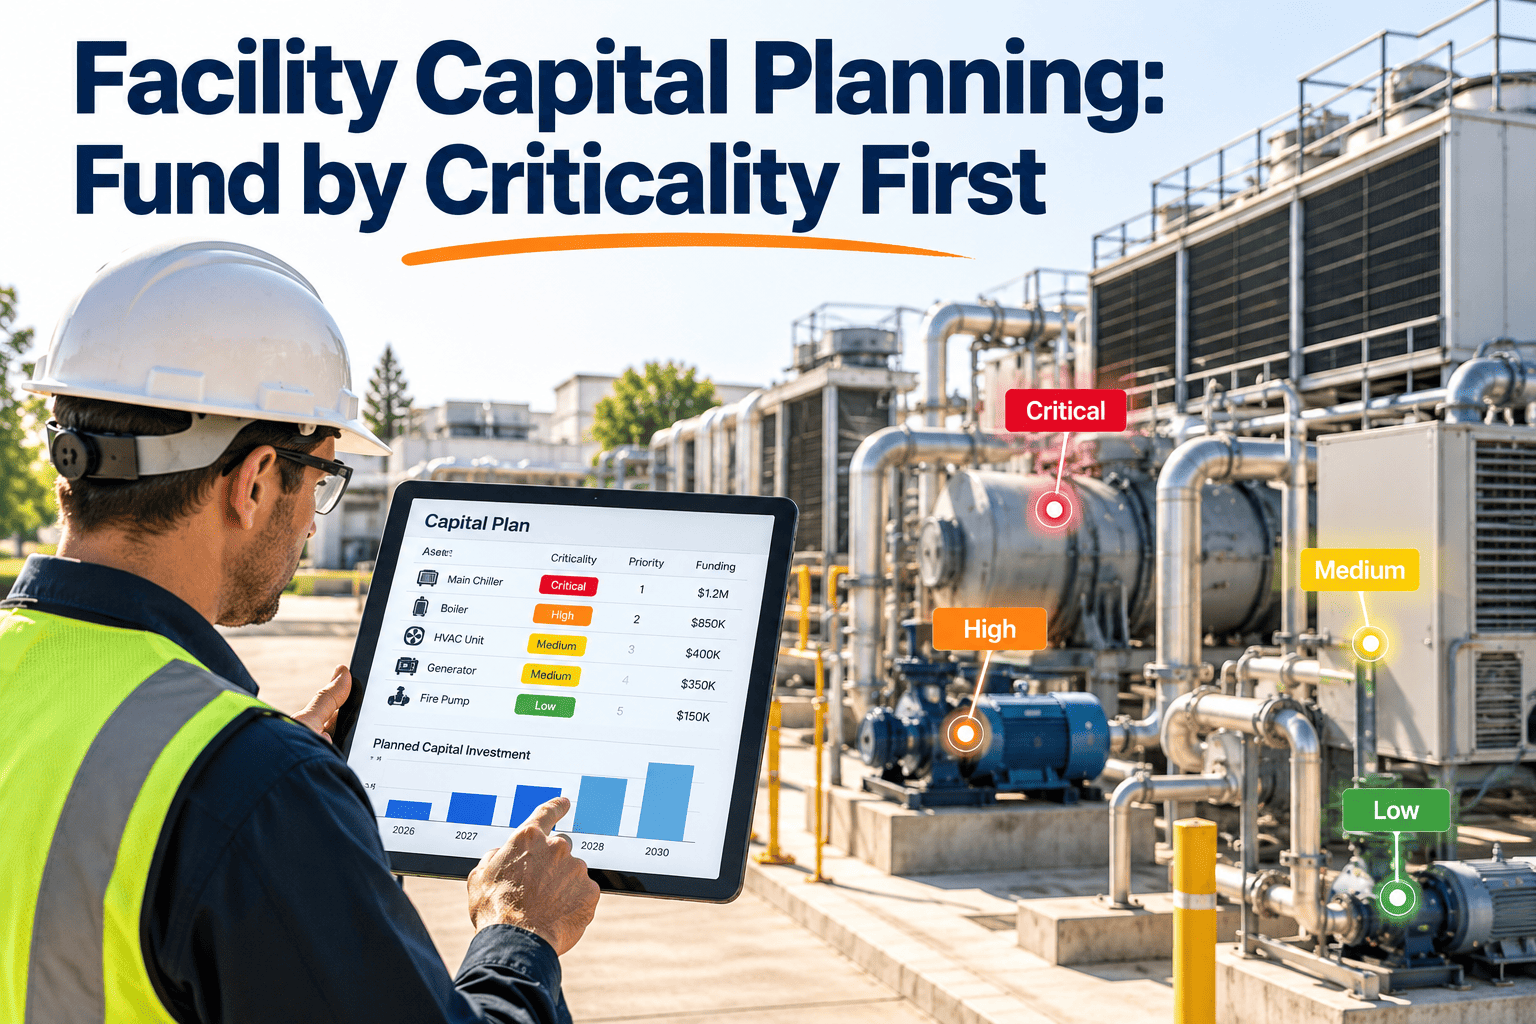
| Tier 1 — Critical | Production stop, life-safety impact, or facility-wide outage | 3–9 months | Continuous monitoring, full sensor suite, analysis contract |
| Tier 2 — Important | Localized disruption, redundancy absorbs some impact | 9–24 months | Periodic route-based monitoring (vibration, thermal, oil) |
| Tier 3 — Standard | Minor disruption, workaround available | 2–5 years, often marginal | Condition checks folded into existing PM rounds |
| Tier 4 — Non-critical | No meaningful operational impact if it fails | Rarely pays back | Run-to-failure or basic time-based PM only |
Should this asset get a PdM investment?
Does failure stop production, breach safety, or cause facility-wide impact?
Is there redundancy or a workaround that absorbs most of the impact?
Does the failure mode give measurable early warning through vibration, temperature, or oil condition?
Run the payback formula: does avoided failure cost clear the sensor and analysis cost inside 24 months?
An asset that fails "yes" on the first question, "no" on redundancy, and "yes" on detectable early warning is almost always a Tier 1 PdM candidate. An asset that fails the first question outright rarely needs to go further down the path.
Applying the model across one building's mechanical assets
A commercial office portfolio evaluates PdM spend across 40 major mechanical assets. The two central chillers — Tier 1, no redundancy, each failure costing an estimated $45,000 in emergency rental cooling and tenant disruption — justify a full vibration and oil analysis program with a projected 5-month payback. A bank of six rooftop package units with N+2 redundancy score Tier 2; the team adds quarterly vibration route checks instead of continuous sensors, with an 18-month payback. Twelve smaller exhaust fans with no operational consequence if one fails stay on basic PM with no PdM investment at all, since the formula never clears a reasonable payback threshold.
Where PdM investment decisions go wrong
Treating asset value as criticality
An expensive asset isn't automatically critical. A $200,000 backup generator that rarely runs may be less critical than a $4,000 pump with zero redundancy.
Ignoring redundancy in the payback math
Skipping the redundancy question inflates failure cost for assets that have a backup absorbing most of the operational impact, overstating PdM's payback.
Applying one PdM policy plant-wide
Buying the same sensor package for every rotating asset regardless of tier is how PdM programs end up costing more than the failures they prevent.
Skipping the detectability check
Some failure modes give no useful early warning through standard PdM signals. Investing in monitoring for those assets produces sensor data with no actionable lead time.
Run the PdM payback model against your own asset list
See how OxMaint ties criticality tiers to PdM recommendations and tracks avoided-failure value over time.
Connecting criticality, PdM investment, and ROI in one system
The payback formula only stays accurate if failure cost, avoided-failure count, and PdM spend live in the same place technicians log daily work — not in a one-time spreadsheet that goes stale after the first budget cycle.
Criticality-tiered asset register
Score and tag every asset by failure consequence and redundancy, driving PdM recommendations automatically by tier.
Condition-based work order triggers
Route vibration, thermal, and oil analysis findings directly into prioritized work orders for Tier 1 and Tier 2 assets.
Avoided-failure tracking
Log every PdM catch against the failure cost it prevented, building a running ROI number for leadership reporting.
Tier-based budget reporting
See PdM spend and payback broken out by criticality tier, so budget requests are backed by asset-level math, not averages.
Critical asset PdM ROI: frequently asked questions
What's a typical PdM payback period for a critical asset?
Genuinely Tier 1 assets — no redundancy, high consequence of failure — commonly pay back a full PdM program in 3 to 9 months. Lower-tier assets stretch well beyond that.
Should every critical asset get continuous monitoring?
Not necessarily. Continuous monitoring makes sense where the failure mode develops quickly; assets with slower-developing failure modes can be well served by periodic route-based checks at a fraction of the cost.
How is redundancy factored into the ROI calculation?
Redundancy reduces the effective failure cost used in the payback formula, since a backup asset absorbs part or all of the operational impact of a single failure.
Is it ever right to skip PdM entirely on a critical asset?
Yes, if the failure mode doesn't give measurable early warning through available signals. In that case, PdM sensors add cost without adding lead time, and resources are better spent on preventive tasks or spares readiness.
How do I build the criticality tiers this model relies on?
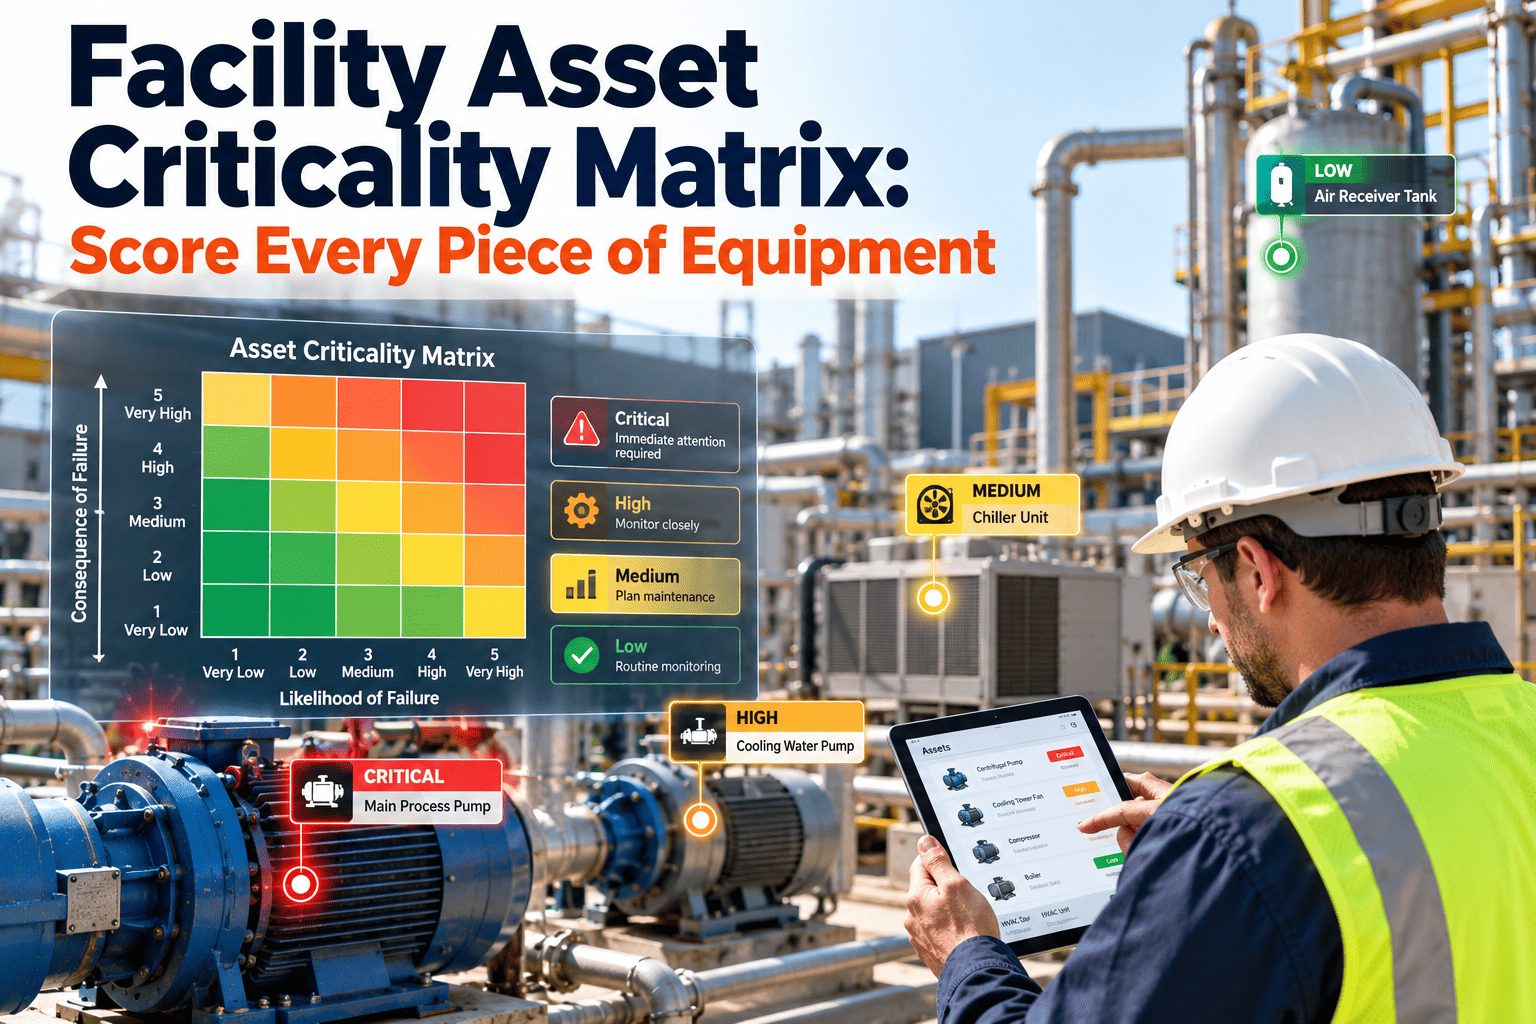
Score each asset on consequence of failure, redundancy, and detectability, then group the results into three or four tiers. Book a demo at calendly.com/oxmaintapp/30min to see the tiering workflow inside OxMaint.
Spend your PdM budget where it actually pays back
Tie predictive maintenance investment to documented criticality tiers instead of a flat plant-wide policy, and track the ROI as it accrues.