Facility maintenance teams collectively leave billions in recoverable savings untapped every year — not because budgets are too small, but because spending decisions are made without data. A 2023 Deloitte real estate operations study found that facilities relying on reactive maintenance spend 3 to 5 times more per asset event than those using data-driven preventive strategies. The gap between underfunded and overstretched budgets almost always comes down to visibility. OxMaint gives facility teams the analytics and asset intelligence to make every dollar count — shifting budgets from crisis management to planned, predictable cost control.
Financial Optimization · Facility Management
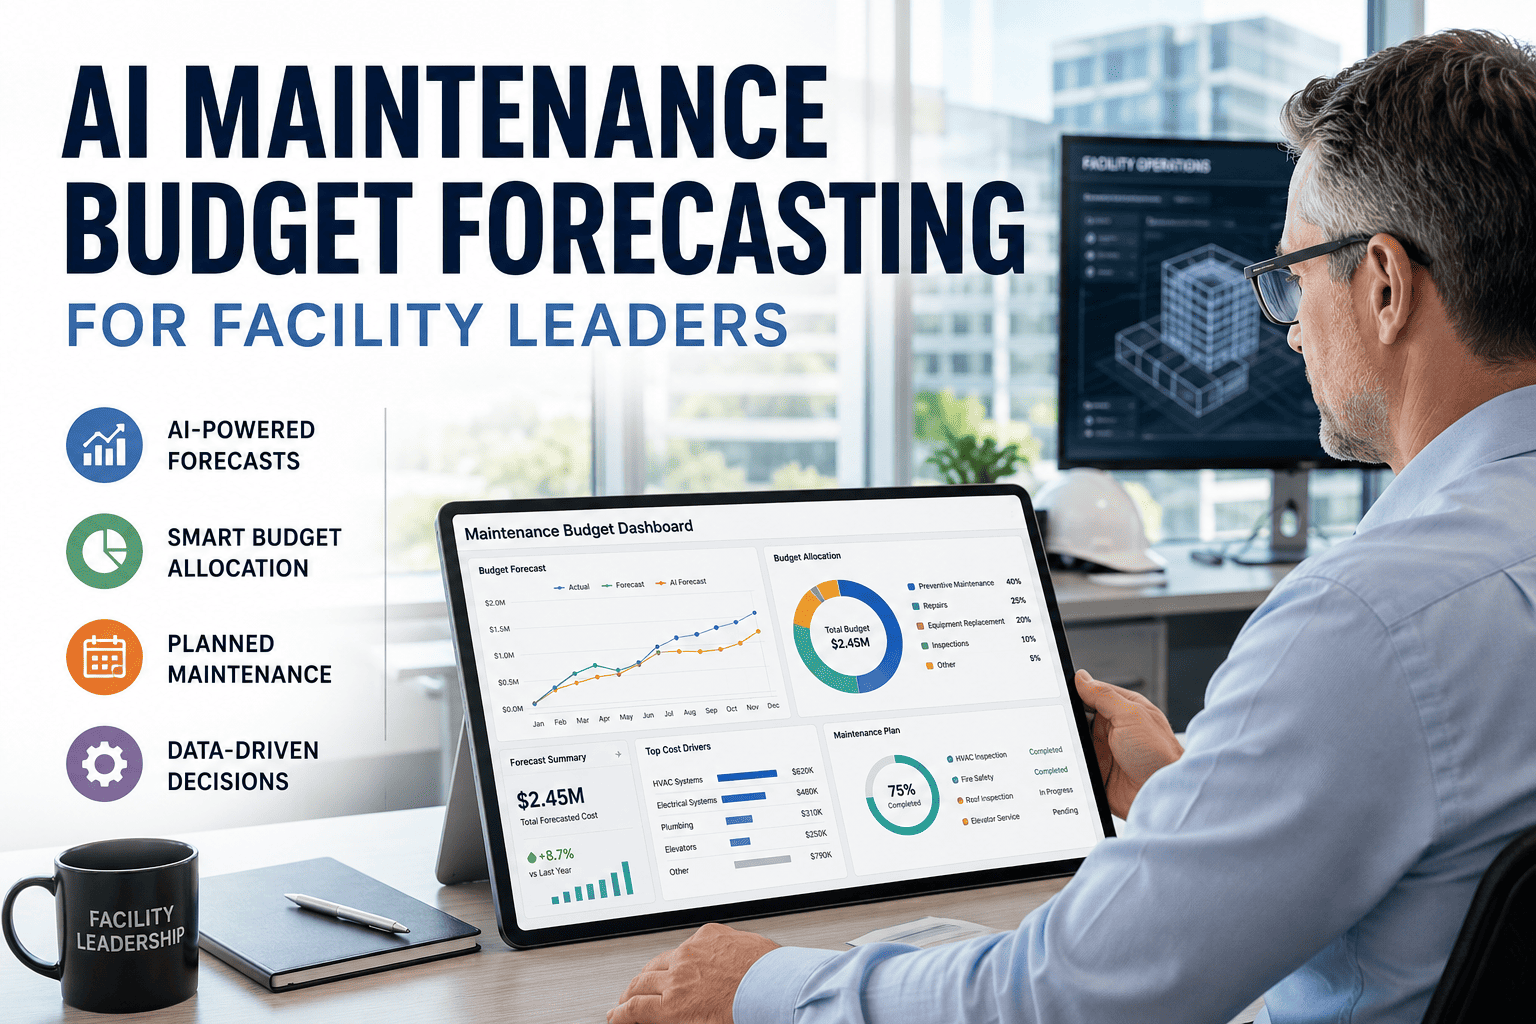
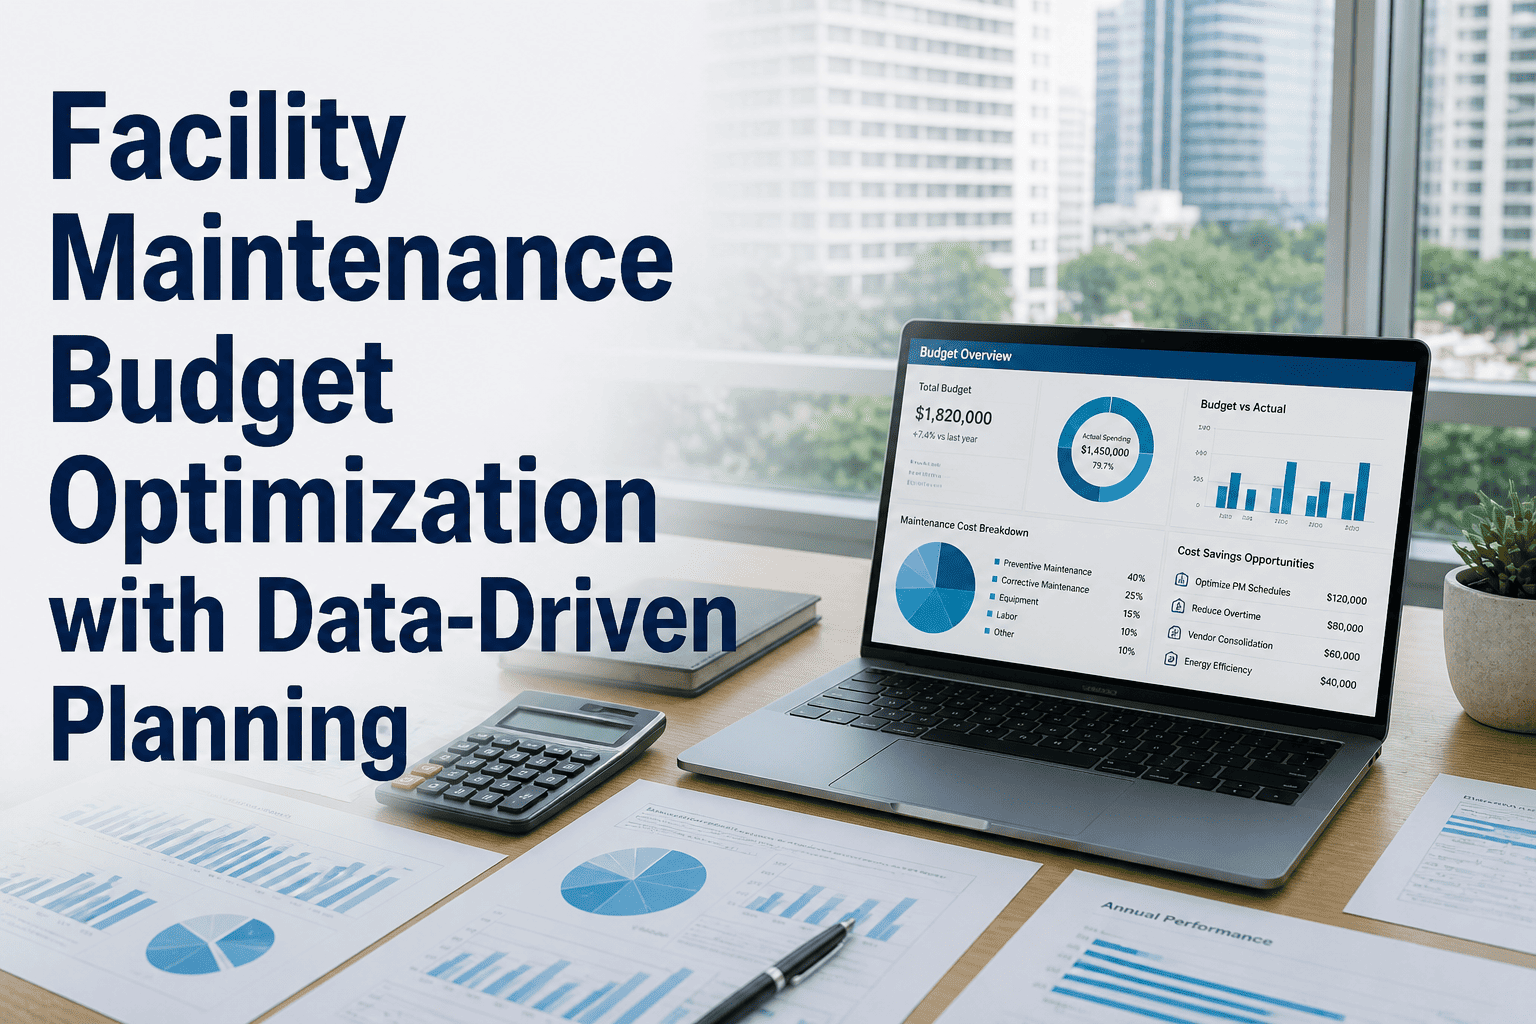
Facility Maintenance Budget Optimization with Data-Driven Planning
How Asset Risk Scoring, Cost Analytics, and CMMS Intelligence Cut Maintenance Spend Without Cutting Reliability
3-5x
Higher cost per event in reactive vs. preventive facilities
18%
Average maintenance budget reduction after CMMS analytics adoption
62%
Of deferred maintenance is on assets with no documented risk score
$0.40
Saved per dollar invested in planned preventive maintenance
The Core Problem
Budgets Built on Guesswork
Most facility budgets are built by adding 5-10% to last year's spend. Without asset condition data, historical cost trends, or risk scores, this method perpetuates inefficiency and makes it impossible to justify capital requests to finance teams.
Deferred Maintenance Accumulating Silently
When budgets are tight, teams defer repairs without tracking them. Deferred maintenance compounds — a $2,000 belt replacement ignored becomes a $14,000 motor failure six months later. Without a backlog register, this liability is invisible until it becomes a crisis.
No Visibility Into Asset-Level Spend
Without CMMS cost tracking at the asset level, facilities cannot identify which equipment consumes disproportionate budget, which vendor contracts underperform, or where preventive investment would eliminate costly reactive repairs.
Data-Driven Budget Planning Framework
1
Asset Risk Scoring
Assign each asset a risk score based on age, maintenance history, criticality to operations, and replacement cost. High-risk assets get priority budget allocation — not the loudest manager's request.
2
Historical Cost Analytics
Pull 12-24 months of labor, parts, and contractor costs per asset. Identify which equipment accounts for the top 20% of spend — the Pareto principle reliably applies in facility maintenance cost distribution.
3
Deferred Maintenance Register
Document every deferred repair with estimated cost, risk level, and consequence of continued deferral. This turns an invisible liability into a structured, prioritized investment case for finance leadership.
4
Preventive vs. Reactive Cost Modeling
Model the cost difference between current reactive spend and a fully implemented preventive schedule for your highest-risk assets. This calculation typically shows 25-40% total cost reduction and forms the ROI case for PM investment.
5
Budget Variance Tracking
Compare planned vs. actual spend monthly at the asset, system, and building level. Variance reports catch budget overruns early and allow reallocation before year-end deficits force emergency cuts.
Reactive vs. Preventive: Real Cost Comparison
| Asset Type | Reactive Repair Cost | PM Annual Cost | Downtime (Reactive) | Savings per Cycle |
|---|---|---|---|---|
| HVAC Chiller Unit | $18,000 - $45,000 | $3,200 / year | 48 - 96 hrs | Up to $41,800 |
| Elevator / Lift System | $8,500 - $22,000 | $2,400 / year | 12 - 36 hrs | Up to $19,600 |
| Electrical Switchgear | $12,000 - $30,000 | $1,800 / year | 24 - 72 hrs | Up to $28,200 |
| Boiler / Heating Plant | $9,000 - $25,000 | $2,600 / year | 18 - 48 hrs | Up to $22,400 |
| Roof Membrane System | $35,000 - $120,000 | $1,500 / year | Structural | Up to $118,500 |
Budget Allocation Model by Asset Risk
High Risk Assets
45%
Critical systems with high failure consequence — HVAC, electrical, elevators, fire suppression. Full PM schedules, condition-based monitoring, and capital replacement planning funded here first.
Medium Risk Assets
35%
Important but recoverable systems — plumbing, lighting, security systems. Regular PM intervals, vendor contract coverage, and parts inventory allocation.
Low Risk Assets
20%
Non-critical building elements — landscaping, interior finishes, minor fixtures. Reactive maintenance acceptable with basic inspection schedules.
See How OxMaint Analytics Builds Your Budget Case
Asset risk scores, cost breakdowns, deferred maintenance registers, and variance reports — all in one platform designed for facility teams, not IT departments.
Expert Review
"The single most impactful change a facility team can make is moving from calendar-based budget estimates to asset-risk-based cost modeling. When you can show finance exactly which assets are at risk, what deferral costs over 12 months, and what a PM program returns on investment, budget approval goes from a negotiation to a business case. CMMS platforms that deliver this analytics layer are the ones changing how facilities operate financially."
Mark Ellsworth
Senior Advisor, Facility Asset Management — APPA Leadership in Educational Facilities
Frequently Asked Questions
How do I build a deferred maintenance register if we have no existing documentation?
Start with a rapid asset walk-through using a mobile CMMS like OxMaint to photograph and log each asset's condition. Assign a preliminary condition score — good, fair, poor — and estimate repair cost for any asset in fair or poor condition. Even a rough register is dramatically more useful than no register. Most facilities can complete a first-pass deferred maintenance inventory for a 100,000 sq ft building in two to three days using mobile data collection. The goal is to make the liability visible, not to achieve accounting precision on day one.
What is asset risk scoring and how does it affect budget allocation?
Asset risk scoring combines three variables: probability of failure (based on age, maintenance history, and condition), consequence of failure (impact on operations, safety, and tenant experience), and replacement cost. Each asset receives a composite score that determines its budget priority. High-risk scores mean the asset gets funded first — regardless of which department manager is loudest in budget meetings. This method removes subjectivity from capital allocation and creates an auditable, defensible basis for every budget line item that finance and leadership can review and validate.
How does a CMMS platform help control maintenance budget variance?
A CMMS tracks every work order cost — labor hours, parts consumed, and contractor invoices — against the asset it was performed on. This creates a real-time cost ledger at the asset, system, and building level. Budget managers can pull monthly variance reports showing planned vs. actual spend, identify which assets are running over budget, and reallocate funds before deficits become critical. Book a demo to see how OxMaint's budget analytics dashboard gives facility directors this visibility in a single screen without manual spreadsheet reconciliation.
Can data-driven planning help justify budget increases to senior leadership?
Yes — and this is one of the most powerful applications of CMMS analytics. When you can present a deferred maintenance register with dollar values and risk consequences, a preventive vs. reactive cost model showing projected savings, and asset risk scores showing where failures are most likely, the budget conversation shifts from "we need more money" to "here is the business case for investing $X to avoid $Y in emergency repairs and downtime costs." Facilities with documented analytics consistently receive higher budget approvals because the investment logic is quantified and transparent rather than based on gut feeling or last year's actuals.
OxMaint · Analytics and Reporting
Stop Budgeting on Gut Feel. Start Planning on Asset Data.
OxMaint gives facility teams the cost analytics, risk scoring, and deferred maintenance tracking to build defensible budgets and eliminate surprise capital events. See it configured for your facility type.