Track & Improve Facility KPIs with CMMS Dashboards

By John Polus on April 2, 2026

track-improve-facility-management-kpis-cmms-dashboards

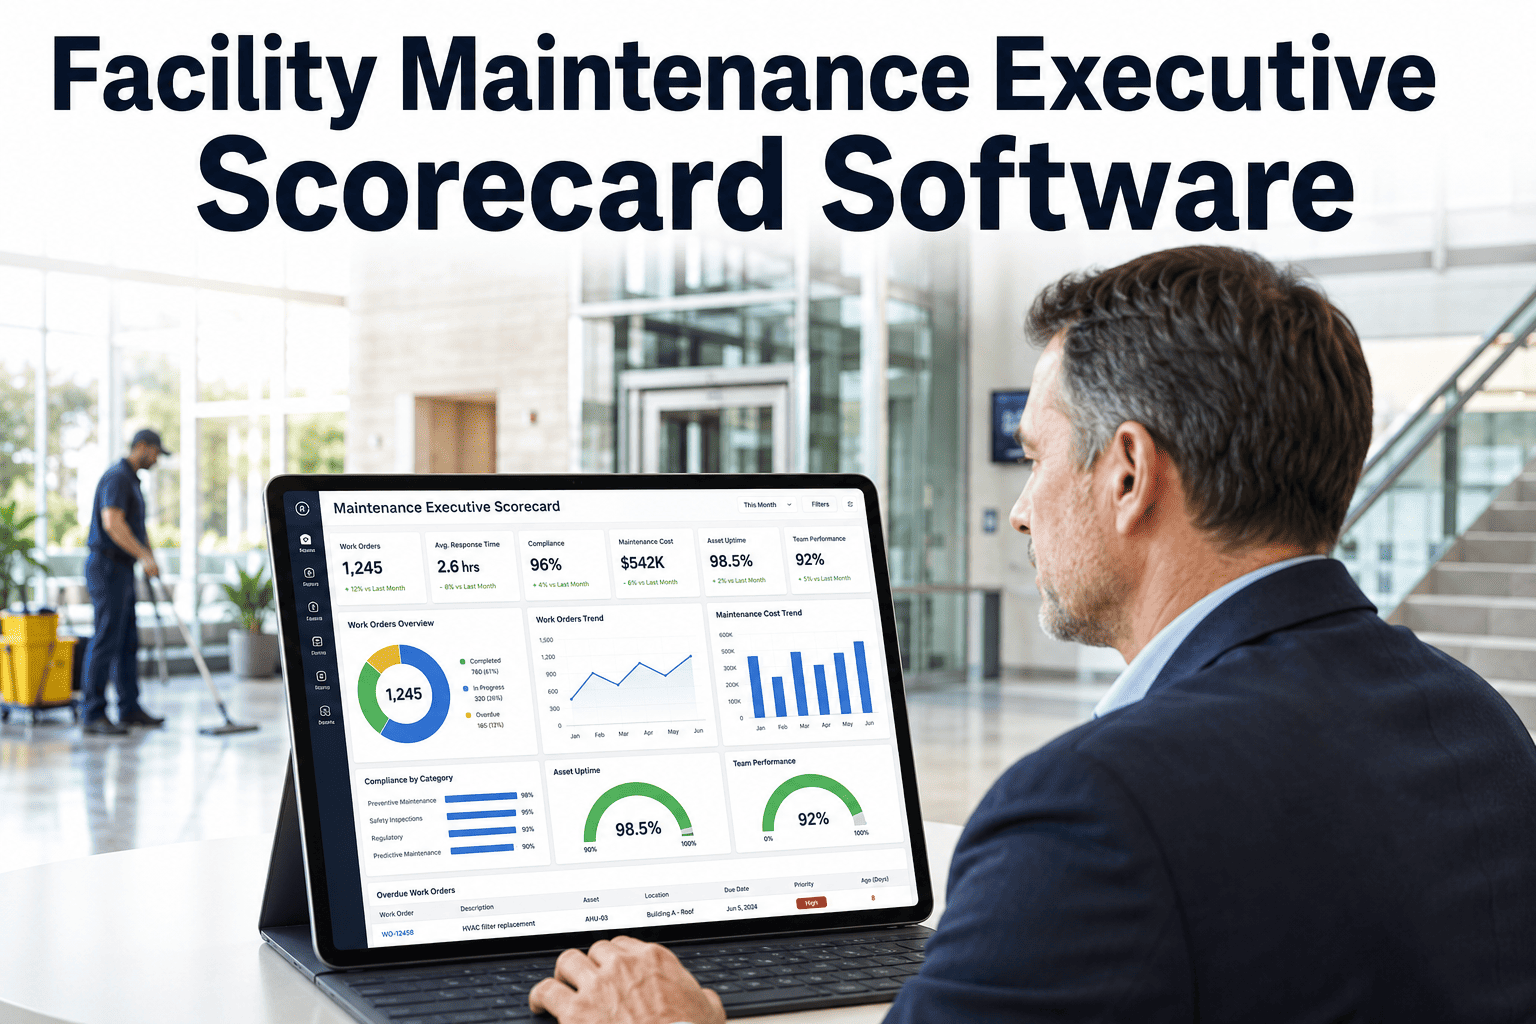
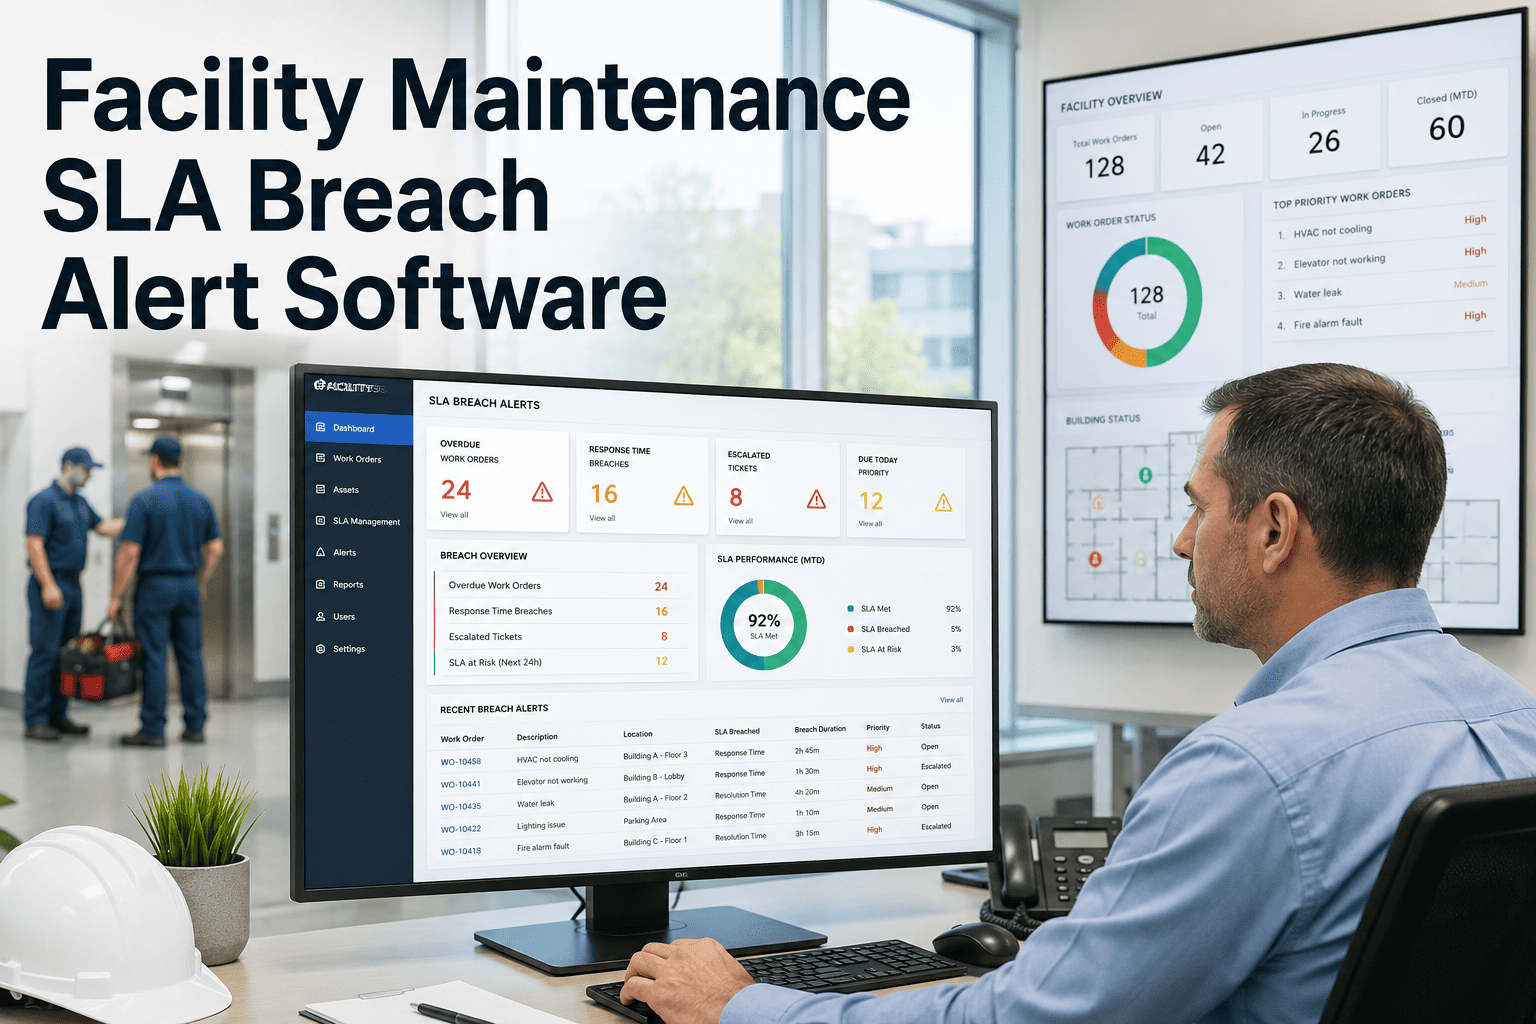
Most facility managers know their total maintenance budget. Few can answer — in under two minutes — which asset cost the most last quarter, which site is dragging down PM compliance, or what their MTTR was last month versus the industry benchmark. That gap between activity and insight is where operational budgets bleed. In the UAE, where Vision 2030 mandates digital FM documentation and transparent KPI reporting, facilities without live dashboards face audit exposure and contract risk. OxMaint delivers every metric in this guide — MTTR, MTBF, PM compliance, cost per square foot, planned vs reactive ratio, work order backlog, and technician productivity — live, on every device, from day one. Sign up free or book a demo to see your facility KPI dashboard configured and live.

75%
Reporting time reduction when BASF unified KPI dashboards across 300+ facilities — from weeks to hours
$500B
US facility maintenance backlog in 2024 — driven by reactive culture and no live KPI visibility (BOMA 2024)
4.8x
Cost multiplier for reactive vs planned repairs — the KPI gap that every PM compliance dashboard exposes
84%
PM compliance rate OxMaint customers reach within 12 months, from a typical 31-45% reactive baseline

Stop Managing by Intuition. Start Managing by Data.

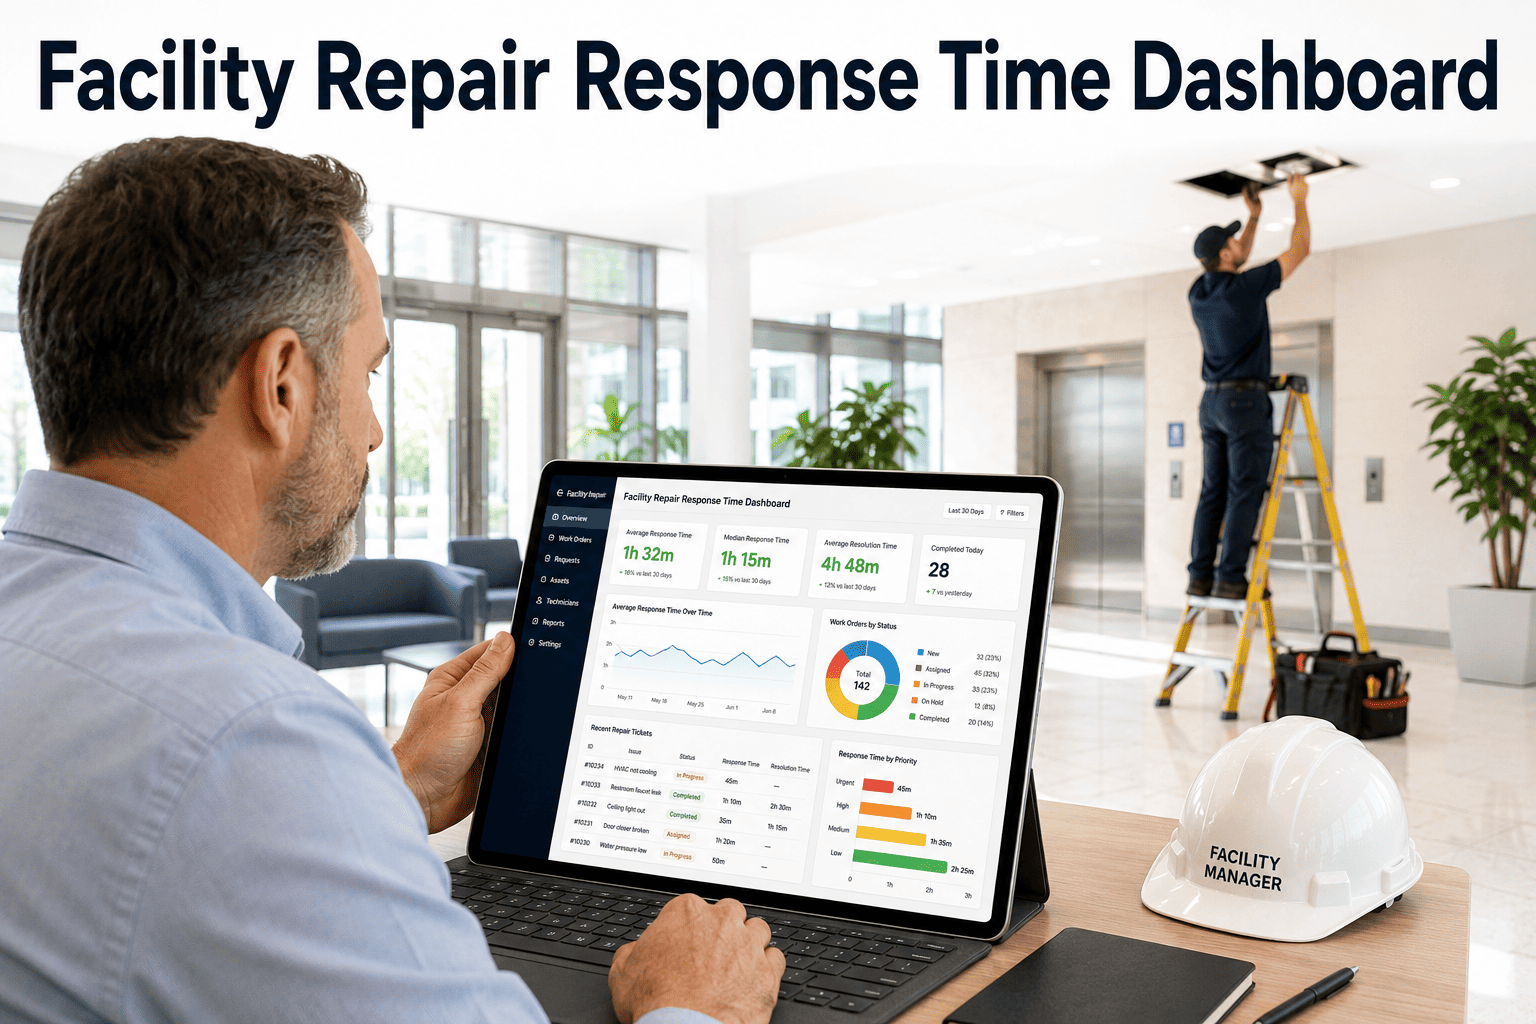
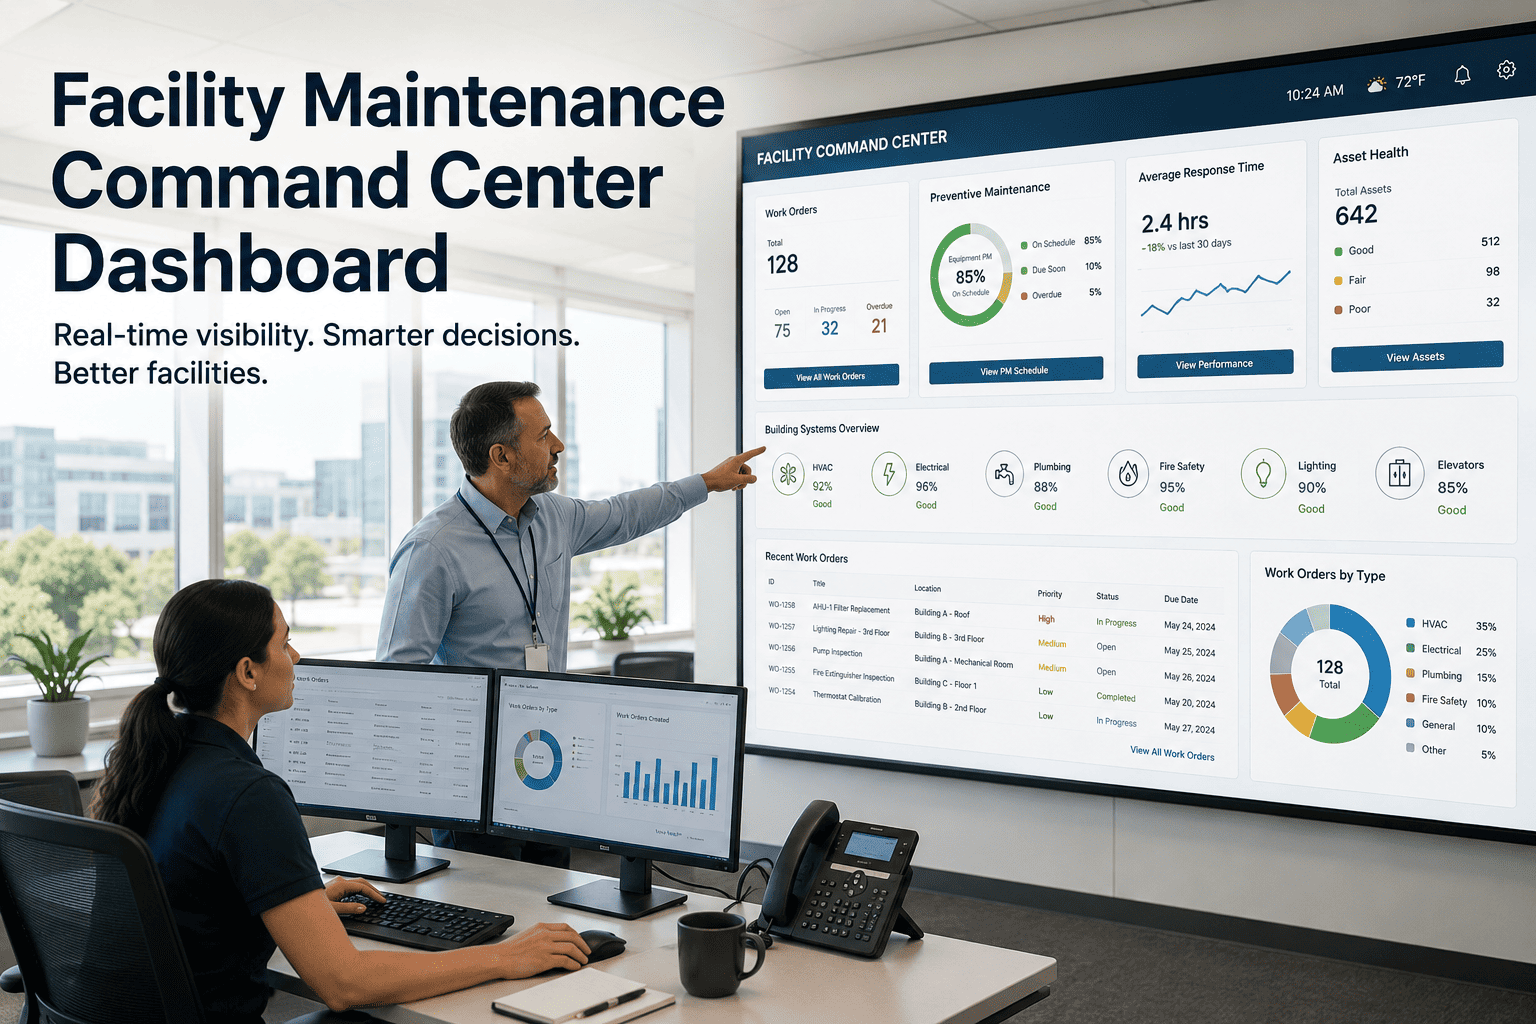
OxMaint gives US and UAE facility teams live dashboards tracking MTTR, MTBF, PM compliance, cost per sq ft, and work order backlog — no IT project, no implementation consultants, live in days.

The 8 Facility Management KPIs That Drive Real Decisions

Effective KPI management starts with choosing the right metrics. Not every data point in your CMMS is a KPI. These eight are the metrics that connect directly to cost control, asset reliability, compliance exposure, and operational performance across US and UAE facility portfolios.

Reliability
MTBF
Mean Time Between Failures
Total Uptime hours divided by Number of Failures
Rising MTBF confirms your PM program is working. Falling MTBF signals deferred maintenance accumulating into failure clusters. Track per asset, per line, and per site to identify the assets dragging down portfolio reliability.
World-class target: rising trend month-over-month. Reactive facilities: declining.
Response
MTTR
Mean Time To Repair
Total Repair Time divided by Number of Repairs
High MTTR reveals structural problems: missing parts, under-trained technicians, incomplete work order information, or slow contractor response. Every hour of extended downtime carries direct operational cost at $260,000 per hour average.
Manufacturing target: 1-6 hrs. Healthcare: under 15 min for critical. IT: 15-60 min.
Compliance
PM Rate
Preventive Maintenance Compliance Rate
PM Tasks Completed On Time divided by PM Tasks Scheduled, times 100
The single most powerful indicator of FM programme maturity. Every reactive repair costs 4.8x more than planned maintenance. Moving from 40% to 80% PM compliance effectively halves maintenance spend per event.
Best-in-class: above 90%. Reactive baseline: 31-45%. OxMaint customers: 84%+ in 12 months.
Cost
Cost/SqFt
Maintenance Cost Per Square Foot
Total Maintenance Spend divided by Total Managed Square Footage
The primary portfolio cost benchmark. Reactive programs run $3.00-$4.50 per sq ft annually. Structured PM programs reduce this to $2.10-$3.20. Track per building, per asset class, and per system to identify the sites driving portfolio cost above benchmark.
Reactive: $3.00-$4.50/sq ft. Proactive target: $2.10-$3.20/sq ft.
Efficiency
WO Completion
Work Order Completion Rate
Work Orders Closed On Time divided by Total Work Orders Raised, times 100
Measures daily execution quality. Low completion rates signal staffing bottlenecks, parts shortages, or work order assignment gaps. Track by technician, by building, and by work order type to distinguish systematic failures from one-off overloads.
Target: above 85% on-time completion. Below 70% signals systemic process gaps.
Planning
Backlog Rate
Maintenance Backlog Hours
Total Hours of Open Work Orders divided by Total Available Technician Hours
Rising backlog predicts a deteriorating PM compliance rate within 60-90 days. A healthy backlog is 2-4 weeks of work. Anything above 6 weeks indicates a structural resource or prioritization gap that will produce emergency failures if not corrected.
Healthy: 2-4 weeks. Critical warning: above 6 weeks backlog accumulation.
Performance
Planned Ratio
Planned vs Reactive Maintenance Ratio
Planned Work Orders divided by Total Work Orders, times 100
80% of US facilities still operate with reactive-dominant cultures. Best-in-class programs achieve 80-90% planned ratio. This metric directly controls total maintenance cost because every point of improvement removes high-cost emergency repairs from the budget.
Target: 80% or above. Industry average: 45-55% planned in reactive facilities.
Asset
MC/ERV
Maintenance Cost Relative to Replacement Value
Total Maintenance Costs divided by Estimated Replacement Value, times 100
Assets worth maintaining have MC/ERV below 6%. When MC/ERV exceeds 6-8%, replacement economics typically favour new asset procurement over continued maintenance. This metric drives evidence-based CapEx decisions and stops over-investing in assets past their useful life.
Maintain below 6% MC/ERV. Above 8% triggers replacement review. Above 12% is critical.

Track All 8 KPIs Live in OxMaint. No Manual Calculations. No End-of-Month Reports.

Every metric above is calculated automatically from live work order data and available on your dashboard before your morning shift starts. PM compliance, MTTR, cost per sq ft, backlog, planned ratio — all updating in real time as your technicians work.

How OxMaint Delivers Live KPI Dashboards: The 5-Stage Implementation Roadmap

OxMaint KPI dashboards do not require an IT project, a data warehouse, or a six-month implementation. The workflow below shows exactly how live KPI visibility is activated and what each stage delivers for US and UAE facility teams.

01
Asset Registry and Baseline Data Import
Import your existing asset register, set replacement values per asset for MC/ERV tracking, and configure the asset hierarchy (Portfolio, Property, System, Asset, Component). OxMaint's asset registry becomes the data foundation that every KPI is calculated against. Existing data from spreadsheets, legacy CMMS, or BAS exports into OxMaint in under 2 hours using standard CSV templates. Live in days, not months.
Outcome: Asset register live, baseline KPI calculation enabled
02
PM Schedule Activation and Work Order Automation
Configure preventive maintenance schedules per asset class from OxMaint's pre-built template library. Work orders generate and assign automatically on schedule. PM compliance rate tracking activates from the first scheduled work order. Every completed work order logs time, parts, and technician — automatically feeding MTTR, cost per sq ft, and work order completion rate dashboards without manual data entry.
Outcome: PM compliance tracking live, MTTR and WO completion calculating
03
IoT and Sensor Integration for Real-Time Condition Data
Connect BAS, SCADA, IoT sensors, and smart meters to OxMaint via REST API or OPC-UA. Sensor data feeds asset condition scores and triggers condition-based work orders automatically when thresholds are breached. MTBF tracking improves from historical calculation to real-time predictive flagging — showing which assets are trending toward failure weeks before breakdown occurs.
Outcome: MTBF real-time tracking, AI predictive alerts, condition-based WO generation
04
Role-Based Dashboard Configuration and Reporting Automation
Configure role-based KPI views for each user level: technicians see their work queue and completion rates, supervisors see site-level PM compliance and backlog, portfolio managers see cross-site KPI roll-ups. Scheduled reports auto-deliver to management by email on defined intervals — weekly PM compliance to operations, monthly cost per sq ft to finance, quarterly reliability trends to the board. No manual report compilation required.
Outcome: Every stakeholder gets their KPI view automatically — no manual reporting
05
CapEx Forecasting and Continuous Improvement Loop
Asset condition scores, MC/ERV ratios, and MTBF trend data feed OxMaint's rolling 5 to 10 year CapEx forecast model. Finance receives CFO-defensible capital budget documentation with Remaining Useful Life per asset — replacing annual guesswork with data-driven replacement timing. CapEx budget variance drops from the industry average of 40% to under 12%. The improvement loop closes: KPIs drive PM decisions, PM execution drives better KPIs, and better KPIs justify the next cycle of investment.
Outcome: CapEx variance below 12%, evidence-based replacement planning, board-ready reporting

OxMaint vs Competitors: KPI Dashboard Feature Comparison

Not every CMMS delivers the same depth of KPI tracking. The comparison below covers the metrics and dashboard capabilities that matter most for US and UAE facility teams making CMMS investment decisions in 2026.

Swipe left to compare all platforms
KPI Dashboard Feature OxMaint MaintainX UpKeep Fiix (Rockwell) Limble CMMS IBM Maximo Hippo/Eptura Cryotos eMaint
Live MTBF and MTTR Dashboards Live, auto-calculated per asset Available with IoT add-on Basic, requires integration Available (paid tier) Available Full (enterprise cost) Limited Available Available (paid)
PM Compliance Rate Tracking Live, by site, asset, technician Available Available Available Available Full Basic Available Available
Cost Per Square Foot Analytics Automatic per building and portfolio Manual calculation required Not included standard Custom reports needed Available Full (complex setup) Not standard Limited Available
CapEx Forecasting from Condition Data Rolling 5-10 yr, auto-calculated Not included Not included Not included Not included Available (add-on) Not included Not included Basic
Multi-Site Portfolio Roll-Up Dashboard Unlimited sites, live cross-site view Available (paid tier) Limited multi-site Available (paid) Available Full (enterprise) Limited Available Available
AI Predictive Maintenance Alerts Built-in AI, IoT + sensor triggers IoT integration, no native AI Sensor alerts only Condition rules, no AI Rule-based alerts Full AI (enterprise) Basic alerts Available Condition monitoring
Scheduled Auto-Email KPI Reports Daily, weekly, monthly to any recipient Available Available Available Available Full Manual export Available Available
Implementation to Live KPIs Days, no IT project required 1-3 weeks 1-3 weeks 2-6 weeks 1-4 weeks 6-18 months 2-6 weeks 1-3 weeks 2-4 weeks

Regional Compliance and KPI Standards: US, UAE, UK, Canada, Europe

Facility KPI requirements are not uniform. Compliance frameworks in the US and UAE — OxMaint's primary markets — mandate specific documentation, reporting, and performance standards that live dashboards must support.

Swipe left to see all regions
Region Compliance Frameworks Key KPI Requirements Penalty Exposure OxMaint Coverage
USA Primary OSHA 1910 general industry, ADA Section 504, ASHRAE 55 and 90.1, NFPA 1 and 101, Joint Commission (healthcare), BOMA standards PM completion evidence per asset, MTTR below SLA thresholds, inspection records per OSHA interval, energy use per ASHRAE 90.1 OSHA: up to $156,259 per violation per day. ADA: $75,000-$150,000. Joint Commission: facility closure risk. OSHA-tagged PM records, ADA inspection scheduling, ASHRAE energy tracking, Joint Commission audit export in under 5 min
UAE Primary UAE IS2030, DEWA facility regulations, Civil Defence Code, Trakhees standards, Abu Dhabi HAAD (healthcare), ADNOC HSE (industrial) Digital PM documentation mandatory under IS2030, DEWA asset inspection intervals, Civil Defence fire safety PM logs, HSE performance KPIs IS2030 non-compliance: operating licence suspension. DEWA violations: service disconnection. Civil Defence: facility shutdown. IS2030-ready digital PM records, DEWA compliance dashboard, Civil Defence inspection scheduling, Arabic-language interface for field teams
UK Building Safety Act 2022, PSSR, PUWER, HSE L8 Legionella, NHS SHTM standards, EPC B target by 2030 Statutory inspection records per PSSR and PUWER intervals, L8 legionella monitoring logs, BSA safety case evidence, EPC energy performance tracking PSSR violation: unlimited fine plus criminal liability. BSA: up to GBP 2 million per breach. HSE enforcement notices: mandatory remediation. BSA-aligned safety case documentation, PSSR and PUWER statutory PM scheduling, L8 monitoring logs, EPC energy tracking per building
Canada Provincial OHS Acts, CSA standards, NBC building code, BOMA BESt certification, ESG disclosure (OSFI guidelines), LEED maintenance requirements OHS inspection records per provincial intervals, BOMA BESt energy and water KPIs, ESG maintenance evidence for OSFI compliance, LEED O+M documentation OHS violations: CAD 100,000-$1,500,000 per incident. BOMA BESt recertification risk. OSFI ESG: investor disclosure liability. Provincial OHS PM scheduling, BOMA BESt energy and water KPI dashboards, ESG reporting export, LEED O+M work order documentation
Europe EU Energy Efficiency Directive (EED), EPBD recast, EU Taxonomy (Regulation 2020/852), BetrSichV (Germany), DGUV regulations, ISO 45001 and ISO 55001 PUE and WUE reporting (EED), EPBD energy performance documentation, ISO 55001 asset management evidence, BetrSichV equipment inspection records EED non-reporting: EUR 50,000-500,000 per year. EPBD: building transaction restrictions. BetrSichV: criminal liability for responsible managers. EU EED PUE and WUE tracking, EPBD energy dashboard, ISO 55001 asset management reports, BetrSichV statutory PM scheduling, multi-language interface

OxMaint Generates OSHA, IS2030, BSA, and EU EED Compliance Documentation Automatically.

Every maintenance task on a compliance-relevant asset generates a timestamped, audit-ready record tagged to the applicable regulatory framework. Audit preparation drops from 2-4 weeks to under 5 minutes for any regulatory inspection in the US, UAE, UK, Canada, or Europe.

Real Client Results: What OxMaint KPI Dashboards Deliver

These outcomes are documented from OxMaint facility deployments across US and UAE commercial and industrial portfolios. Starting conditions were typical reactive-culture operations with spreadsheet-based PM tracking and no live KPI visibility.

84%
PM Compliance Rate
OxMaint customers reach 84 percent PM compliance within 12 months from a typical starting point of 31 to 45 percent in reactive operations. Automated scheduling, mobile work order dispatch, and real-time compliance dashboards drive this improvement without adding headcount.
From: 31-45% reactive baseline. To: 84%+ in 12 months.
68%
Unplanned Downtime Reduction
68 percent reduction in unplanned downtime incidents within 12 months of OxMaint deployment. AI predictive alerts identify developing failures 2 to 8 weeks before breakdown. Condition-based work orders replace the calendar-based schedules that miss failures between service intervals.
From: 4-8 unplanned incidents per month. To: 1-2 within 12 months.
40%
Maintenance Backlog Reduction
Work order backlog reduced by over 40 percent in year one through automated assignment, mobile technician dispatch, and real-time backlog dashboards that surface overdue tasks to supervisors before they compound.
From: 8-12 week backlog. To: 2-4 week healthy backlog in year one.
12%
CapEx Budget Variance
CapEx budget variance drops from the 40 percent industry average to under 12 percent when replacement decisions are driven by condition data and MC/ERV ratios rather than fixed depreciation schedules.
From: 40% CapEx variance (industry avg). To: below 12% with OxMaint.
30%
Total Maintenance Cost Reduction
30 to 45 percent total maintenance cost reduction documented within 12 months. Cost per sq ft drops from the $3.00 to $4.50 reactive baseline toward the $2.10 to $3.20 proactive target as planned ratio improves and emergency repair premiums are eliminated.
Average saving: $0.90-$1.80 per sq ft annually against reactive baseline.
5 min
Compliance Audit Preparation
Regulatory audit preparation time drops from 2 to 4 weeks of manual record assembly to under 5 minutes. Every completed work order generates a compliance record automatically. OSHA logs, IS2030 digital PM records, and BSA safety case evidence export on demand.
From: 2-4 weeks manual audit prep. To: under 5 minutes export.

Continue Reading

Connected guides in the OxMaint facility management knowledge base.

Your KPI Dashboard Is Ready. Your Facility Data Is Not Waiting for You to Start.

Every day without live KPI visibility is another day where emergency repairs are accumulating, PM compliance is degrading, and CapEx is being decided on guesswork. OxMaint makes your first live KPI dashboard available within days of account activation. Free to start.

Frequently Asked Questions

QHow does OxMaint calculate MTBF and MTTR automatically without manual data entry?
OxMaint calculates MTBF and MTTR directly from work order timestamps. Failure start time and work order close time log automatically when technicians update status on mobile. No manual calculation or spreadsheet step required. Sign up free to activate reliability tracking, or book a demo to see live MTBF and MTTR dashboards.
QCan OxMaint generate UAE IS2030 and DEWA compliance KPI documentation automatically?
Yes. Every completed PM task on an IS2030 or DEWA-relevant asset generates a timestamped digital record. KPI reports including PM compliance rate and maintenance history export in IS2030-ready format in under 5 minutes. Book a demo to see UAE compliance configuration, or sign up free today.
QHow long does it take to go from account activation to live KPI dashboards in OxMaint?
PM compliance and work order completion rate dashboards are live within the first day of account activation. MTBF and MTTR tracking builds within the first 30 days as work orders complete and create the historical data pool. Sign up free to start building your KPI baseline today, or book a demo for a guided setup walkthrough.
QDoes OxMaint support multi-site KPI benchmarking across US and UAE facilities in the same portfolio?
Yes. Portfolio managers see KPI roll-ups across every site simultaneously: PM compliance by site, cost per sq ft by property class, and MTTR by building. Sites in the US and UAE operate under their respective compliance frameworks within the same portfolio dashboard. Book a demo for a portfolio-specific walkthrough or sign up free to configure your portfolio view.

From Reactive Firefighting to Data-Driven Facility Management. OxMaint Makes It Operational from Day One.

Live MTBF, MTTR, PM compliance, cost per sq ft, backlog, and planned ratio dashboards. AI predictive maintenance. Automated compliance documentation for US, UAE, UK, Canada, and Europe. 5-year CapEx forecasting. All in one platform. Free to start. Measurable results within 90 days.


Share This Story, Choose Your Platform!