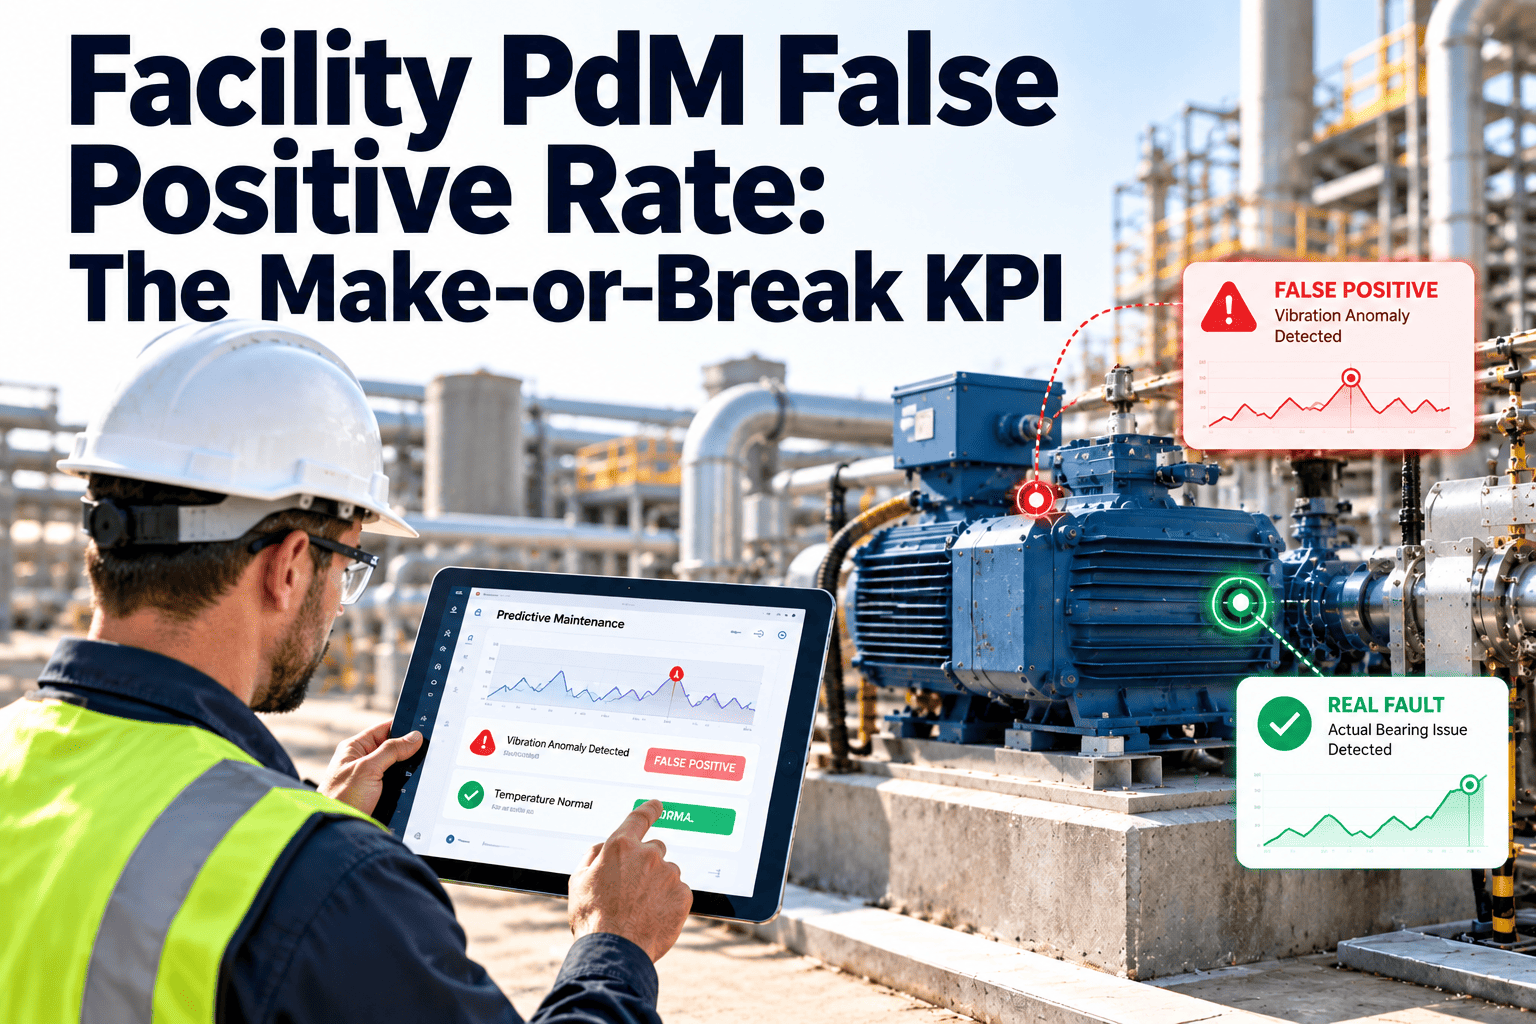
Every predictive maintenance program eventually faces the same test: when an alert fires, does the technician believe it? Missed failures hurt, but a steady stream of alerts that lead to nothing hurts the program faster, because crews quietly stop opening them. False positive rate is the KPI that shows whether alerts still deserve attention. This guide covers how to define it, measure it in line with SMRP-style metric discipline, set realistic targets, and run a monthly tuning cycle, plus how a maintenance management platform can track every alert from trigger to outcome.
Facility PdM False Positive Rate: The Make-or-Break KPI
Alert accuracy decides whether technicians act on predictive maintenance or ignore it. Measure it, set a target, and tune it every month.
Why False Positives Decide Whether PdM Survives
A predictive maintenance program does not fail on a single bad alert. It fails through a slow loss of trust, and the loop below is how it usually happens in facilities.
Alert fires
Technician inspects
Nothing found
Trust drops
Real fault missed
The cost is not only labor
- Wasted technician hours on inspections that produce no repair.
- Disrupted occupied spaces when equipment is taken offline for a check.
- Lost credibility with finance when the program cannot show avoided failures.
- Alert fatigue, which makes true positives easier to overlook.
Two Ways to Count a False Positive
Teams often argue about the number because they are measuring different things. Pick one definition, write it down, and report it the same way every month.
| Metric | Formula | Question it answers |
|---|---|---|
| Alert false positive rate | Non-actionable alerts divided by total alerts | How often does an alert waste a technician's time? |
| Alert precision | Actionable alerts divided by total alerts | How much can the crew trust an alert? |
| Classic false positive rate | False alarms divided by all healthy inspection windows | How often is healthy equipment flagged? |
| Missed detection rate | Failures with no prior alert divided by all failures | What are we failing to catch? |
Never track it alone
Tighten thresholds
Loosen thresholds
This is why a false positive target should always be paired with a missed detection or lead time measure. A program with a perfect false positive rate and no detections is not accurate, it is silent.
Measurement Method: Disposition Every Alert
You cannot calculate a rate without a clear outcome on every alert. The fix is a short, fixed list of disposition codes that technicians select when closing the work order.
| Disposition code | Meaning | Counts as false positive? |
|---|---|---|
| Confirmed, repaired | Fault verified and corrected | No |
| Confirmed, monitor | Early-stage condition, watch list created | No |
| No fault found | Inspection showed normal condition | Yes |
| Sensor or data fault | Bad reading, drift, or lost signal | Yes, but tracked separately |
| Duplicate | Same condition already open on another alert | Yes, but tracked separately |
| Operational cause | Alert explained by a schedule or load change | Yes, feeds rule tuning |
Rules that keep the number honest
- Disposition is mandatory before a PdM work order can close.
- Free-text notes explain the finding, but the code drives the metric.
- Review by asset class, not only as one portfolio average.
- Separate sensor faults from model faults, because they have different owners.
- Audit a small sample of closed alerts each month for coding accuracy.
Worked Example: Tuning Without Going Blind
The numbers below are illustrative, built to show the arithmetic rather than to represent any specific site.
What the example teaches
- A lower rate with fewer actionable alerts needs scrutiny, not applause.
- Total alert volume is a useful companion measure alongside the rate.
- Every threshold change should be logged with a date, so effects can be traced.
Root Causes: Where False Alerts Come From
Reducing false positives starts with sorting causes into three buckets, because each bucket has a different owner and a different fix.
- Sensor drift or loose mounting
- Gaps from lost communication
- Uncalibrated or mislabelled points
- Different units across systems
- Static thresholds on variable loads
- No seasonal or weather adjustment
- Startup transients treated as faults
- Duplicate rules on one condition
- Vague alert descriptions
- No disposition coding
- Alerts routed to the wrong team
- No feedback to the rule owner
Typical False Alarm Sources by Facility Asset
Commercial buildings have variable loads, occupancy swings, and weather, so a rule that looks fine in a lab often misfires in the field.
| Asset | Common false alarm trigger | Practical correction |
|---|---|---|
| Air handling unit | Fan vibration changes as the drive varies speed | Evaluate readings against speed bands, not one fixed limit |
| Chiller | Approach temperature shifts with load and outdoor conditions | Compare at similar load and weather, not across all hours |
| Pump | Motor current spikes during startup | Mask a defined startup window before evaluating |
| Boiler | Stack temperature moves with seasonal firing rates | Use season-specific baselines |
| Cooling tower | Basin level swings during makeup cycles | Alert on sustained deviation, not momentary readings |
| Elevator or door system | Cycle counts spike on busy event days | Normalize by usage, not calendar time |
Know Your Alert Accuracy Before Your Crew Stops Trusting It
Setting Targets by Program Maturity
There is no single published false positive limit that fits every facility. Treat the figures below as practical starting points to adapt, then adjust them based on asset criticality and crew capacity.
Baseline: first 60 to 90 days
Stabilize: months 4 to 6
Improve: months 7 to 12
Mature: ongoing
Match the target to criticality
- Life safety and critical cooling assets can tolerate more false alerts than lower-risk equipment.
- Low-consequence assets should use stricter rules, because a missed alert costs little.
- Set targets per asset class, then roll up to a portfolio view.
The Monthly Tuning Cycle
Accuracy is not a one-time setup. A short, repeatable review keeps rules aligned with how the building actually behaves.
Pull the numbers
Rank the noisiest rules
Diagnose the cause
Change one thing
Check for missed faults
Log and share
Before and After: Tracked vs Untracked Alerts
- Alerts live in a dashboard separate from work orders.
- Outcomes are remembered, not recorded.
- Arguments about accuracy rely on opinion.
- Rules are changed when someone complains.
- Technicians learn to ignore the noisiest sources.
- Every alert becomes a work order with an outcome code.
- Accuracy is reported by asset class and rule.
- Tuning targets the biggest sources of noise first.
- Changes are logged and their effect measured.
- Technician feedback visibly improves the system.
Companion KPIs That Keep the Rate Honest
False positive rate is the headline, but it needs a small group of supporting measures to be interpreted correctly.
How Oxmaint Supports Alert Accuracy Tracking
Oxmaint is a maintenance management platform, so its value here is closing the loop between a condition alert and the work that follows.
Quick Audit: Is Your PdM Alert Process Ready?
- A written definition of false positive rate exists and is used consistently.
- Every PdM alert creates a record with an owner.
- Disposition codes are mandatory at closeout.
- Sensor faults and duplicates are reported separately.
- Accuracy is reviewed monthly by asset class.
- Rule changes are logged with date and reason.
- Missed failures are reviewed alongside false alarms.
- Technicians receive feedback on what changed.