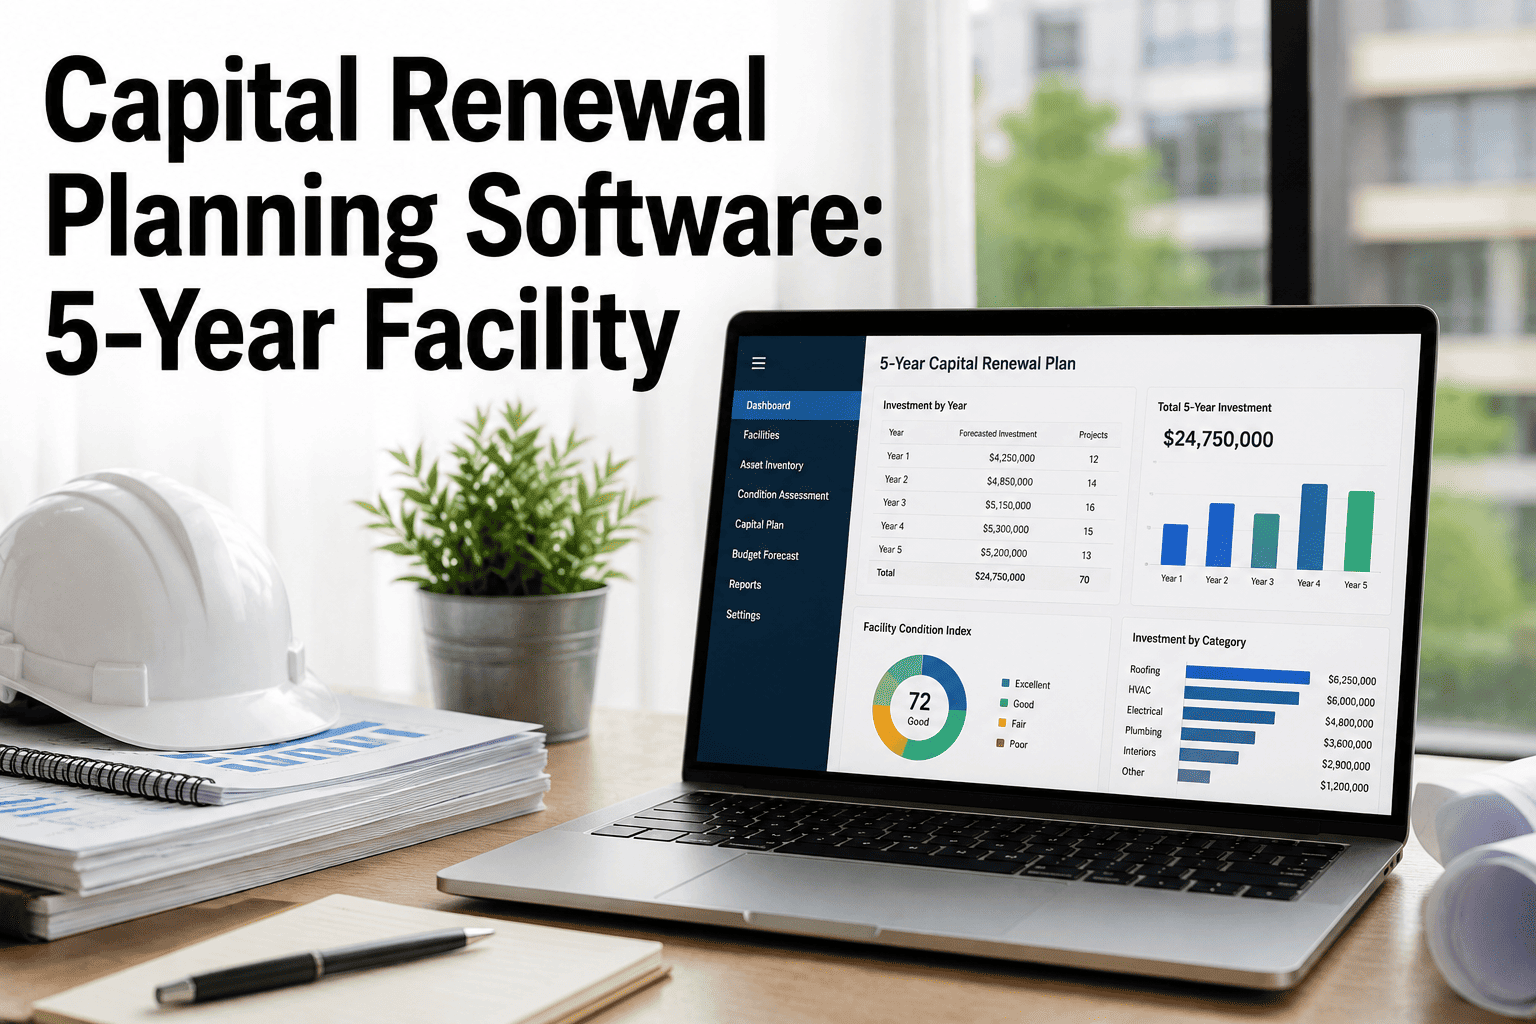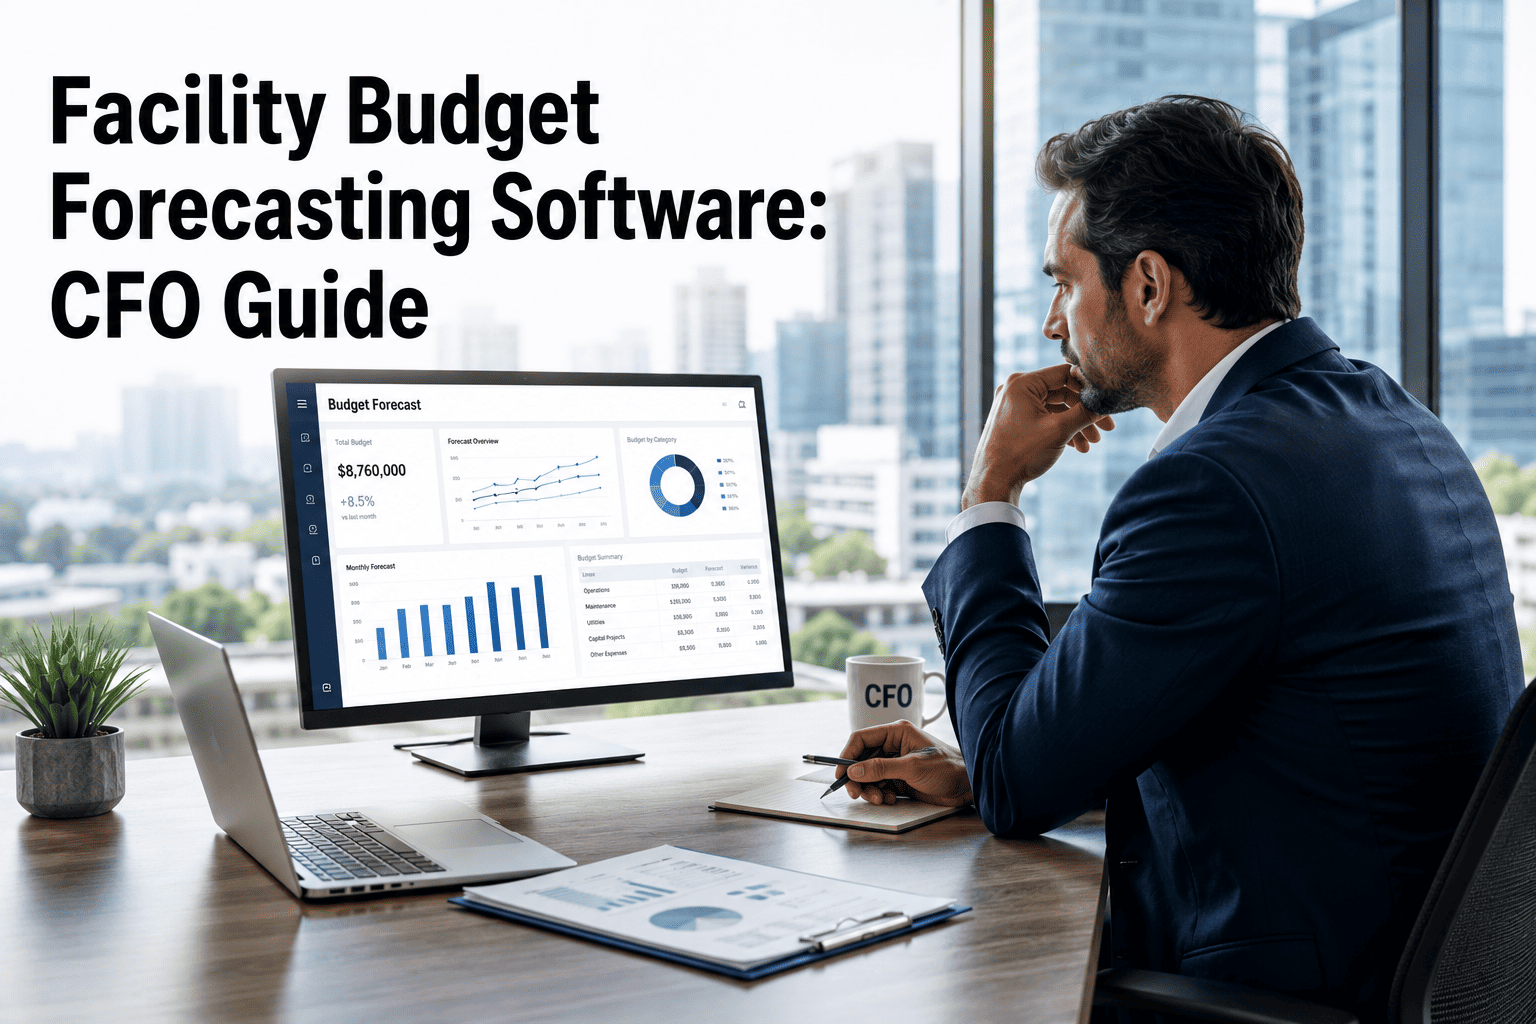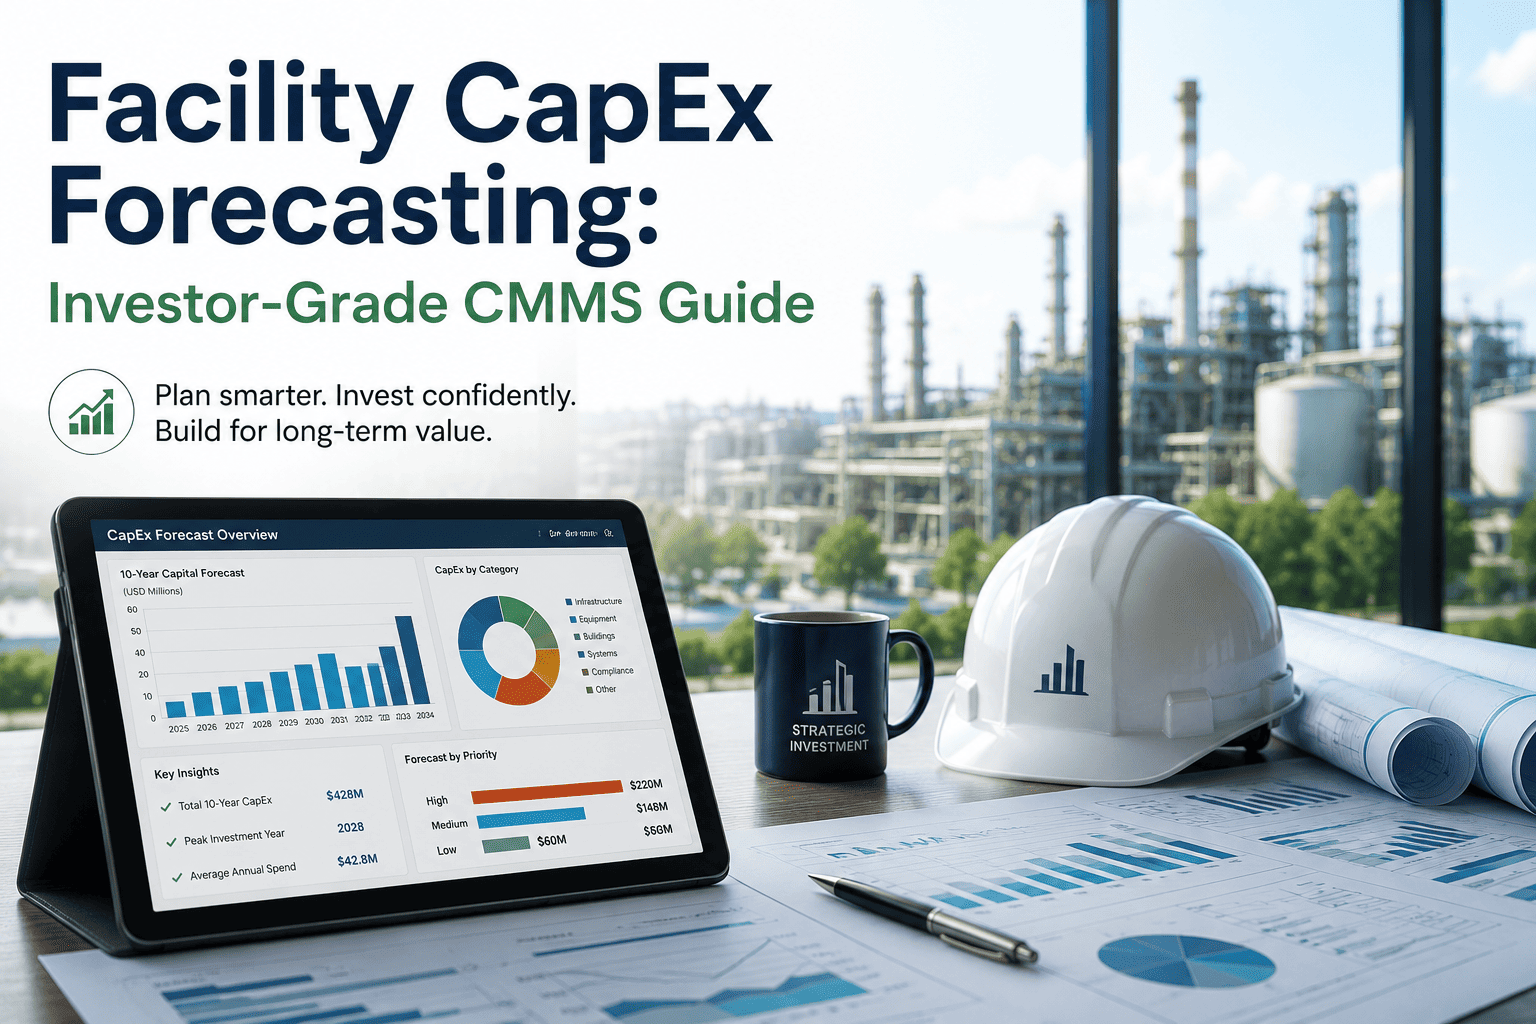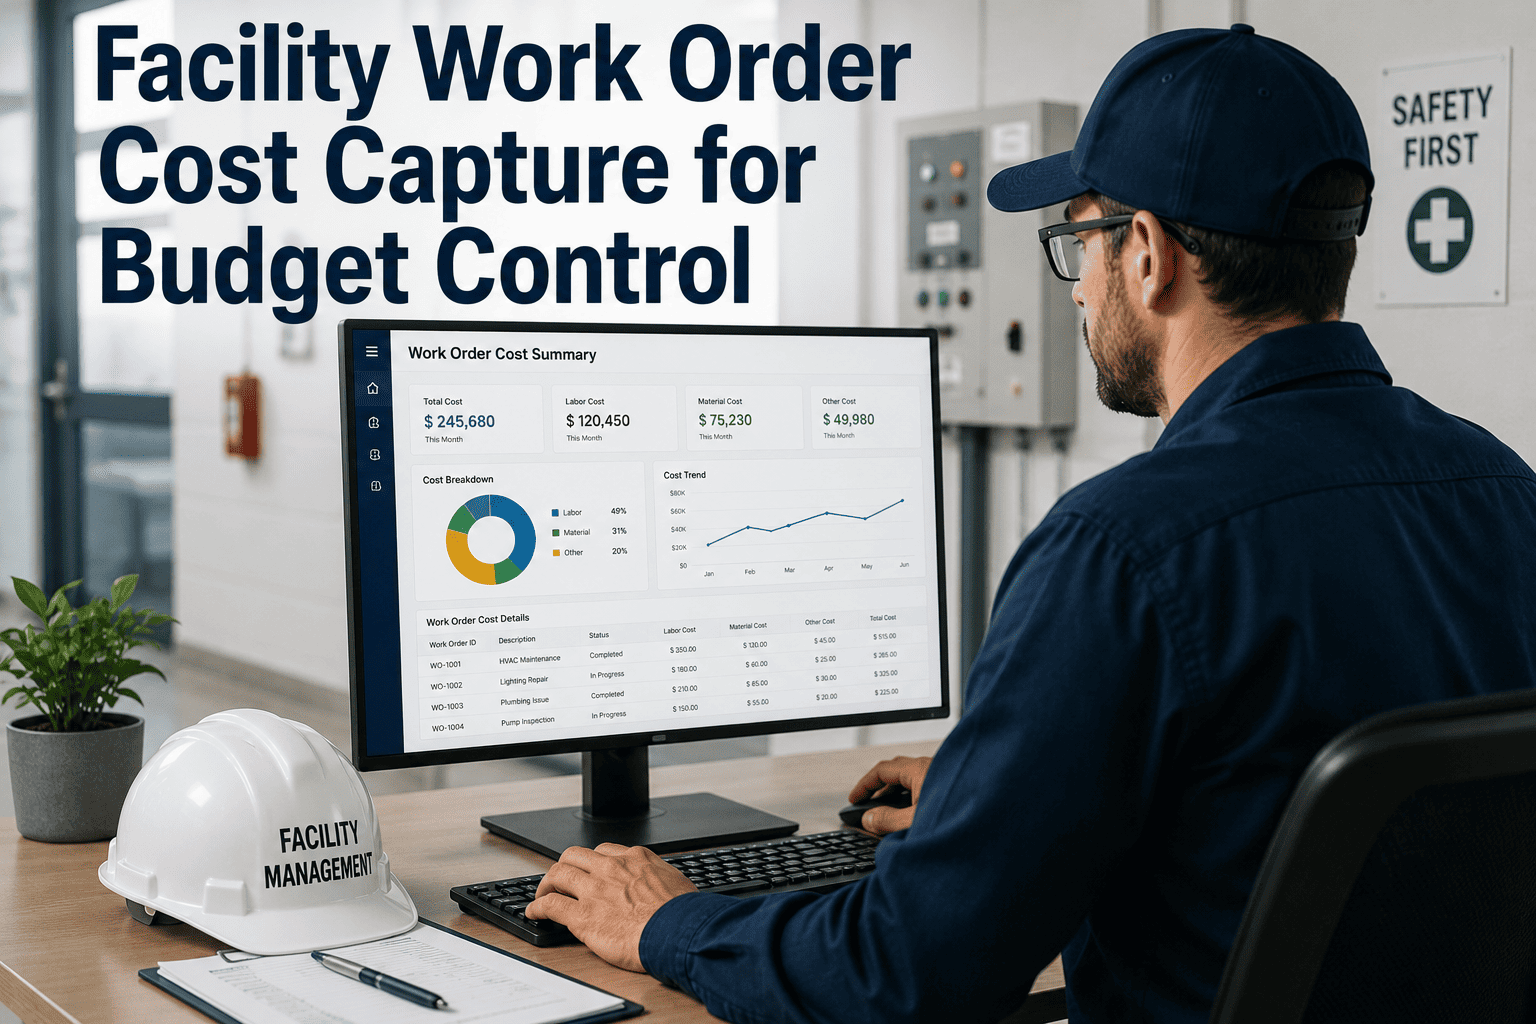
Most facility budgets are built by taking last year's spend and adding a percentage. That method works until a roof, a chiller plant and a fire alarm panel all reach the end of their lives in the same two years. The cost curve then stops being a gentle slope and becomes a bulge that nobody planned for. A five-year forecast built building by building, from age, condition and code requirements, makes those bulges visible while there is still time to smooth them. This guide shows the method, and how a CMMS with asset history and condition records supplies the data behind it.
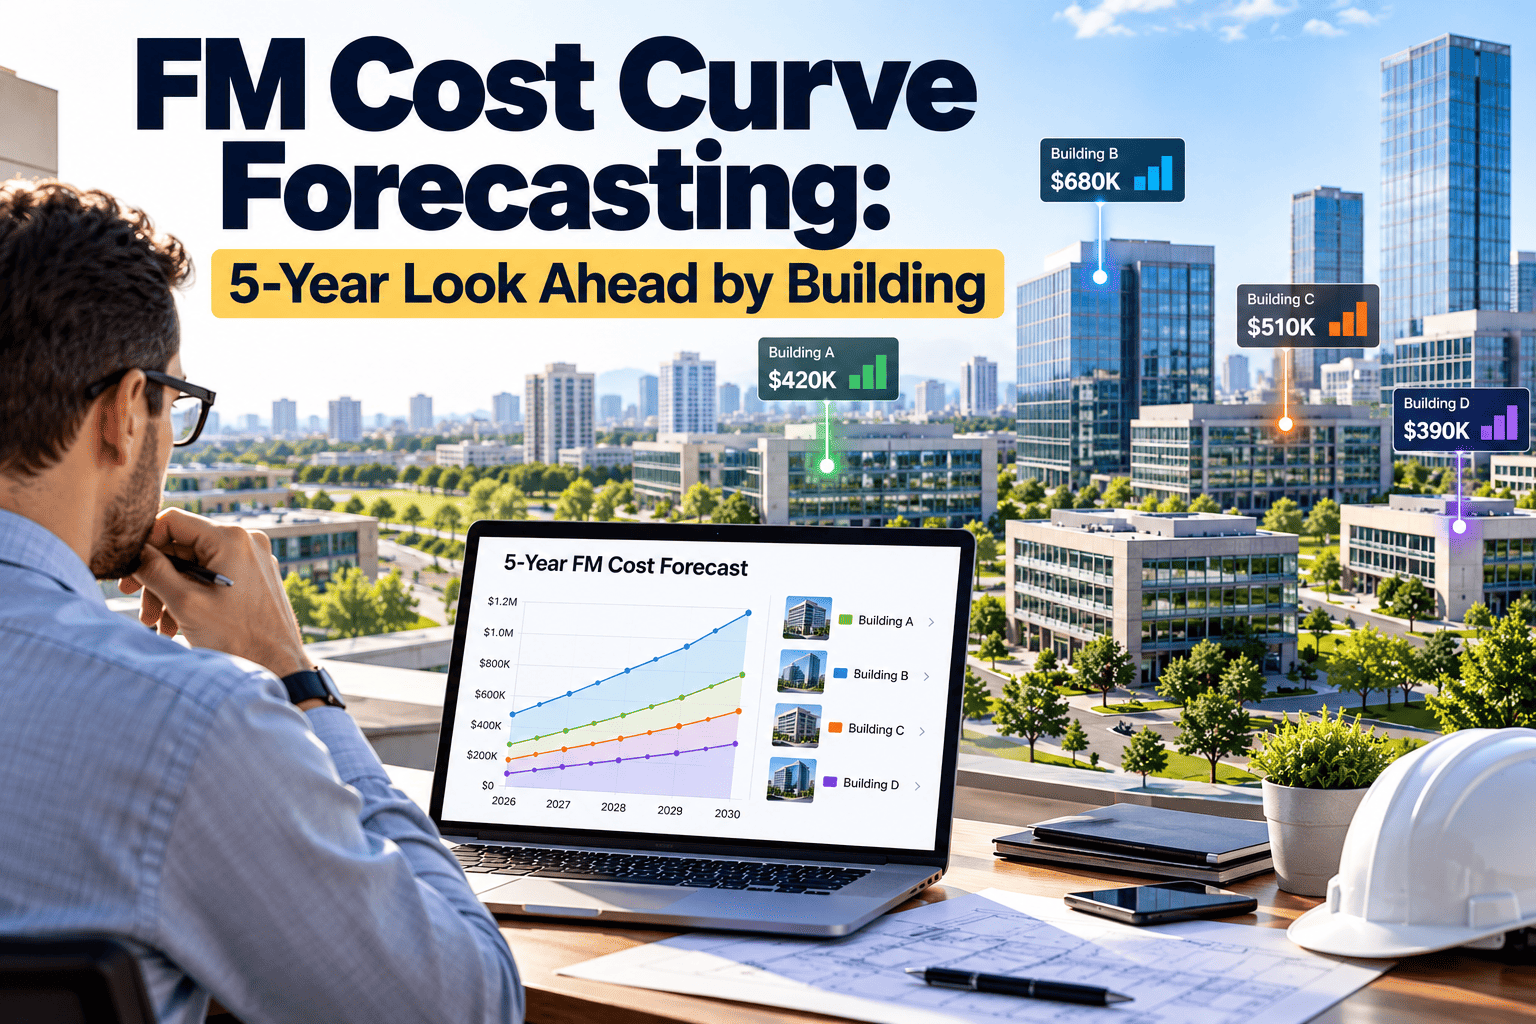
FM Cost Curve Forecasting: 5-Year Look Ahead by Building
A cost curve is the shape of spend over time. Forecast it asset by asset and you can see where renewal clusters, then phase the work. Oxmaint keeps the age, condition and work history needed to do that credibly.
Why Cost Curves Bulge
Renewal cost clusters for understandable reasons. Understanding the chain helps you spot it years ahead.
The Three Inputs: Age, Condition and Code
A credible forecast uses all three. Any one alone produces a misleading curve.
What Makes Up the Curve
Forecast each layer separately, because each behaves differently over time.
| Cost layer | Behaviour over five years | Forecast basis |
|---|---|---|
| Routine planned maintenance | Steady, rising with scope and labour rates | Preventive schedules, contract rates, escalation assumption |
| Reactive repair | Rises as assets age, then drops after replacement | Work order history by asset and failure type |
| Lifecycle renewal | Lumpy, driven by end-of-life dates | Age, condition grade and replacement cost estimate |
| Compliance upgrades | Step changes on regulatory dates | Code review and inspection findings |
| Cost escalation | Compounds across all layers | Stated inflation and market assumption, reviewed annually |
See the Next Five Years of Building Cost Before They Arrive
Hold asset age, condition and work history in Oxmaint, then forecast renewal by building with data you can defend to finance.
The Forecasting Method, Step by Step
The process is the same for a single building or a large portfolio. Do it in this order so that each step feeds the next.
Condition Grades: Turning Observation into Timing
A simple five-grade scale gives consistent inputs. Define each grade in writing so inspectors score the same way.
System-by-System Forecast Signals
Each building system shows its age differently. Use the cues below to refine timing, and check manufacturer guidance for expected service life.
| System | Condition signals | Renewal triggers | Cost risk |
|---|---|---|---|
| Roofing | Leak history, membrane splits, ponding, moisture surveys | Repair cost approaching replacement, warranty end | Water damage to interiors if deferred |
| Chillers and boilers | Efficiency drift, refrigerant loss, repeated trips, parts availability | Obsolete parts, regulatory change, major component failure | Large single-item cost and operational outage |
| Air handling and controls | Coil condition, fan motors, control faults, unsupported software | Controls obsolescence, comfort complaints, energy targets | Rising energy and service calls |
| Electrical distribution | Thermography findings, breaker age, load growth | Capacity limits, safety findings, unsupported switchgear | Safety exposure and long lead times |
| Vertical transport | Callback frequency, door and drive faults, inspection findings | Modernisation need, code compliance | Access disruption and tenant impact |
| Fire and life safety | Test failures, panel support, device age | Code changes, failed inspections, parts end-of-support | Compliance and insurance risk |
| Envelope and glazing | Seal failures, sealant ageing, water ingress | Repeated repair, energy loss, façade inspection findings | Gradual loss of performance and sudden failures |
Code and Compliance: The Forced Timeline
Code-driven work is the least flexible item in a forecast, so identify it first. Confirm the rules that apply in your jurisdiction with your advisers.
- Fire protection and life safety upgrades arising from inspections or code adoption cycles.
- Refrigerant regulations that restrict servicing or limit the life of equipment using certain refrigerants.
- Energy performance requirements and benchmarking rules that make inefficient systems costly to keep.
- Accessibility and egress requirements triggered by refurbishment scope.
- Façade, elevator and pressure vessel inspection regimes with mandatory repairs.
- Environmental and water safety obligations, such as legionella control and stormwater requirements.
Record the date each requirement takes effect, the assets it touches and the proposed response, so changes appear in the forecast with an audit trail.
Stacking Buildings Into a Portfolio View
Each building has its own curve. Summed together, they show whether the portfolio faces a smooth path or a wall of renewals in one year.
Smoothing the Bulge: Options and Trade-Offs
Once a peak is visible, you have choices. Each carries a cost or a risk that should be stated openly.
| Option | How it works | Benefit | Risk or cost |
|---|---|---|---|
| Bring forward | Renew an asset earlier than its end of life | Flattens the peak and avoids failure | Gives up remaining service life |
| Defer with monitoring | Extend life through targeted maintenance and condition checks | Defers capital for sound assets | Failure risk if monitoring is weak |
| Phase the programme | Split a large project into stages across years | Spreads spend and disruption | Higher unit cost and interface risk |
| Build a reserve | Set aside annual contributions toward known renewals | Smooths cash flow and removes surprises | Needs discipline and agreed ownership |
| Bundle by contractor | Combine similar work across buildings | Better pricing and fewer mobilisations | Concentrates supplier risk |
Scenario Planning: Base, Constrained, Accelerated
A single forecast hides uncertainty. Run three scenarios so leadership sees the range of outcomes and the cost of choices.
- Renew at expected end of life
- Current escalation assumption
- Code items at their effective dates
- Defer non-critical renewals
- Increase monitoring and repair on deferred items
- Show the failure risk and reactive cost trade
- Bring forward high-risk assets
- Combine with energy and compliance goals
- Show reduced reactive cost and risk
Assumptions That Must Be Written Down
A forecast is only as credible as its stated assumptions. Keep them visible and reviewed.
- Escalation rate: the annual cost increase applied to labour and materials, with its source.
- Contingency: the allowance for unknowns, set higher for assets with poor condition data.
- Replacement scope: like-for-like or upgrade, since upgrades change both cost and benefit.
- Expected life basis: manufacturer data, industry guidance or internal history for each asset class.
- Condition data age: the date of the last inspection, and a rule for refreshing old grades.
- Exclusions: tenant improvements, expansion and any works funded outside the facility budget.
Common Forecasting Mistakes
- Forecasting from last year's spend plus a percentage
- Using age alone and ignoring condition
- Treating renewal as a single year, not a window
- Leaving out code deadlines until they arrive
- Never comparing forecast with actual spend
- Build from the asset inventory upward
- Combine age, condition and code inputs
- Show renewal as a probable range of years
- Maintain a compliance calendar by building
- Re-baseline annually and explain variances
Lead Times: Why the Forecast Window Is Longer Than the Project
A replacement is rarely a one-year event. The forecast has to start early enough to cover each stage before work begins.
Work back from the likely renewal year to find the date by which each stage must start, and put those dates in the forecast. Missing this step is how a planned renewal turns into an emergency purchase at premium cost.
Reserve Funding: Turning Forecast Into Cash Flow
A forecast tells you what is coming. A funding method decides how it is paid for without shocking the operating budget.
- Calculate the average annual renewal need across the five-year window and compare it with current contributions.
- Identify which assets are funded from reserve, which from operating budget and which from project capital.
- Agree a rule for unspent reserve and for items that move between years, so balances stay traceable.
- Review reserve adequacy whenever the forecast changes materially, not only at budget time.
- Report the gap between forecast need and funded amount, so shortfalls are visible before they become failures.
- Share the forecast with operations and finance together, so both agree on which items are mandatory and which are discretionary.
Governance: An Annual Forecasting Calendar
Forecasting works best as a routine with owners and dates, not a one-off exercise before budget season.
- Refresh condition grades from inspections
- Update asset register and install dates
- Review code and compliance calendar
- Update replacement cost estimates
- Build the base and alternative scenarios
- Review bulges with finance and operations
- Submit budget and reserve request
- Compare forecast with actual and record variances
Questions to Ask Before You Trust a Curve
Use this short list to test any forecast, whether you built it or inherited it.
How Oxmaint Supports Cost Curve Forecasting
Oxmaint is maintenance management software. It does not replace your capital planning model, but it supplies the records that make the inputs reliable.
Frequently Asked Questions
Replace the Annual Percentage Guess With a Building-Level Forecast
Track asset age, condition and repair history in Oxmaint, and take a clearer five-year cost curve into every budget discussion.