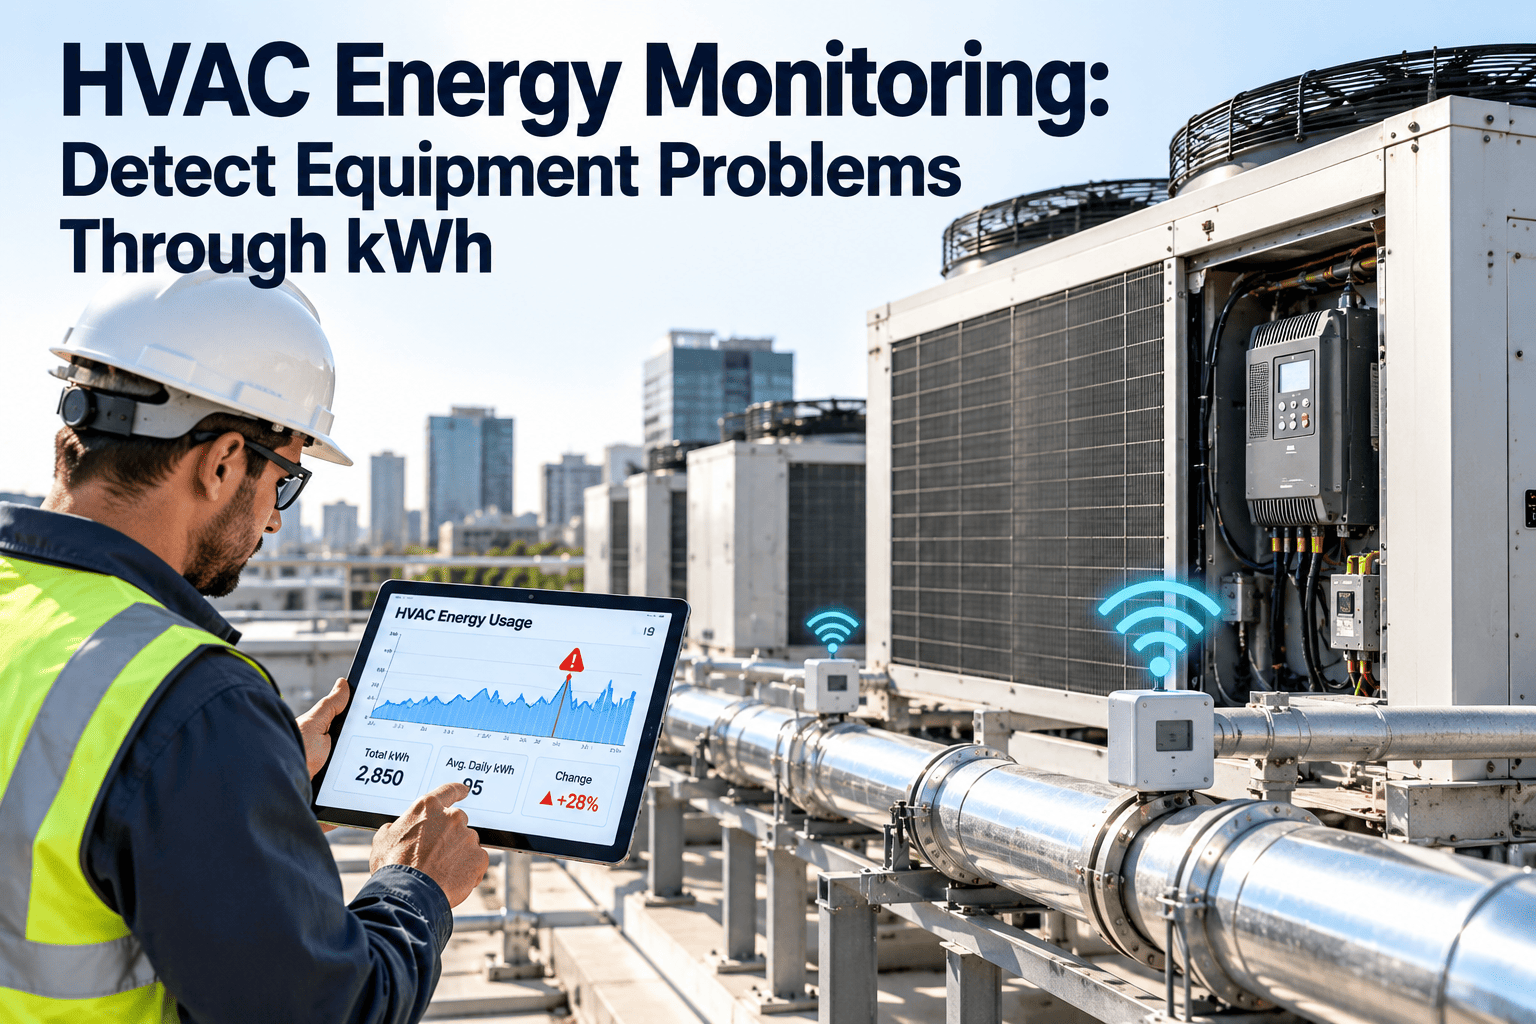
HVAC equipment rarely fails without warning. Long before a compressor trips or a fan seizes, it usually starts drawing more power for the same cooling or heating output. Fouled coils, worn bearings, stuck dampers, and refrigerant problems all leave a trace in the kWh data. Most facilities collect that data only to pay the utility bill. Used properly, it becomes an early warning system that no alarm setpoint can match. Linking energy trends to work orders in a maintenance management platform closes the gap between spotting a problem and fixing it.
HVAC Energy Monitoring: Detect Equipment Problems Through kWh Before Alarms Fire
Sub-meter major equipment, build weather-adjusted baselines, and turn energy drift into predictive maintenance work orders.
Same load, rising energy use
Baseline
Month 2
Month 4
Alarm
From Meter Reading to Maintenance Action
Measure
Sub-meters capture kWh and demand per major unit.
Normalize
Adjust for weather, occupancy, and operating hours.
Detect
Flag drift from the baseline beyond a set threshold.
Diagnose
Match the signature to likely faults and past history.
Act
Create a work order and record what was found.
Where to Place Sub-Meters
Main building meter
Central plant
Chillers, boilers, cooling towers, primary pumps.
Air side
Large air handlers and supply or return fans.
Packaged units
Rooftop units, split systems, and heat pumps.
Auxiliaries
Secondary pumps, VFD-driven motors, exhaust fans.
Start with the equipment that uses the most energy or would cost the most to lose. Federal energy programs such as DOE FEMP promote metering because you cannot manage what you do not measure.
What Different Faults Look Like in kWh
| Equipment | Energy signature | Common causes to inspect |
|---|---|---|
| Chiller or RTU compressor | Higher kWh per unit of cooling | Fouled condenser, low refrigerant, scaling |
| Air handler fan | Rising draw at constant airflow | Dirty filters, belt slip, bearing wear |
| Pump | Erratic or climbing draw | Impeller wear, valve position, cavitation |
| Any unit outside schedule | Consumption at unoccupied hours | Control overrides, stuck dampers, schedule errors |
| Heating and cooling together | Simultaneous energy spikes | Leaking valves, sensor drift, control faults |
Connect Energy Signals to the Work Orders That Fix Them
See how Oxmaint links asset records, inspections, and condition-based workflows so a kWh anomaly ends in a repair.
Building a Baseline You Can Trust
Raw kWh comparison
- Confuses hot weather with equipment problems
- Triggers false alerts in peak season
- Hides slow drift inside seasonal swings
Normalized baseline
- Compares energy against outdoor temperature and runtime
- Uses a period of known healthy operation
- Highlights change that weather cannot explain
Commissioning data or a verified post-maintenance period makes the best reference. ASHRAE Standard 100 addresses energy efficiency in existing buildings, and its focus on measured performance supports this approach.
Turning Alerts Into Predictive Maintenance
Tier 1
Small drift: add an inspection to the next scheduled visit.
Tier 2
Sustained drift: generate a work order to check the likely fault.
Tier 3
Rapid rise or off-hours use: dispatch a technician right away.
After every repair, compare energy use with the baseline and log the result. That feedback improves thresholds and proves the value of each intervention.
Checklist Before You Start Monitoring
- Asset list with unit IDs and nameplate capacity
- Meters or data points mapped to each major unit
- Outdoor temperature and schedule data available
- Baseline period defined and documented
- Alert thresholds tied to a named responder
- Work order template for energy-triggered inspections
Metrics That Prove It Works
Energy per unit of load
Tracks efficiency drift per asset.
Alerts converted to repairs
Shows whether alerts are actionable.
Time from alert to action
Measures response speed.
Unplanned HVAC failures
The outcome monitoring should reduce.
HVAC Energy Monitoring FAQs
Do I need sub-meters on every unit?
No. Start with high-consumption or critical equipment and expand as results justify.
Can energy data replace vibration monitoring?
It complements it. Energy shows efficiency loss; other sensors show mechanical detail.
How long should the baseline period be?
Long enough to cover varied weather and load conditions for each unit.
Where do repair results get recorded?
On the asset's work order history. Sign up to log findings per unit.
Can this support preventive schedules?
Yes, by adjusting intervals by condition. Book a demo to see how.
Let Your Energy Data Warn You Before Equipment Fails
Bring maintenance, assets, and condition data together so HVAC drift becomes a planned repair instead of an emergency.