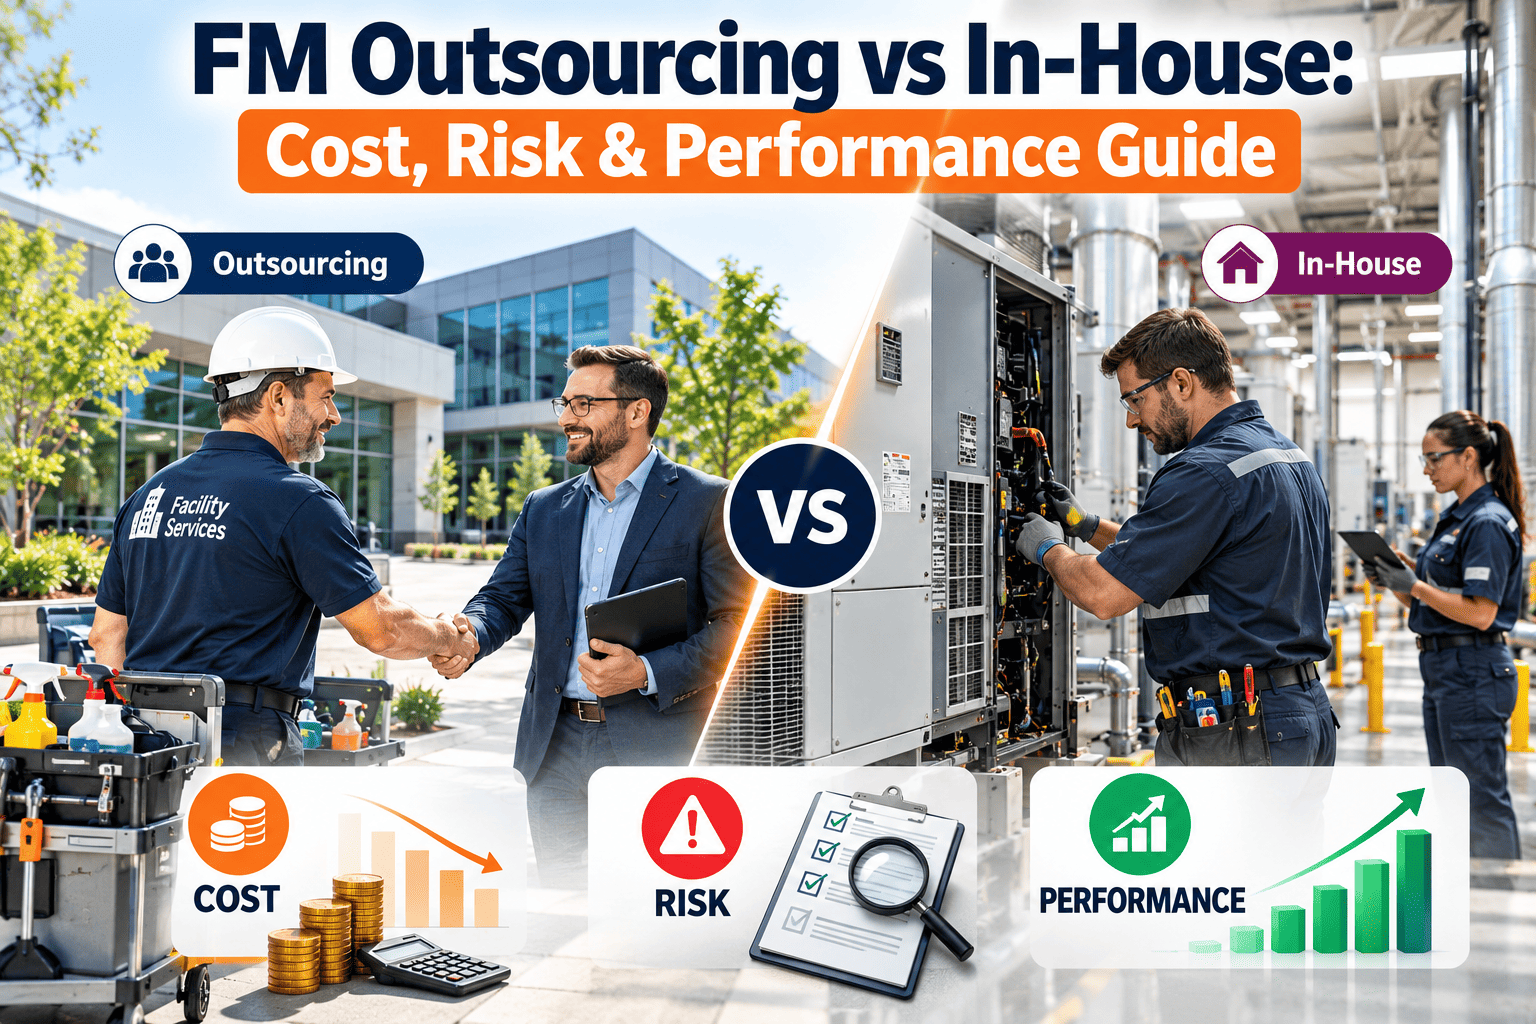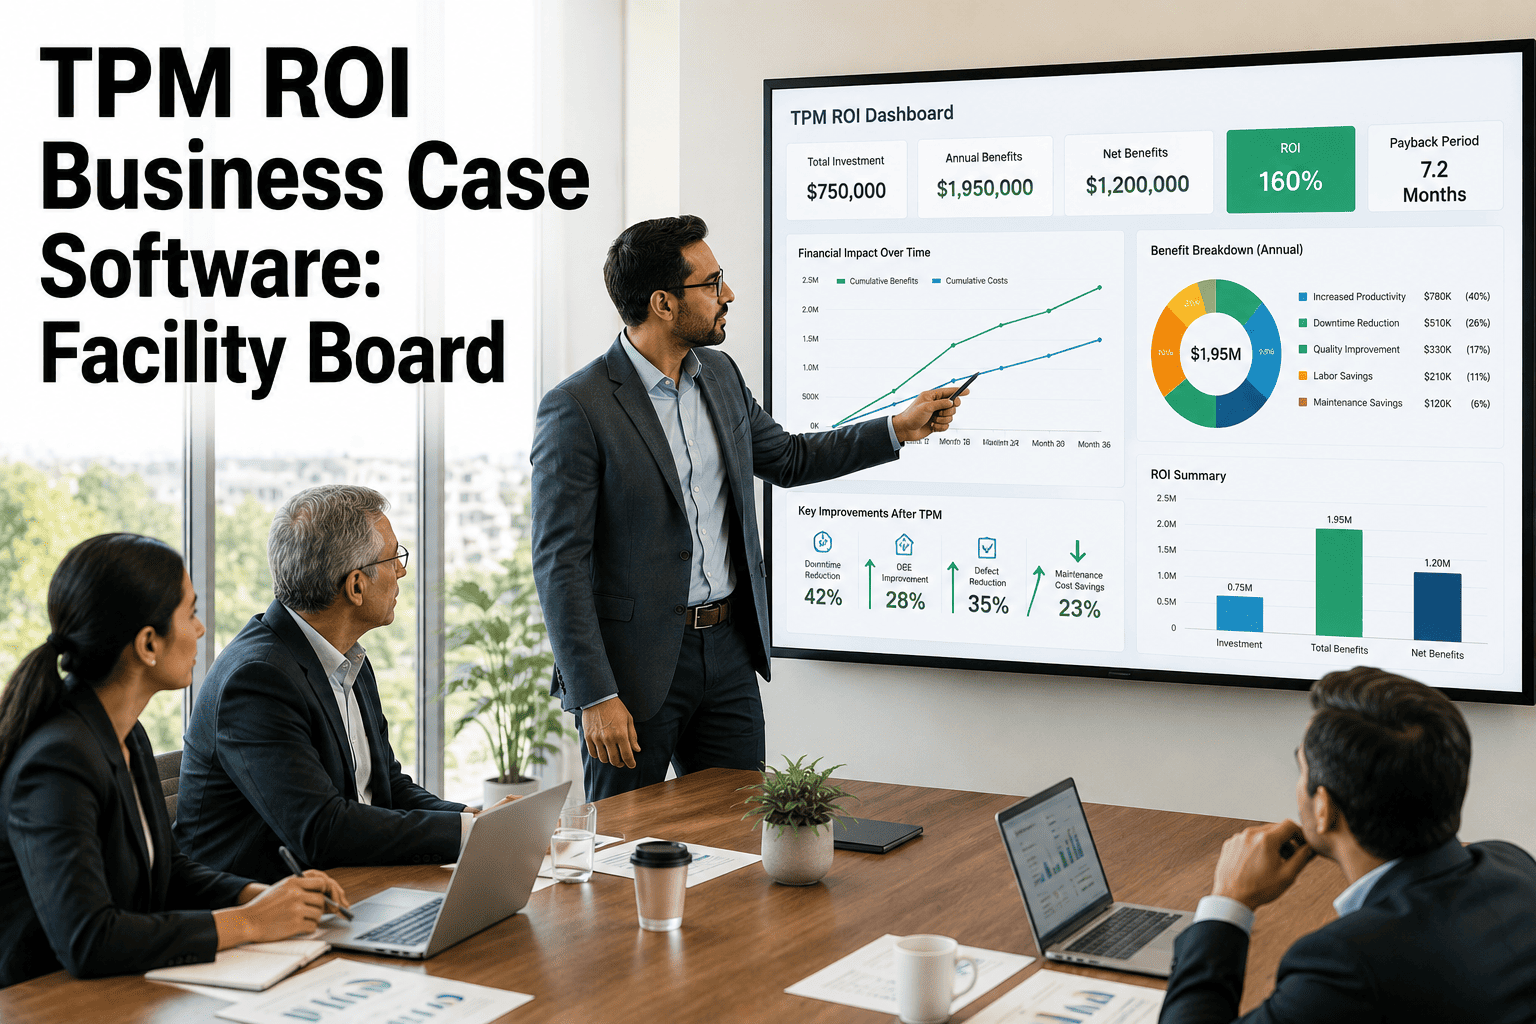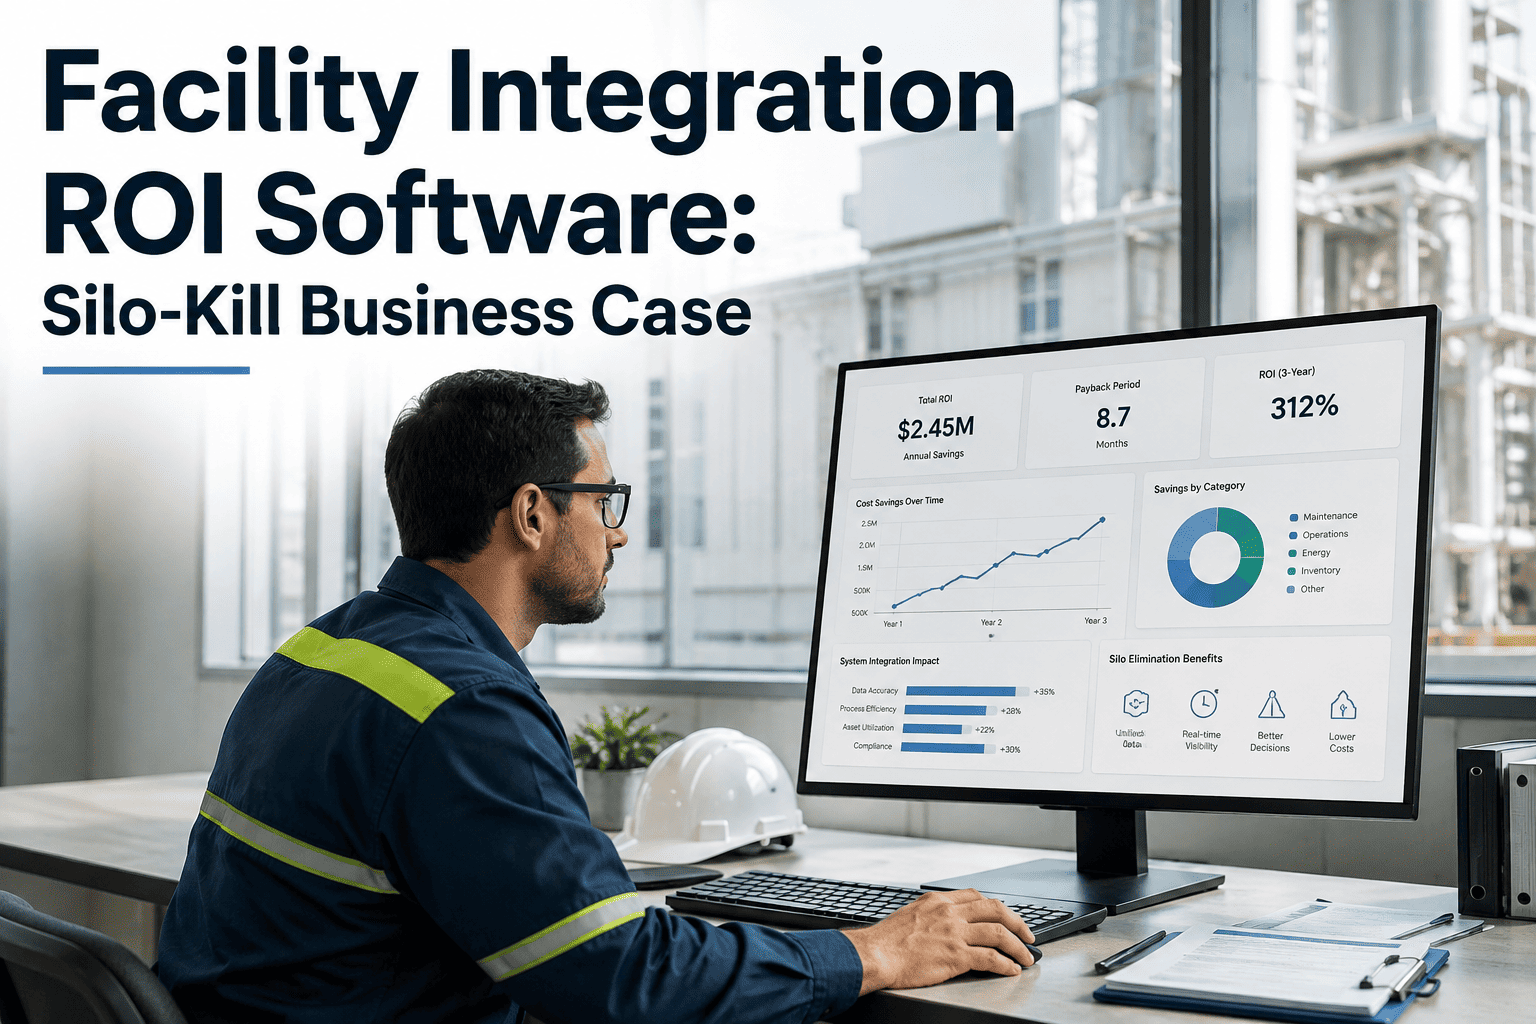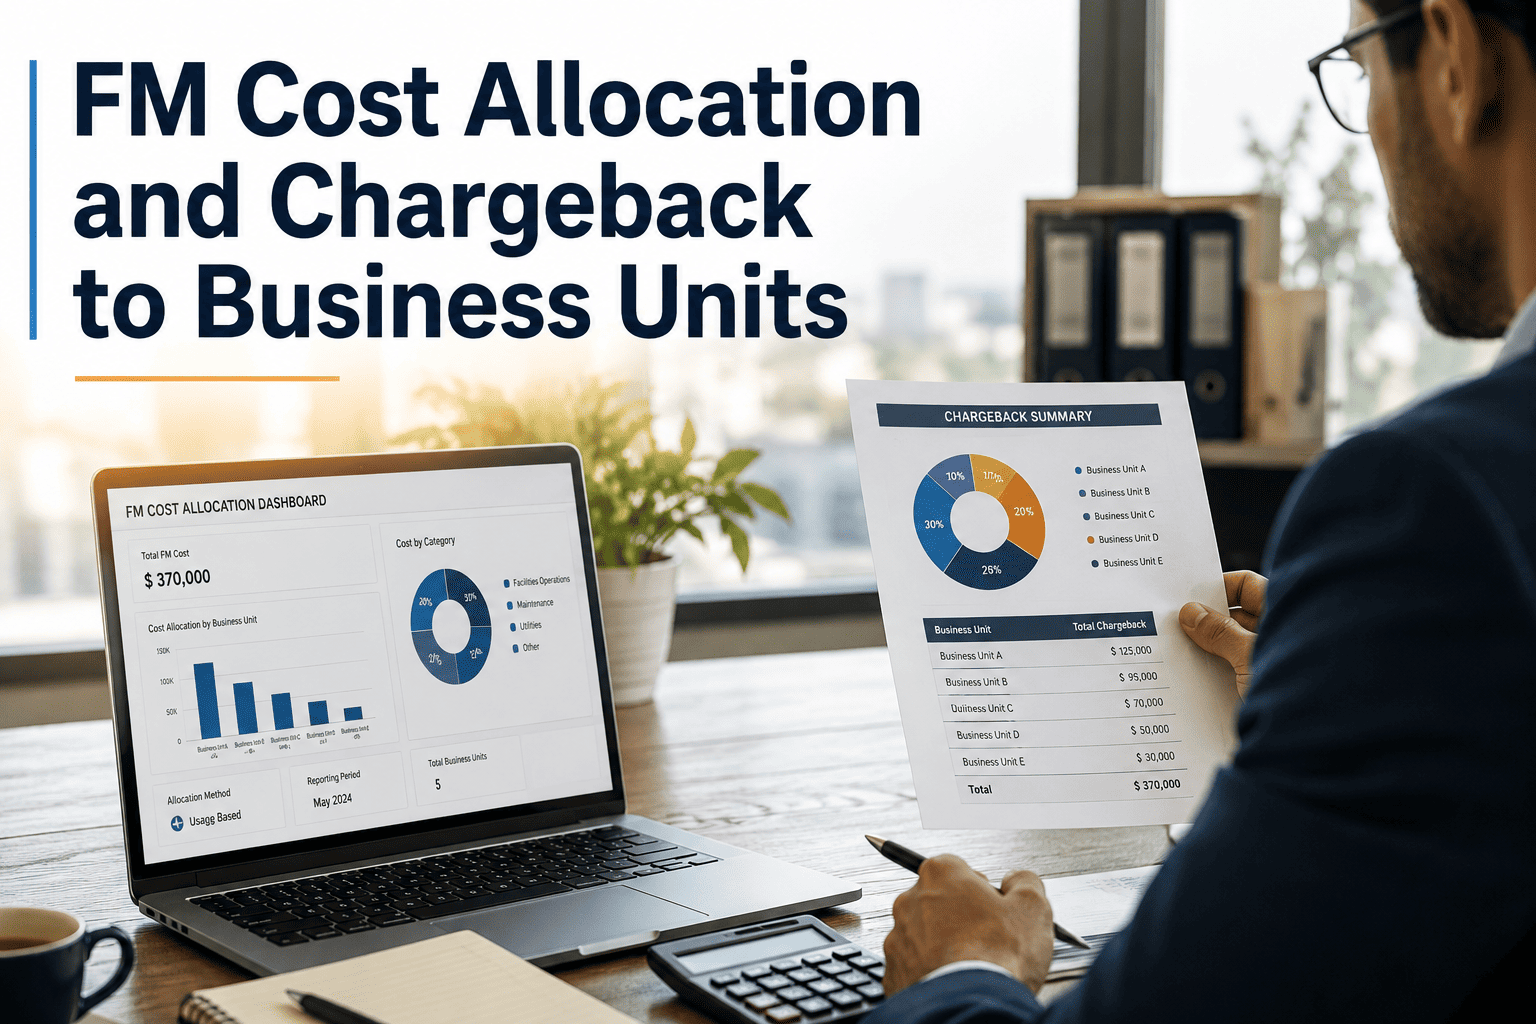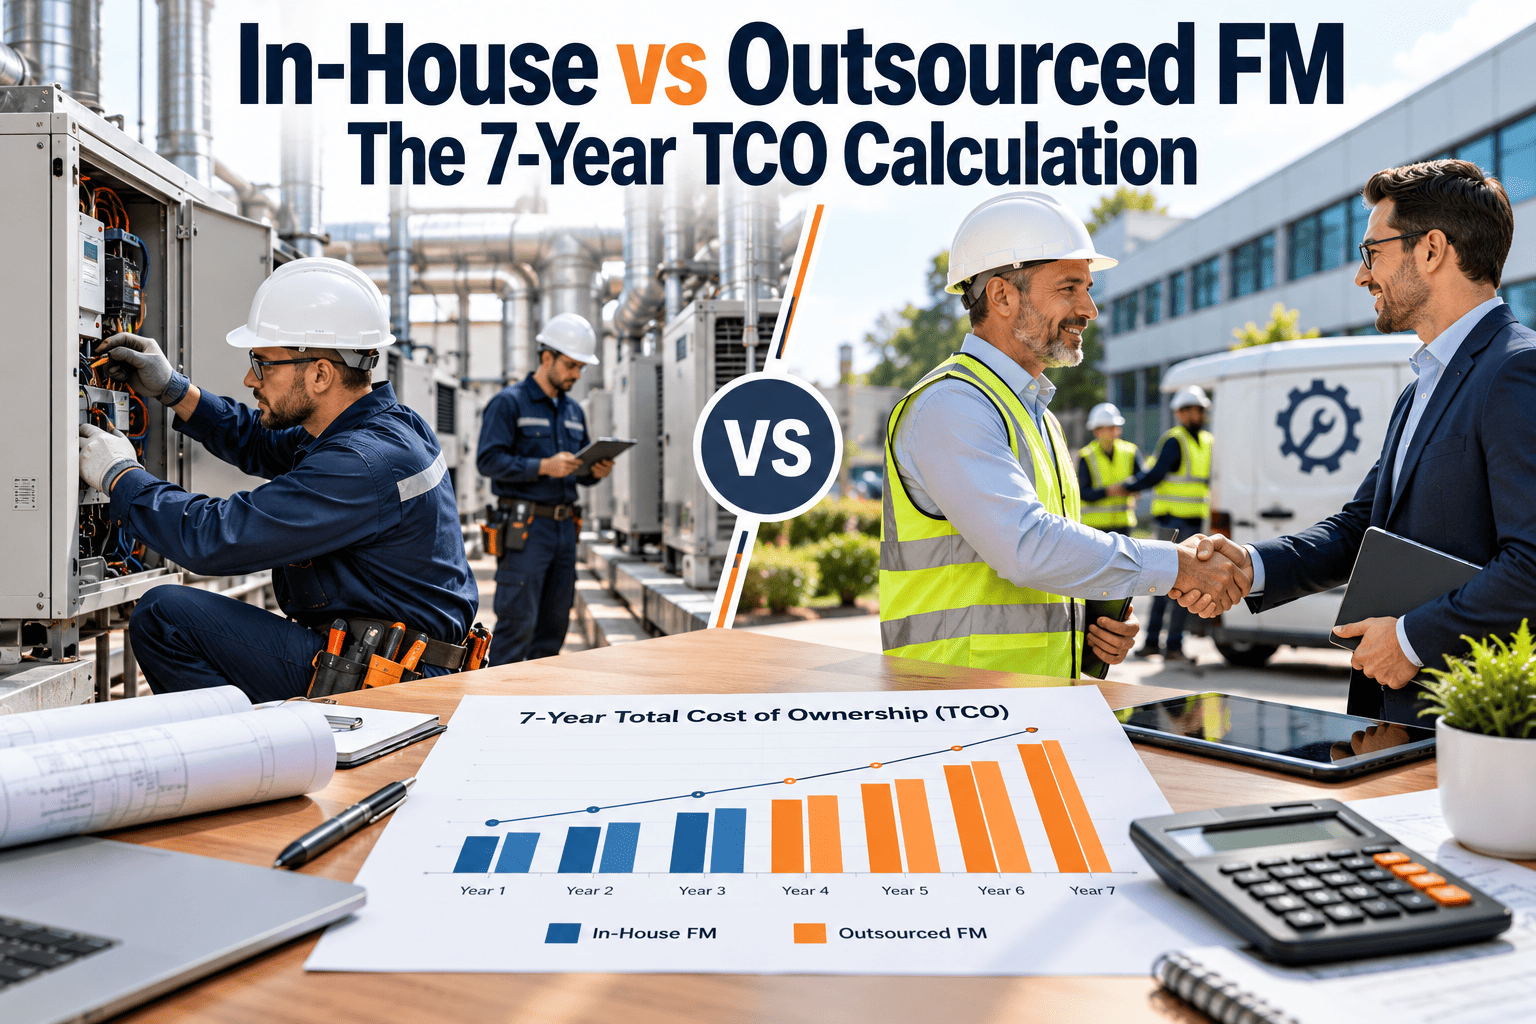
In-house facility management often looks cheaper on a spreadsheet because the visible line is wages and the contractor line is a full invoice. The gap narrows once management time, tools, training, turnover, and contract oversight are counted on both sides. This guide builds a seven-year total cost of ownership model for comparing in-house, outsourced, and hybrid delivery, following the cost-structure thinking used in IFMA and IAOP outsourcing frameworks. The model is easiest to keep honest when work history sits in maintenance management software that both delivery models can use.
FM outsourcing decisions
In-House vs Outsourced FM: The 7-Year TCO Calculation
The cheaper option in year one is rarely the cheaper option across seven years. Count every cost on both sides, discount the future, and test the assumptions that move the answer.
What most comparisons show: wages versus the contractor fee
Management time
Tools and systems
Training and certification
Turnover and rehiring
Contract oversight
Change orders
Transition and exit
Why one-year comparisons mislead
Seven years is long enough to include a re-tender cycle, a tool refresh, and at least one wave of staff turnover. A one-year view misses all three.
Typical one-year view
- Salaries versus contract price
- No discounting or inflation difference
- Transition costs ignored
- Management effort treated as free
- Quality and risk left out
Seven-year TCO view
- Full cost stack on both sides
- Present value of each year
- Setup, transition, and exit included
- Oversight and management priced in
- Risk and performance tested as scenarios
The cost stack, line by line
Use the same categories for each delivery model. A blank cell is a prompt to ask a question, not a cost of zero.
| Cost category | In-house | Outsourced | Often missed |
|---|---|---|---|
| Direct labor | Wages, benefits, overtime | Contract labor rates | Overtime and call-out premiums |
| Management and supervision | Facility manager, planners, admin | Vendor management fee | Your own contract manager time |
| Materials and parts | Purchased directly | Billed with markup or included | Storeroom carrying cost |
| Tools and equipment | Vehicles, test gear, software | Often in the vendor rate | Replacement and calibration |
| Training and licensing | Courses, certifications, safety | Vendor responsibility | Time away from work |
| Turnover | Recruiting, onboarding, lost output | Vendor absorbs, may show in rates | Knowledge lost with each exit |
| Insurance and liability | Workers compensation, general cover | Vendor carries, priced in | Retained risk on either side |
| Contract extras | Not applicable | Change orders, out-of-scope work | Pass-through audit effort |
| Transition and exit | Build-out of team and processes | Mobilization, re-tender, handover | Cost of switching back |
The seven-year formula
Discount each year's cost so money spent later counts for less than money spent now.
Total cost of ownership
TCO = Setup cost + the sum, for years 1 to 7, of [ Annual operating cost ÷ (1 + discount rate) ^ year ] + Exit cost ÷ (1 + discount rate) ^ 7
Setup cost
Hiring, tools, and systems for in-house, or mobilization and tendering for outsourced.
Annual operating cost
The full stack from the table above, grown by your own wage and contract escalation assumptions.
Discount rate
Use the rate your finance team applies to comparable decisions.
Exit cost
Cost of ending the arrangement at year seven, or the value of what you keep.
This page gives the structure only. Fill the inputs from your own payroll, vendor quotes, and work order history, not from industry averages.
Build the TCO model on facts from your own work orders
Capture labor hours, parts, response times, and repeat work in one system so both sides of the comparison use real numbers.
What the seven years usually look like
Costs do not arrive evenly. Mapping them by year exposes where each model is expensive.
Year 0
Setup Hiring and tooling for in-house. Tender, mobilization, and baseline surveys for outsourced.
Year 1
Ramp Learning curves, backlog clearing, and early change orders.
Years 2 to 3
Steady state Costs stabilize. Watch wage growth and contract indexation.
Years 4 to 5
Renewal pressure Equipment ages, tools need refresh, and scope drift appears.
Years 6 to 7
Re-decision Re-tender or rebuild. Exit and switching costs come into play.
Three delivery models compared
| Factor | In-house | Fully outsourced | Hybrid |
|---|---|---|---|
| Cost predictability | Varies with overtime and turnover | Fixed fees, but change orders add cost | Fixed core with flexible overflow |
| Control and responsiveness | High, direct reporting lines | Depends on contract and SLA terms | Direct control of critical work |
| Specialist access | Limited to what you hire | Broad vendor bench | Specialists on call |
| Management load | Heavy internal supervision | Contract and vendor oversight | Both, in smaller doses |
| Data ownership | Yours by default | Must be written into the contract | Yours, if one system is shared |
| Exit flexibility | Slow to reduce or rebuild | Re-tender, handover effort | Adjust one scope at a time |
Outsourcing reduces headcount but does not remove responsibility. Vendor performance, scope, and data still land on the owner.
Service-by-service fit: not one answer for everything
The decision rarely applies to the whole portfolio. Test each service line separately.
Janitorial and groundsOften outsourced
Fire and life safety testingSpecialist vendor
ElevatorsSpecialist vendor
HVAC and mechanicalOften hybrid
Critical systems responseOften in-house
Planning and reliabilityOften in-house
The markers are a starting hypothesis, not a rule. Dense urban clusters, remote sites, and regulated spaces can all reverse the pattern.
Sensitivity testing: which assumption flips the answer?
Change one input at a time and see whether the ranking changes. Inputs that flip the result deserve better data.
Turnover rate
Higher turnover raises recruiting and training cost for in-house teams and may push vendor rates up.
Change order volume
Heavy scope drift erodes the apparent savings of a fixed-fee contract.
Overtime and call-outs
After-hours rates can dominate cost if the contract prices them as premiums.
Management capacity
Weak internal oversight makes any model more expensive than quoted.
Discount rate
A higher rate favors options with lower up-front cost and later spending.
Asset condition
Older equipment raises corrective work, which both models must absorb.
Beyond cost: scoring risk and performance
TCO is only half the case. Score the non-cost factors with the same discipline.
Response time to critical failuresCompare tracked response times, not promises
Compliance and audit readinessWho holds records and who signs them
Knowledge retentionWhat stays if people or vendors leave
ScalabilityAbility to add or drop sites quickly
Strategic alignmentSupport for sustainability and capital plans
When each model tends to win
Patterns exist, even if every portfolio is different. Use these signals as a first filter before building the full model.
Signals that favor in-house
- Few sites in a dense area with a shared crew
- Critical systems that need immediate on-site response
- Specialized knowledge of your own equipment
- Strong internal management and planning capability
- Stable workload that keeps staff productive
Signals that favor outsourcing
- Many dispersed sites with small workloads
- Commodity services such as cleaning and grounds
- Regulated specialist testing that needs licensed crews
- Seasonal peaks that make full-time staff wasteful
- Limited internal management capacity
Most portfolios end up with a mix. Keep what is critical and local in-house, and buy what is commodity or specialist.
Holding either model accountable after the decision
The TCO case is a forecast. Track a small set of measures to see whether reality matches it.
Planned versus reactive workA rising planned share signals healthier equipment and lower cost over time
Response and completion timeMeasured from work order timestamps, by priority
Repeat work ordersSame asset, same fault, within a set window
Preventive maintenance complianceTasks completed on time against the schedule
Cost per area or per assetCompared with the baseline used in the TCO model
Out-of-scope spendCharges outside the base contract or budget
Review cadence: keep the model alive
- Monthly: compare actual spend and response times with the plan
- Quarterly: review change orders, repeat failures, and staffing stability
- Annually: refresh inputs, rerun the seven-year model, and test whether the original choice still holds
- At renewal or restructure: rebuild the case from current work order data, not from the original assumptions
The best time to prepare for a re-tender or a rebuild is the day you sign the first contract or hire the first technician.
Gathering the inputs: where each number should come from
A TCO model is only as good as its inputs. Pull each figure from a source you can defend in front of finance.
| Input | Best source | Common trap |
|---|---|---|
| Labor hours by trade | Closed work orders over at least twelve months | Using budgeted headcount instead of actual hours |
| Wage and benefit load | Payroll and HR fully loaded rates | Leaving out benefits, overtime, and payroll taxes |
| Parts and materials | Purchase records and inventory transactions | Ignoring storeroom and obsolescence cost |
| Vendor rates and fees | Signed contracts and recent invoices | Comparing rate cards without out-of-scope billing |
| Response and repeat failures | Work order timestamps and failure history | Relying on vendor-reported averages alone |
| Management effort | Time sampling of managers and planners | Treating oversight as part of normal overhead |
| Transition costs | Project plans and reference checks with peers | Assuming a clean handover with no productivity dip |
If the data does not exist, that is itself a finding. Start capturing it now, even if the decision is months away.
Common errors that skew TCO comparisons
Comparing unlike scopes
A vendor quote may exclude after-hours response, consumables, or small repairs that in-house crews absorb.
Ignoring service levels
Cheaper delivery that responds slower can raise downtime and tenant complaints, which never appear in the contract line.
Counting savings twice
Headcount reductions and productivity gains can overlap, so list each saving once with an owner.
Hiding internal subsidies
Shared vehicles, office space, and IT support often sit in other budgets and make in-house look cheaper.
Skipping the exit plan
If switching delivery models is expensive, the first choice becomes a long commitment whether you intended it or not.
Using one scenario
A single optimistic case misleads. Build low, expected, and high cases and see which option holds up.
Contract terms that change the real cost of outsourcing
Two vendors with the same headline price can produce very different totals. Read these clauses closely.
- Scope definition and how out-of-scope work is priced and approved
- Service level targets, measurement method, and the consequence of missing them
- Rate escalation, indexation, and caps over the contract term
- Pass-through cost rules for parts, subcontractors, and consumables, and your audit rights
- Ownership of data, work orders, and asset records at the end of the term
- Staffing continuity, key personnel, and notice for replacements
- Termination, handover obligations, and any exit fees
Data ownership matters most for the next decision. If the vendor holds the maintenance history, switching costs rise sharply.
Hidden costs of in-house delivery that finance should see
In-house teams carry costs that rarely appear under the facility budget line. Make them visible so the comparison is fair.
Costs usually spread elsewhere
- HR, payroll, and recruiting effort
- Vehicle fleet and fuel
- IT support and software licenses
- Safety program administration
- Insurance and workers compensation
Risks that carry a price
- Single points of failure when key staff leave
- Skills gaps on specialist equipment
- Coverage gaps for nights and holidays
- Training and certification renewal burden
- Regulatory changes that require new expertise
A five-step process to run the comparison
1
Define the scope
List the services, sites, and service levels in the decision, and use the same list for every option.
2
Collect baseline data
Pull twelve months of hours, parts, response times, and repeat failures from work orders.
3
Build each cost stack
Fill the cost table for in-house, outsourced, and hybrid, with sources noted for every line.
4
Discount and test
Apply the seven-year formula, then run low, expected, and high scenarios.
5
Decide and monitor
Choose a model, set the measures that prove it is working, and review them every year.
How Oxmaint keeps the comparison honest
- Work orders that record labor hours, parts, and completion times for in-house and vendor crews alike
- Asset records and maintenance history that stay with you, whichever delivery model you choose
- Vendor work tracked against scope so out-of-scope billing is visible
- Preventive maintenance schedules showing planned versus reactive work
- Reports and dashboards for response times, repeat failures, and cost by asset or site
- Inventory records that show the true carrying cost of parts
In-house versus outsourced TCO: frequently asked questions
Why does in-house look cheaper?
Wages are visible while management time, tools, training, and turnover are spread across other budgets and often left out of the comparison.
Why use seven years?
It spans a typical re-tender cycle, tool refresh, and staff turnover, so the model captures costs that a single year hides.
Should outsourced costs include my own oversight?
Yes. Contract management, audits, and change order review are real costs. Track them in your work order system.
Is a hybrid model always better?
No. It often fits, but the answer depends on site density, asset criticality, and management capacity. Test each service line.
Can you help structure the business case?
A short demo shows how teams gather the work data a TCO case needs.
Make the FM delivery decision on seven years of evidence
Track every hour, part, and response in one place, and your TCO model stops being an argument and starts being a calculation.