Manufacturing plants that still manage maintenance through reactive callouts and paper work orders are paying a compounding tax on every production shift. Unplanned downtime costs manufacturers an average of $260,000 per hour in lost output, and the global industrial sector loses roughly 15 to 25 percent of productive capacity to equipment failures that structured maintenance would have prevented. In 2026, the competitive gap between plants running OEE tracking, TPM methodology, and AI-powered predictive maintenance versus those still operating reactively is no longer marginal. It is existential. This guide covers the frameworks, KPIs, and platform capabilities that define modern manufacturing plant maintenance management, and how Oxmaint's real-time OEE dashboard and AI integration deliver measurable production efficiency gains from deployment day one. Ready to track OEE and automate PM across your plant? Sign up free or book a demo with our manufacturing team today.
$260K
Average cost per hour of unplanned manufacturing downtime across industrial operations globally in 2026
25%
Of manufacturing capacity lost annually to equipment failures preventable with structured PM programmes
4.8x
Cost of emergency repairs versus planned maintenance interventions at equivalent equipment and complexity
85%
World-class OEE benchmark for discrete manufacturing. Most plants run between 40 and 60 percent without structured tracking
Track OEE, Automate TPM, and Predict Failures Across Your Plant
Oxmaint's real-time OEE dashboard and AI-powered maintenance platform give plant managers live production visibility, automated PM scheduling, and predictive failure alerts from a single mobile-first CMMS. Deploy in days, not months.
OEE Framework
What OEE Measures and Why Most Plants Get It Wrong
Overall Equipment Effectiveness is the product of three distinct performance pillars. Most plants report a single composite OEE number without understanding which pillar is driving losses, which means maintenance investment goes to the wrong place every quarter.
Availability
Actual operating time divided by planned production time. Downtime from breakdowns, changeovers, and unplanned stops reduces this metric. World class: 90 percent or above.
Typical: 70-80% | World class: 90%+
Performance
Actual production rate versus theoretical maximum. Speed losses from minor stops, reduced speed, and operator inefficiency erode this pillar silently between major failures.
Typical: 65-75% | World class: 95%+
Quality
Good units produced versus total units started. Scrap, rework, and startup rejects all reduce quality rate. Poorly maintained equipment produces 3 to 5 times more quality defects than serviced equipment.
Typical: 85-95% | World class: 99%+
Availability Losses
Breakdowns and unplanned failures
Setup and changeover time
Performance Losses
Minor stops and idling
Reduced speed operations
Quality Losses
Startup and yield losses
Defects and rework during production
TPM Methodology
Total Productive Maintenance: The 8 Pillars and What Each Delivers
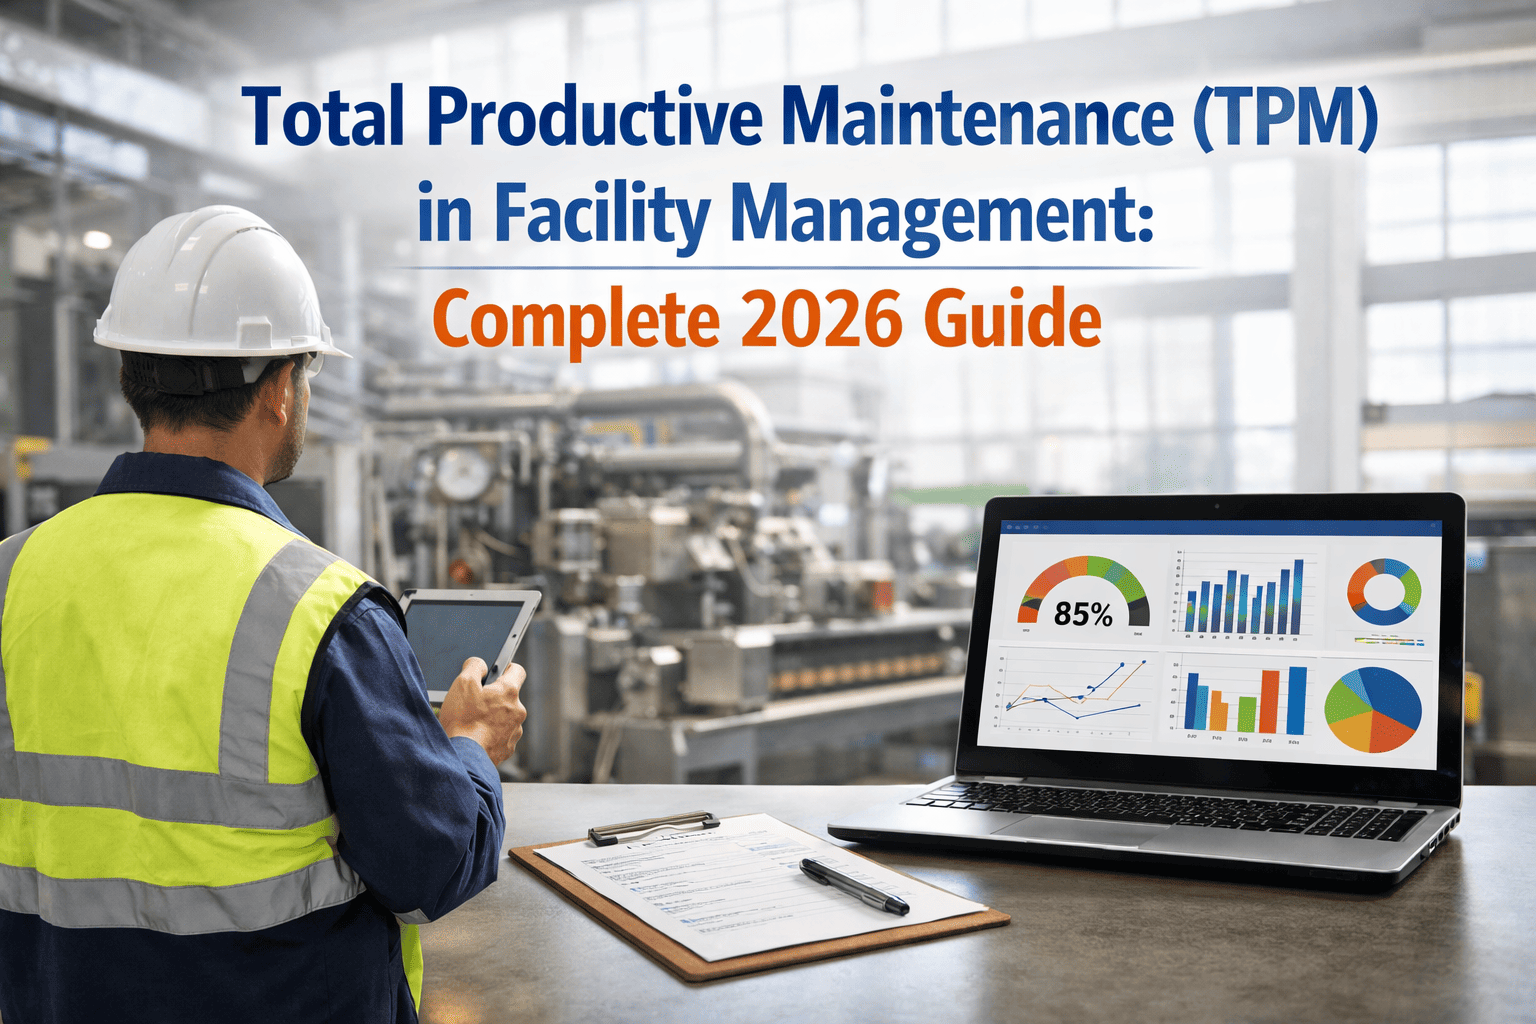
TPM is the operational framework that makes OEE improvement sustainable. Each pillar addresses a specific category of production loss. Plants that implement all eight pillars consistently achieve OEE improvements of 20 to 35 percentage points within 18 months of full deployment.
1
Autonomous Maintenance
Operators perform basic cleaning, inspection, and lubrication on their own equipment. Reduces operator-maintainer divide. Typical impact: 15 to 20 percent reduction in breakdown frequency within 6 months.
2
Planned Maintenance
Structured PM schedules tied to equipment condition, run hours, and production cycles rather than calendar dates. Shifts maintenance from reactive to preventive systematically across all asset classes.
3
Focused Improvement (Kaizen)
Cross-functional teams eliminate chronic losses through root cause analysis and targeted process improvement. Each kaizen event typically yields 8 to 15 percent improvement in the targeted OEE pillar.
4
Early Equipment Management
Maintenance requirements built into equipment design and procurement specifications. Reduces maintenance cost over asset lifetime by 20 to 40 percent versus equipment purchased without maintainability criteria.
5
Quality Maintenance
Identifies and controls equipment conditions that produce defects. Links maintenance standards directly to quality outcomes. Plants running quality maintenance pillar see 60 to 80 percent reduction in quality-related stops.
6
Education and Training
Systematic skills development for operators and maintainers. Closing skill gaps reduces mean time to repair by 25 to 40 percent and improves first-time fix rates on corrective work orders from typical 60 percent to above 85 percent.
7
Safety, Health and Environment
Zero accident operations through equipment safety integration with maintenance programmes. OSHA-compliant lockout/tagout documentation, safety inspection records, and incident tracking built into every work order.
8
TPM in Administration
Applies TPM thinking to indirect functions supporting production including procurement, scheduling, and maintenance planning. Reduces administrative losses that delay maintenance execution by 30 to 50 percent in most plants.
Why Plants Fail at OEE and TPM
4 Manufacturing Maintenance Failures That Cap Production Performance
01
OEE Tracked on Spreadsheets With No Line-Level Visibility
Plants calculating OEE manually from shift logs produce numbers 2 to 4 weeks old by the time management reviews them. By that point, the production losses driving poor OEE have compounded across every shift. Real-time OEE tracking at the individual line level is the single biggest operational visibility gap in manufacturing maintenance today.
02
PM Schedules Decoupled From Production Triggers
Calendar-based PM set at commissioning and never updated ignores actual equipment condition, production rate changes, and material variations that accelerate wear. A machine running at 130 percent design throughput needs PM at 60 percent of the calendar interval. Condition-based and production-triggered PM closes this gap entirely.
03
No Connection Between Maintenance Actions and OEE Movement
Most plants cannot answer the question: which PM action delivered the largest OEE improvement last quarter? Without connecting maintenance work order data to production performance metrics, maintenance investment cannot be optimized and the business case for preventive programmes cannot be built for capital approval.
04
AI and Predictive Analytics Deployed Without CMMS Integration
Sensor data and vibration monitoring systems that flag anomalies but cannot automatically generate work orders create a 3 to 6 week gap between anomaly detection and maintenance intervention. That gap is where preventable failures occur. AI without CMMS integration produces alerts. AI with CMMS integration produces scheduled interventions before failures happen.
How Oxmaint Solves It
How Oxmaint Delivers OEE Tracking, TPM Automation, and AI Integration in One Platform
Real-Time OEE Dashboard at Line Level
Live OEE calculated per production line and per shift using actual downtime, speed, and quality data from connected machines. Availability, Performance, and Quality tracked separately so maintenance teams know exactly which pillar to target rather than chasing a composite number.
Production-Triggered PM Scheduling
PM work orders triggered by units produced, machine cycles, operating hours, and condition readings rather than calendar dates. Equipment running above planned throughput gets PM at the right interval, not the commissioning estimate that no longer matches actual production reality.
AI Predictive Failure Alerts to Work Orders
Machine learning models analyse sensor data, vibration readings, and maintenance history to forecast component failures 2 to 8 weeks in advance. Threshold breaches automatically generate maintenance work orders assigned to the correct technician with full asset context, eliminating the manual translation step that delays most interventions.
SMED and Changeover Management
Changeover work instructions delivered to operators on mobile with step-by-step guidance, tooling checklists, and completion timestamps. SMED analysis built from actual changeover records identifies the specific steps driving excess setup time so improvement projects target real data, not observation estimates.
GMP-Compliant Digital Inspections
Equipment inspection checklists with digital signatures, photo evidence, and audit-ready timestamps satisfying FDA 21 CFR Part 11, ISO 9001, and IATF 16949 documentation requirements. Every inspection generates a permanent, tamper-proof compliance record without any manual assembly step before audits.
Maintenance to OEE Impact Correlation
Every completed PM work order linked to subsequent OEE performance data, enabling maintenance managers to quantify the production impact of specific maintenance investments. The business case for PM programme expansion is built from actual correlation data, not benchmark assumptions from industry publications.
Before vs. After
Manufacturing Maintenance: Reactive Operations vs. Oxmaint OEE Platform
Measurable Results
What Oxmaint Manufacturing Customers Measure After OEE Platform Deployment
20pts
OEE Improvement Within 18 Months
Plants moving from reactive maintenance to structured TPM with OEE tracking consistently achieve 15 to 25 percentage point OEE improvements, driven primarily by breakdown reduction and performance loss elimination.
52%
Fewer Unplanned Downtime Events
AI predictive alerts and condition-triggered PM eliminate the breakdown patterns that account for the majority of unplanned stops. Plants achieve 50 to 68 percent reduction in unplanned downtime events within 12 months of full platform deployment.
40%
Faster Mean Time to Repair
Complete repair history, parts lists, and failure mode records available on mobile before technicians reach the equipment. Eliminating diagnostic time from repair cycles reduces MTTR by 35 to 45 percent across all equipment classes.
84%
PM Compliance Rate Achieved
From a typical starting point of 31 to 45 percent PM compliance in reactive manufacturing operations, Oxmaint customers reach 84 percent compliance within 12 months through automated scheduling and production-triggered work orders.
Frequently Asked Questions
Manufacturing Plant Maintenance OEE and TPM: What Plant Managers Ask First
What is a realistic OEE target for a discrete manufacturing plant and how quickly can it be improved?
World-class OEE for discrete manufacturing is 85 percent. Most plants start between 40 and 65 percent. With structured TPM and real-time OEE tracking, plants typically achieve 15 to 25 percentage point improvement within 18 months.
Sign up free to start tracking OEE at the line level, or
book a demo to see the OEE dashboard live.
How does AI predictive maintenance integrate with a manufacturing CMMS like Oxmaint?
Oxmaint accepts sensor data from IoT devices, OBD hardware, and SCADA systems via OPC-UA and REST API. When sensor readings breach configured thresholds, the AI engine automatically generates a maintenance work order assigned to the correct technician with full asset context.
Book a demo to see the predictive maintenance workflow configured for your equipment types.
How does Oxmaint support TPM autonomous maintenance without complex operator training?
Oxmaint delivers autonomous maintenance checklists to operators on mobile with step-by-step instructions, photo capture, and completion timestamps. Training takes 2 to 4 hours per operator group.
Sign up free to configure autonomous maintenance workflows, or
book a demo for a live walkthrough.
What compliance frameworks does Oxmaint support for manufacturing plant maintenance documentation?
Oxmaint generates audit-ready maintenance records for ISO 9001, IATF 16949, FDA 21 CFR Part 11, OSHA 29 CFR 1910, and GMP compliance frameworks. Every inspection includes digital signatures, timestamps, and photo evidence exportable in under 30 minutes.
Book a demo to see compliance export for your specific regulatory requirements.
How long does it take to deploy Oxmaint across a manufacturing plant and what does implementation involve?
Most manufacturing plants are tracking OEE and running PM work orders within 7 to 14 days of starting Oxmaint. Asset registry, production line configuration, and team training complete in the first two weeks with no IT project required.
Sign up free to begin your deployment, or
book a demo for a tailored implementation plan.
Your Production Line Has Losses You Cannot See Yet. Oxmaint Makes Every One Visible.
Real-time OEE at the line level, TPM automation across all 8 pillars, AI predictive maintenance, SMED changeover management, and GMP compliance documentation in one platform. Join 1,000 plus manufacturing operations already running on Oxmaint.