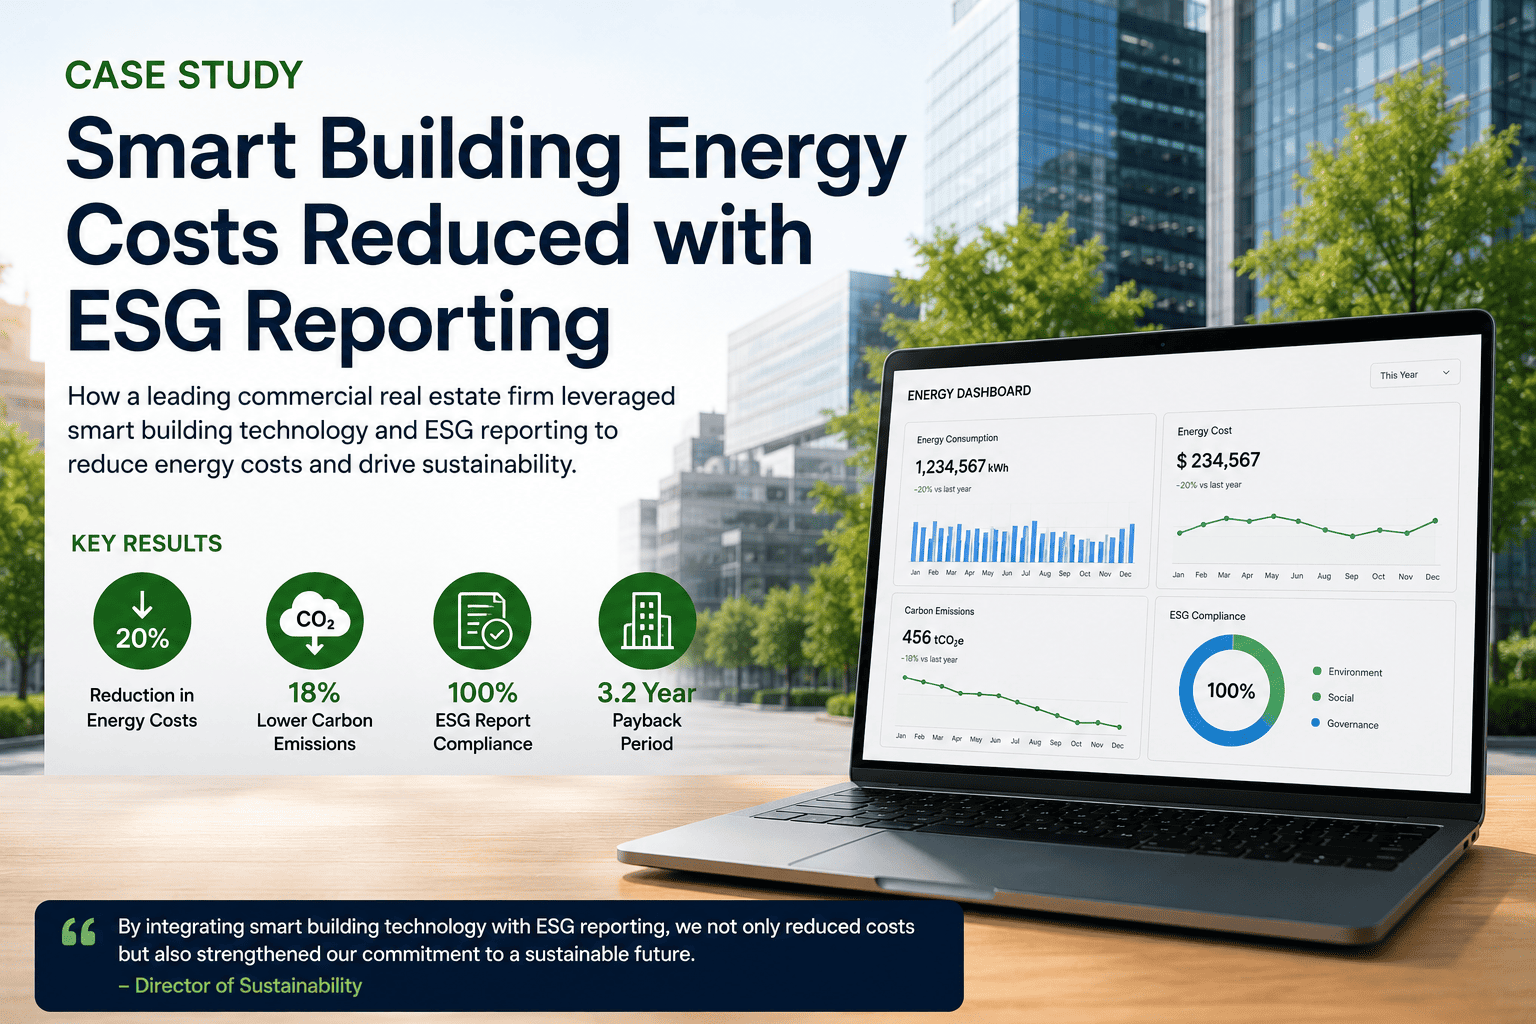
A 420,000-square-foot Class-A office campus had committed to a 30% energy reduction target as part of its ESG reporting obligations to institutional investors — and had been missing that target for three consecutive years. The energy management system was generating data. The BMS was logging HVAC performance. But the data lived in disconnected platforms, and no one could answer the question investors kept asking: which specific maintenance actions were producing which energy outcomes. Deploying OxMaint's Energy and ESG Reporting platform connected HVAC maintenance records, energy meter data, and ESG metrics into a single workflow — producing a 23% energy cost reduction in 14 months and an audit-ready ESG report generated in under 20 minutes.
Why Energy Savings Require a Maintenance Solution
Energy analytics platforms identify that a building is consuming more than it should. What they cannot do is identify why — and what maintenance action will fix it. When an AHU runs 18% above its energy baseline, the cause could be a clogged filter, a failing economizer actuator, a refrigerant leak, or a controls misconfiguration. Only a system that connects energy deviation to maintenance history can answer this question. Without that connection, energy managers and facility teams work from separate data in separate platforms — and energy savings remain a target rather than a tracked outcome.
The 4 Assets That Were Responsible for 71% of the Energy Waste
Once OxMaint connected energy meter data to individual asset maintenance records, the campus energy profile changed from a building-wide mystery to an asset-level diagnostic. Within 30 days of integration, four specific assets were identified as responsible for the majority of energy deviation — all with clear maintenance root causes.
| Asset | Energy Deviation | Root Cause Identified | Maintenance Action | Annual Saving |
|---|---|---|---|---|
| AHU-07 (West Wing) | +31% above baseline | Economizer actuator failed closed | Actuator replacement (WO #4812) | $52,400 |
| Chiller C2 | +22% above baseline | Condenser coils fouled — 3 missed PMs | Coil cleaning + PM schedule restored | $44,100 |
| RTU-14 (Roof Level 3) | +19% above baseline | Refrigerant charge 14% low | Recharge + leak detection inspection | $31,800 |
| AHU-02 (Main Lobby) | +17% above baseline | Controls setpoint drift — not reset post-winter | Controls recommissioning | $26,200 |
Know Which Asset Is Costing You Money — Not Just Which Building
OxMaint connects energy meter readings to individual asset maintenance records so you can identify, action, and document every energy saving. Book a demo and see the energy-maintenance link for your portfolio.
How OxMaint Built the ESG Reporting Workflow
Expert Review
The fundamental problem with most building energy programs is that the energy team and the maintenance team operate in separate systems. Energy analysts see a building consuming 20% above its benchmark and produce a report recommending investigation. Maintenance managers receive a work request with no context about the energy impact. When the work is completed, there is no mechanism to measure whether it actually improved the energy profile. OxMaint closes this loop — and it is the closing of this loop that turns energy management from an annual reporting exercise into a tracked operational program with measurable ROI. Institutional investors asking for GRESB-aligned ESG data want exactly this: not energy targets, but evidence that specific actions produced specific outcomes.
Frequently Asked Questions
What ESG reporting frameworks does OxMaint's export support?
OxMaint's ESG report export is structured to align with the most commonly required commercial real estate disclosure frameworks: GRESB (Global Real Estate Sustainability Benchmark), GRI Standards (GRI 302 Energy, GRI 305 Emissions), TCFD (Task Force on Climate-related Financial Disclosures), and ENERGY STAR Portfolio Manager data submission. The underlying data — energy consumption by asset, maintenance-attributed savings, Scope 1 and Scope 2 emissions calculations — is the same regardless of framework. The export template adapts the presentation format to match each framework's disclosure structure without requiring additional data collection.
How does OxMaint calculate carbon emissions from energy data?
OxMaint calculates Scope 2 market-based and location-based emissions using regional grid emission factors updated annually from EPA eGRID and IEA regional data. For Scope 1 emissions from on-site combustion (boilers, generators, gas-fired equipment), consumption is entered through maintenance work orders or meter integration and converted using EPA combustion emission factors. The platform stores the emission factor version used for each calculation period, which is important for investor-grade ESG disclosures where methodology consistency across reporting periods is required. Calculations are transparent and auditable. See the full methodology at oxmaint.ai.
Can OxMaint track energy savings from maintenance actions rather than just total building consumption?
Yes — this is one of OxMaint's core differentiators from standalone energy management platforms. When a work order is completed on an energy-consuming asset, the platform measures energy consumption for that asset in the 30 days before and after the maintenance action. The difference, adjusted for occupancy and weather normalization, is recorded as a maintenance-attributed energy saving linked to that specific work order. This creates a traceable chain from maintenance investment to energy outcome that general energy management platforms — which do not have work order data — cannot produce. For ESG reporting, this asset-level attribution is increasingly required by institutional investors seeking evidence of active energy management rather than passive monitoring.
What energy data sources does OxMaint integrate with?
OxMaint integrates with smart meter APIs (Green Button standard), BMS energy monitoring outputs (BACnet, Modbus), utility data aggregators (Urjanet, UtilityAPI), and manual meter reading entry for sites without smart meters. For buildings with sub-metering by tenant, floor, or system, OxMaint maintains separate energy profiles per zone and rolls them up to building-level totals. The integration setup typically completes within 1 to 2 weeks for BMS-connected buildings and within 3 to 5 days for smart meter API connections. Book a demo to review which integration path fits your building infrastructure.
Your Next ESG Report Should Take 20 Minutes, Not 20 Days
OxMaint connects energy data, maintenance records, and ESG calculations into one platform — so your sustainability reporting is a real-time output of your operations, not an annual scramble for data.