A national retail chain with 200 stores across 14 states was spending $4.6 million annually on facility maintenance — with zero visibility into how that money was distributed across locations. Store #105 in Phoenix had a great relationship with a local HVAC contractor whose invoices were vague and whose insurance paperwork was perpetually late. Store #217 in Dallas subscribed to the run-to-failure philosophy. The VP of Operations could not answer a basic question: which stores cost the most to maintain and why? Within 18 months of deploying OxMaint's multi-site CMMS, vendor costs dropped 28%, emergency repairs fell 40%, and every store operated under identical PM standards — whether in San Diego or Boston.
Retail Chain Standardizes Maintenance Across 200 Stores with OxMaint
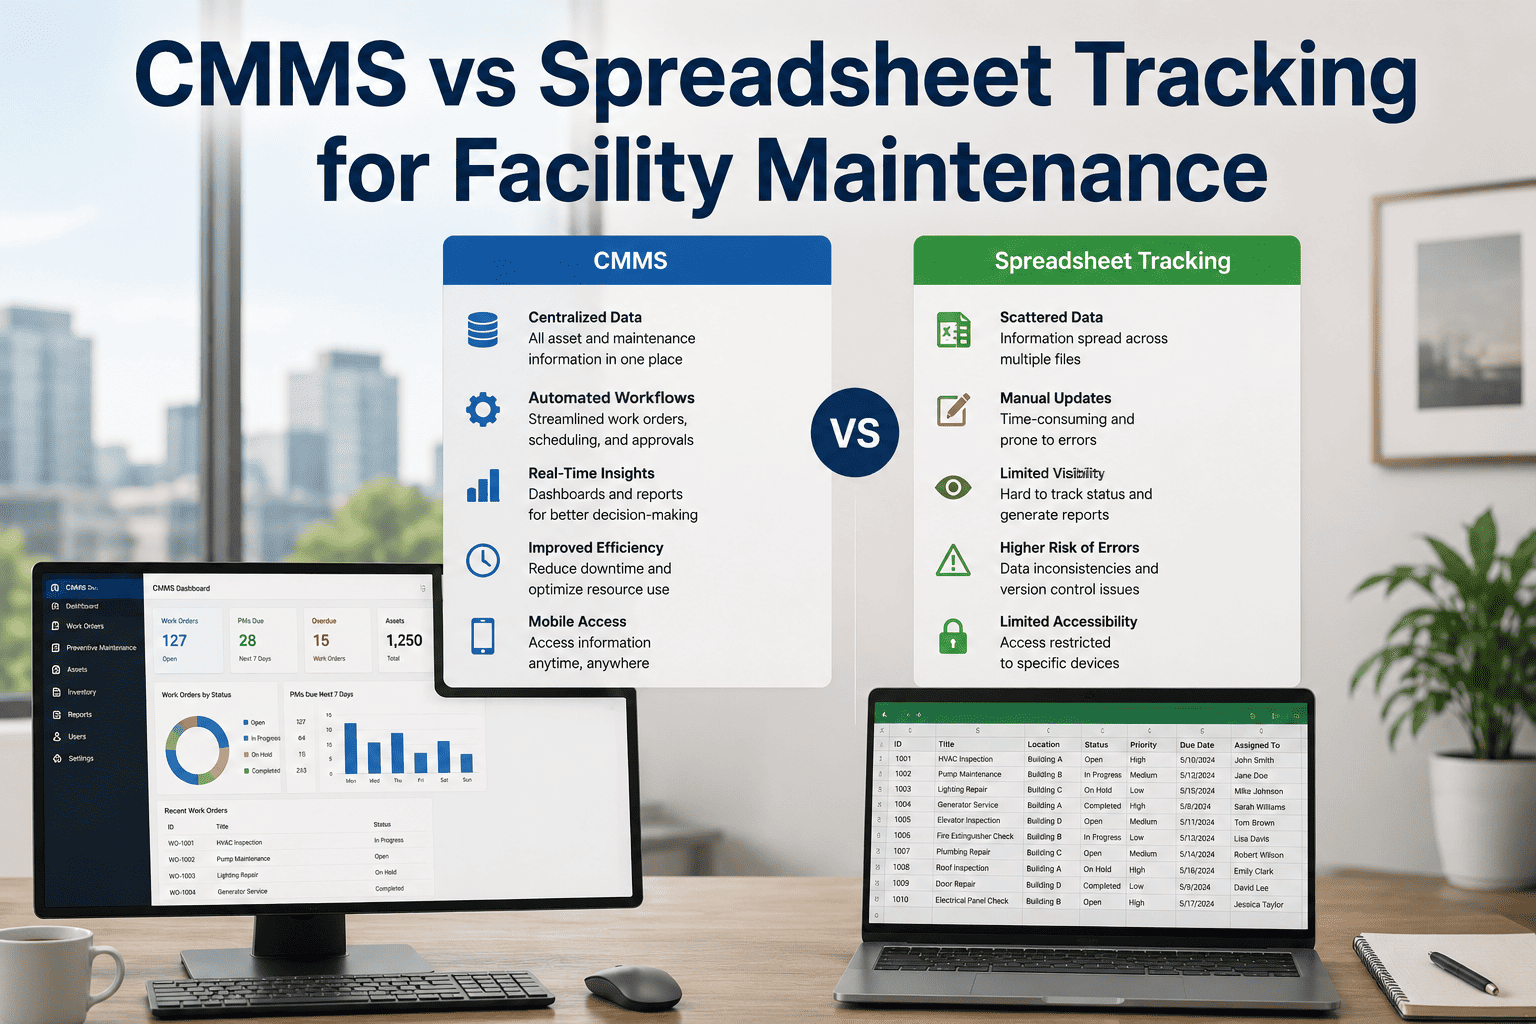
Multi-site dashboard, vendor performance scoring, and standardized PM programs turned decentralized chaos into a unified, cost-controlled operation.
The Chaos Before Standardization
Each of the 200 stores operated as an independent maintenance island. Store managers chose their own vendors, set their own PM schedules (or didn't), and reported issues via phone calls and email. The corporate facilities team of 8 people managed 140+ vendor relationships with no performance data, no cost benchmarking, and no way to enforce consistent standards.
Zero Cross-Store Visibility
Corporate could not compare maintenance cost per store, vendor response times, or PM completion rates across locations. Budget allocation was based on manager requests, not data.
Vendor Fragmentation
140+ vendors with no standardized contracts, no SLA enforcement, and no performance scoring. The same HVAC repair cost $380 at Store #12 and $620 at Store #23 — and nobody knew.
PM Non-Compliance
Without automated scheduling, PM execution depended on store manager diligence. Quarterly HVAC filter changes, fire extinguisher inspections, and refrigeration checks were routinely skipped.
Emergency-Dominant Spending
40% of all work orders were emergency or reactive — each costing 3-5x more than planned work. Friday-night HVAC failures, weekend freezer outages, and holiday-season door malfunctions drained the budget.
higher customer satisfaction rates are reported by well-maintained retail facilities compared to those with visible maintenance issues — and 64% of customers walk out of poorly-maintained stores. For this chain, maintenance quality was directly tied to revenue performance.
What OxMaint Changed
OxMaint's multi-site dashboard gave corporate visibility into every store, every vendor, and every dollar from day one. Standardized PM programs deployed identically to all 200 locations. Vendor performance scoring replaced gut-feel relationships with data-driven decisions. Sign up for OxMaint to see multi-site management configured for your chain.
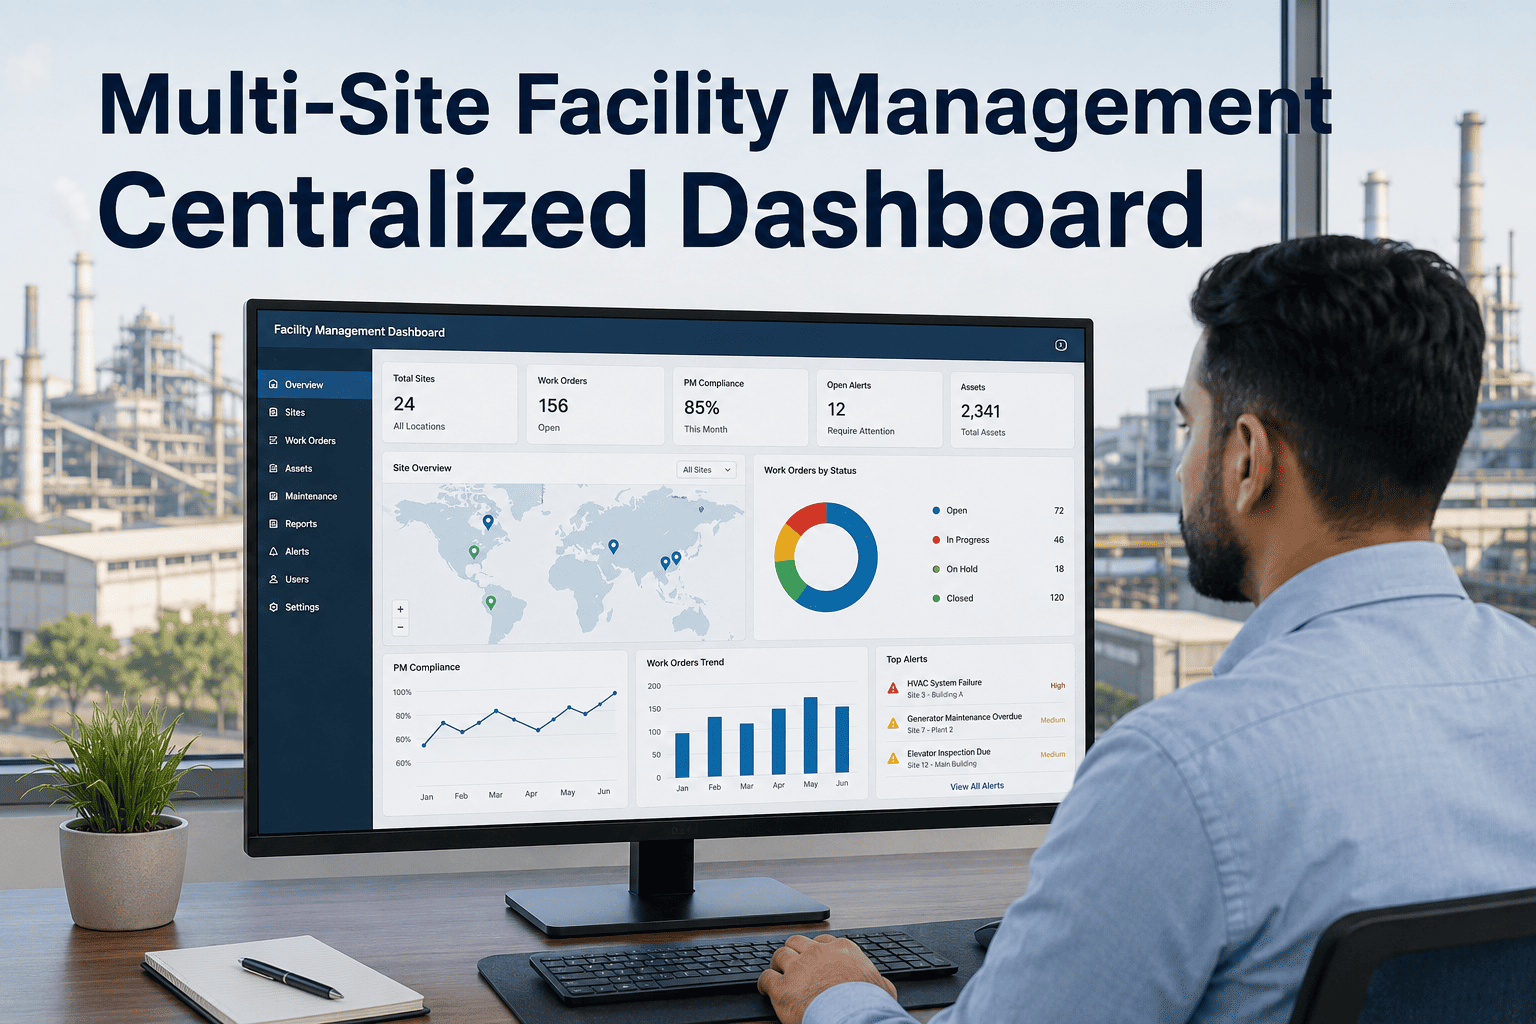
Multi-Site Dashboard
Real-time view of open work orders, PM compliance, vendor response times, and cost-per-store across all 200 locations. Regional managers drilled down by district, state, or individual store.
Vendor Performance Scoring
Every vendor scored on response time, first-time fix rate, invoice accuracy, and SLA compliance. Top performers got more volume. Underperformers were replaced with data-backed alternatives. Vendor count consolidated from 140+ to 85.
Standardized PM Programs
Identical PM schedules pushed to all 200 stores — quarterly HVAC filter changes, monthly refrigeration checks, semi-annual fire suppression inspections. Auto-generated work orders removed store manager guesswork entirely.
Cost Benchmarking
Maintenance cost per square foot tracked by store, region, and asset category. Outlier stores flagged automatically. The chain discovered 22 stores spending 40%+ more than the portfolio average — and fixed the root causes within 6 months.
18-Month Savings Breakdown
Every category of savings was verified against the chain's general ledger during the annual financial review. Book a demo to see how OxMaint models projected savings for your retail portfolio.
| Savings Category | Before OxMaint | After OxMaint | Annual Savings |
|---|---|---|---|
| Vendor Cost Consolidation | $3.1M / year | $2.23M / year | $870,000 |
| Emergency Repair Reduction | $1.84M / year | $1.1M / year | $740,000 |
| Parts Rush-Order Elimination | $210K / year | $85K / year | $125,000 |
| Asset Life Extension (Deferred CapEx) | $480K / year | $290K / year | $190,000 |
| Audit Prep Labor Reduction | $92K / year | $18K / year | $74,000 |
| Total | $1.3M+ |
We used to manage 200 stores with phone calls and spreadsheets. Store managers picked their own vendors, set their own schedules, and nobody at corporate could tell you which stores cost more or why. OxMaint gave us a single dashboard for every location. Within six months, we had cut vendor costs 28% just by seeing the data for the first time.
-- VP of Operations, National Retail Chain
Standardize Your Chain. Control Your Costs.
Every store operating as an independent maintenance island is costing you money in duplicate vendor relationships, inconsistent PM execution, and invisible cost outliers. OxMaint unifies it all — multi-site dashboard, vendor scoring, automated PM, and compliance tracking — across 10 stores or 10,000.