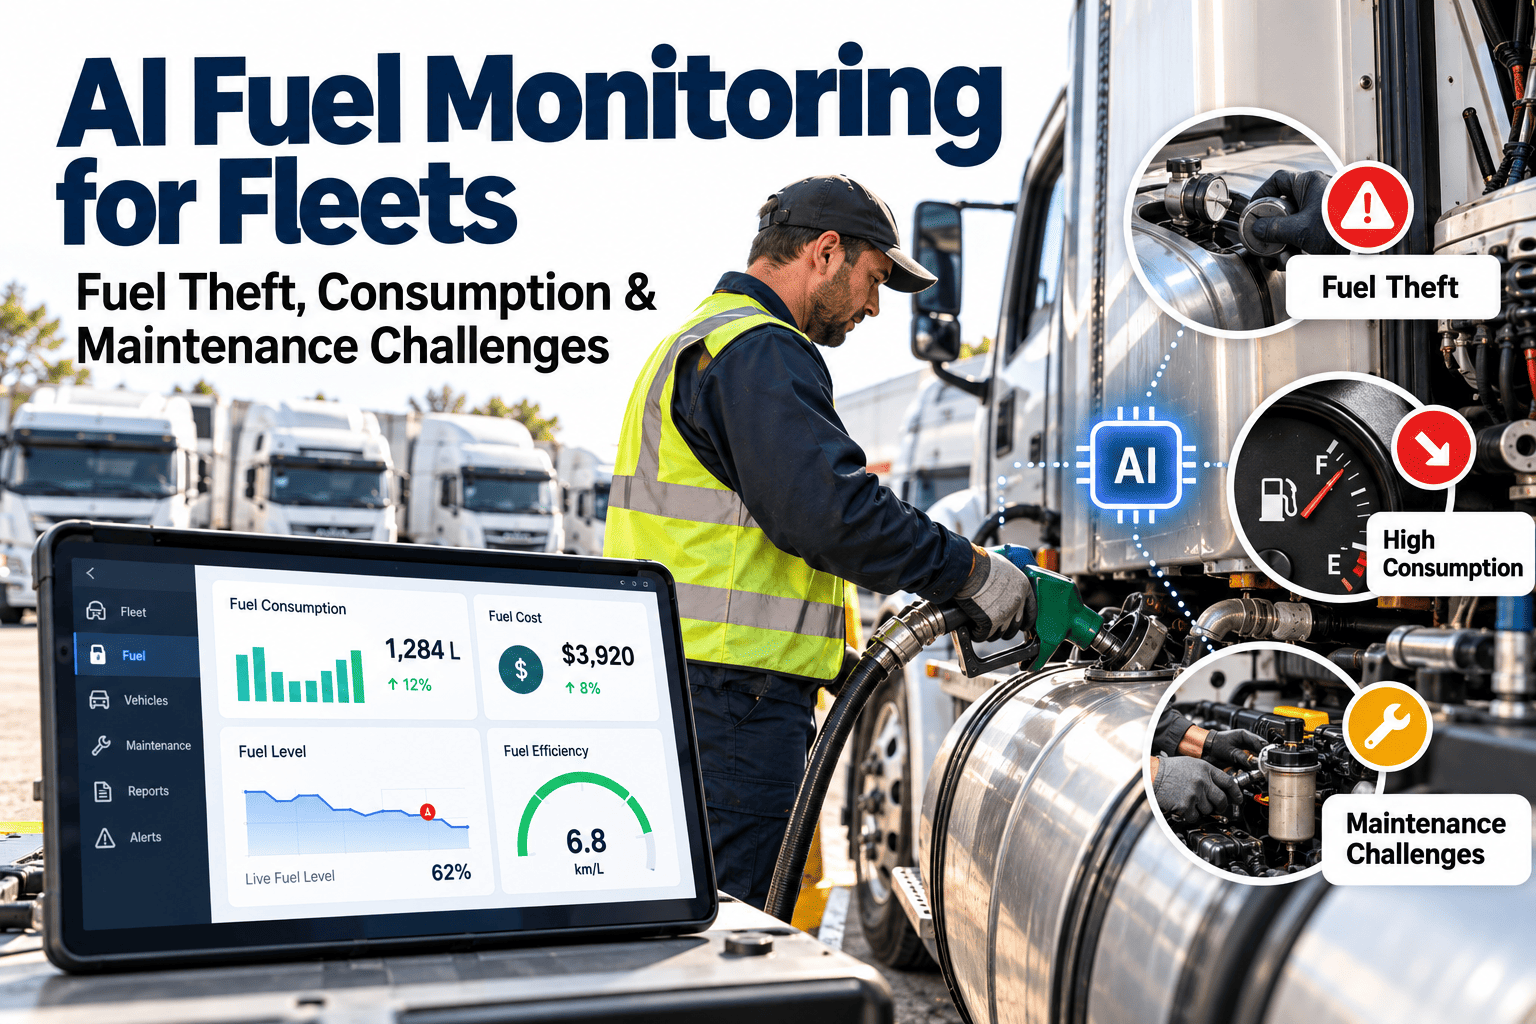
Fuel is usually a fleet's largest or second-largest operating expense, often running 30% or more of total costs, which makes it the line item most worth scrutinizing — and the one most fleets still review only once a month, long after theft or a failing component has already cost real money. AI fuel monitoring closes that gap by watching consumption in near real time and separating two very different problems: mechanical waste and deliberate theft. Paired with maintenance management software, the findings turn into scheduled repairs instead of a spreadsheet nobody reopens.
AI Fuel Monitoring for Fleets
Catch injector drift and fuel theft from the same data stream, days or weeks before a driver notices a symptom or a monthly report shows the loss.
Fuel Is the Cost Center Fleets Review the Least
Most fleets already collect fuel data through card transactions, telematics feeds, and tank sensors, yet the majority of it gets summarized into a monthly total and never examined at the transaction level.
A single siphoning event or a slowly failing injector can sit inside thousands of rows of transaction data for weeks before anyone notices the pattern, because a monthly average is exactly the kind of view that smooths sharp anomalies into invisibility.
Two Problems, One Data Stream
Mechanical waste and theft look identical on a monthly fuel report — both show up as "more fuel purchased than the miles justify." Distinguishing them requires looking at how the anomaly develops over time.
- Develops gradually over days or weeks
- Shows as a slow drift in miles-per-gallon baseline
- Common causes: injector wear, fuel pressure loss, contaminated fuel, underinflated tires
- Fix: scheduled inspection and repair, not urgent intervention
- Appears as a sharp, sudden deviation
- Statistically distinguishable from normal use within minutes
- Common patterns: siphoning, card skimming, ghost transactions, out-of-route fills
- Fix: immediate alert and investigation, often same-day
How AI Fuel Monitoring Processes the Data
Find out what your fuel data has been hiding
Most fleets have years of unused fuel transaction history sitting in their existing card and telematics systems.
Common Fuel Theft Patterns AI Monitoring Flags
| Pattern | What It Looks Like | Why Manual Review Misses It |
|---|---|---|
| Siphoning | Tank level drops while the vehicle is parked with no corresponding trip | Only visible with continuous tank-level tracking, not monthly totals |
| Card skimming | Fuel purchases at locations far outside the vehicle's normal route | Requires matching GPS location against transaction location in real time |
| Ghost transactions | A fuel purchase logged with no matching vehicle activity at all | Only surfaces when card data is cross-checked against telematics |
| Mileage inflation | Reported mileage exceeds what GPS or engine hour data supports | Needs independent odometer verification most paper logs skip |
Common Mechanical Failure Signals
- Injector degradation. Fuel consumption per mile climbing three to five percent above baseline typically indicates failing injectors or fuel pressure loss, and the trend is visible in the data weeks before a driver notices a performance change.
- Fuel quality contamination. Water or particulate contamination shows up as an inconsistent burn pattern across otherwise similar routes, a signature that stands out clearly once baseline comparison is in place.
- Tire pressure drag. Underinflated tires increase rolling resistance enough to shift the per-mile fuel baseline, a subtle signal that ties fuel monitoring back into routine tire maintenance.
- Idling and DPF stress. Extended idling raises both fuel burn and diesel particulate filter load, and tracking engine hours alongside mileage catches this combination that mileage-only tracking misses entirely.
From Fuel Alert to Maintenance Action
An anomaly detection system that only produces a dashboard chart doesn't stop the waste — it just documents it more precisely. The value shows up when a flagged trend becomes a scheduled repair.
Automatic Work Order Creation
Oxmaint converts a mechanical fuel-drift alert directly into a work order tied to the affected vehicle, with the consumption trend attached so the technician knows what to check first.
Investigation Alerts for Theft
Sudden deviations consistent with theft route to a separate alert for the fleet manager rather than a maintenance queue, since the appropriate response is investigative, not mechanical.
Cost-Per-Mile Dashboards
Fleet-wide fuel efficiency trends sit alongside maintenance cost and downtime metrics, making it possible to see whether a vehicle's rising fuel cost correlates with an overdue service interval.
Inventory and Parts Tie-In
When a fuel-system repair is scheduled, the required parts — injectors, filters, sensors — are checked against inventory automatically, avoiding a second delay once the vehicle is already in the bay.
Frequently Asked Questions
What data sources does AI fuel monitoring need to work?
It typically combines fuel card transactions, telematics mileage and GPS data, and tank-level or OBD sensor readings — most fleets already have these, just in separate systems.
How quickly can theft be detected compared to mechanical drift?
Theft events are sudden and are typically flagged within minutes of the anomalous transaction, while mechanical drift is confirmed over several days as the consumption trend establishes itself.
Does a fuel alert automatically create a repair work order?
Mechanical anomalies route into a work order in Oxmaint automatically; theft-pattern alerts route to a manager review since the appropriate follow-up is investigative rather than a repair task.
Can this integrate with the fuel cards and telematics we already use?
Yes — the monitoring layer is designed to plug into existing fuel card and telematics feeds rather than requiring new hardware or a separate reporting system.
How much fuel cost can a fleet realistically recover?
Recovery depends heavily on current data hygiene and fleet size, but fleets that had no anomaly detection in place typically find meaningful savings once theft and drift are both surfaced — book a demo to see a fleet-specific estimate.
Turn fuel data you already collect into fuel savings
Connect your existing fuel cards and telematics feed to start catching mechanical waste and theft from week one.