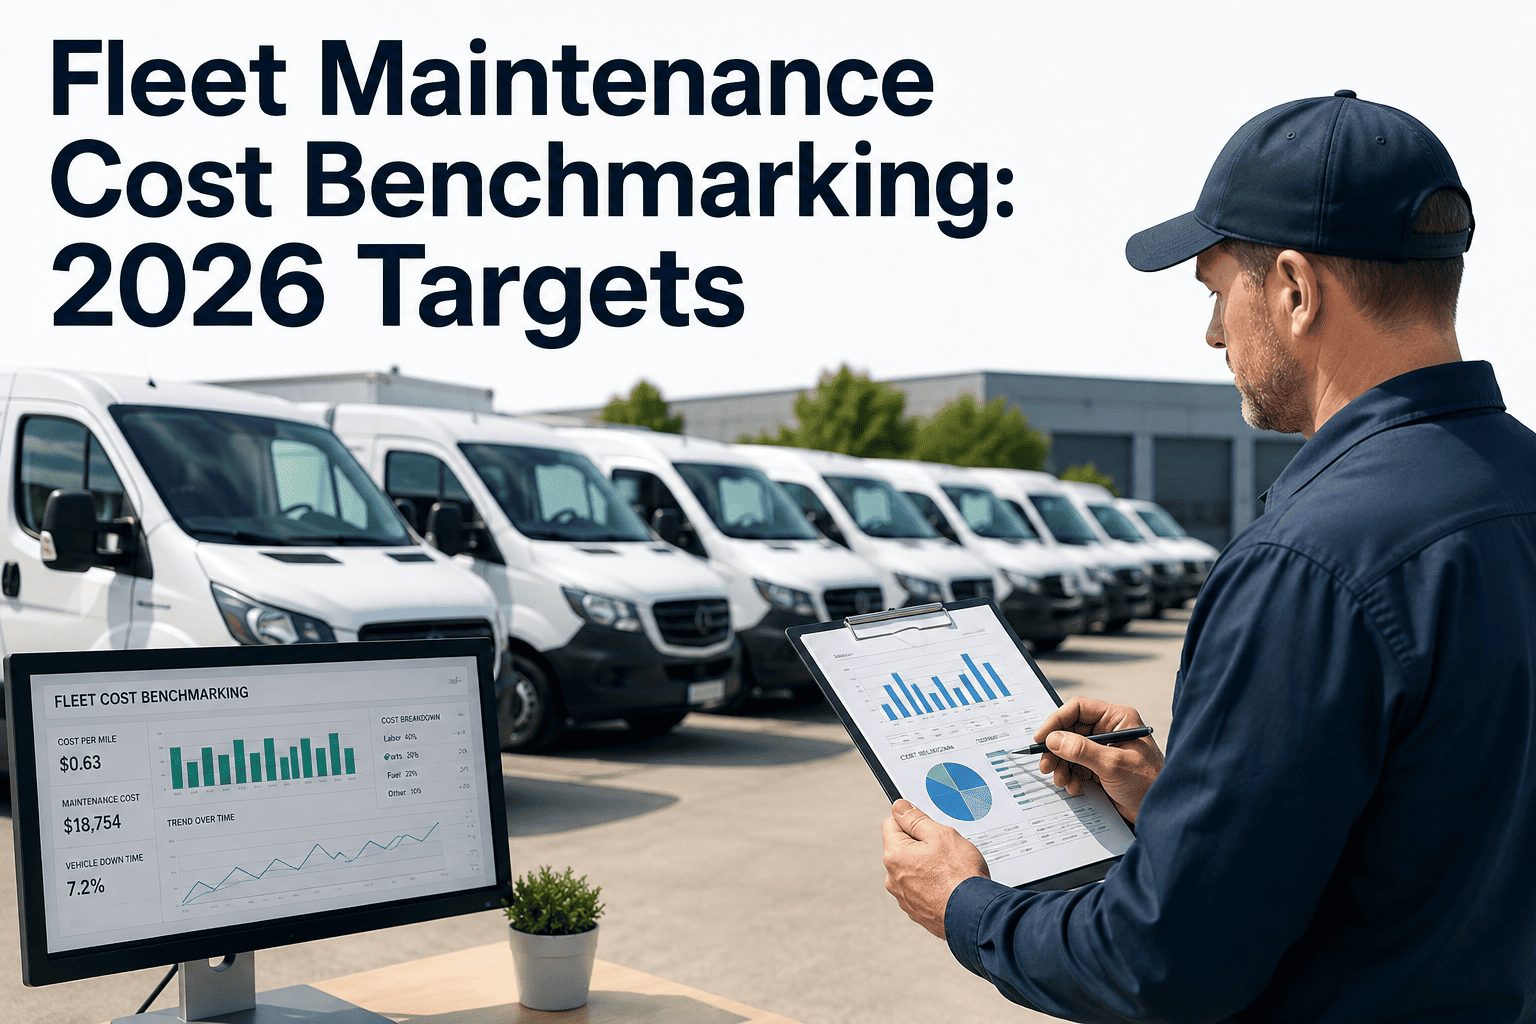
Most fleet managers can quote their total maintenance bill down to the dollar, but few can say whether $18,000 per truck a year sits in the top quartile of their industry or the bottom. Without a benchmark, a high maintenance bill just looks normal — right up until a CFO asks why a competitor is running at half the cost per mile. Fleet maintenance cost benchmarking replaces that guesswork with percentile targets pulled from real industry data, so every dollar of spend can be judged against what a well-run fleet actually pays, not against last year's budget. That comparison is also where the outliers hide: the one truck, one shop, or one repair category quietly dragging the whole fleet average up. Sign in to OxMaint to see your fleet's cost per mile benchmarked against 2026 percentile targets automatically.
Fleet Finance · Cost Benchmarking · 2026 Targets
Is Your Maintenance Spend Normal — Or Just Unquestioned?
OxMaint benchmarks your fleet's maintenance cost per mile, per asset, and per category against 2026 industry percentile targets — turning a number nobody questions into evidence your CFO can act on.
2026 Fleet Maintenance Cost Benchmarks — The Numbers Every Fleet Should Know
$0.202
industry average maintenance cost per mile across commercial fleets in 2026
$16,192
average annual repair and maintenance cost per heavy-duty truck
8.9%
share of total fleet operating cost that maintenance represents on average
3–9x
more expensive a reactive repair is compared to the same job done as planned maintenance
Where Does Your Fleet Sit? The Four Percentile Bands
Best-in-Class
Under $0.12/mi
Top-tier fleets running structured PM compliance above 90% and near-zero unplanned downtime
Top Quartile
$0.12 – $0.18/mi
Disciplined preventive maintenance programs with in-house repair optimization
Industry Average
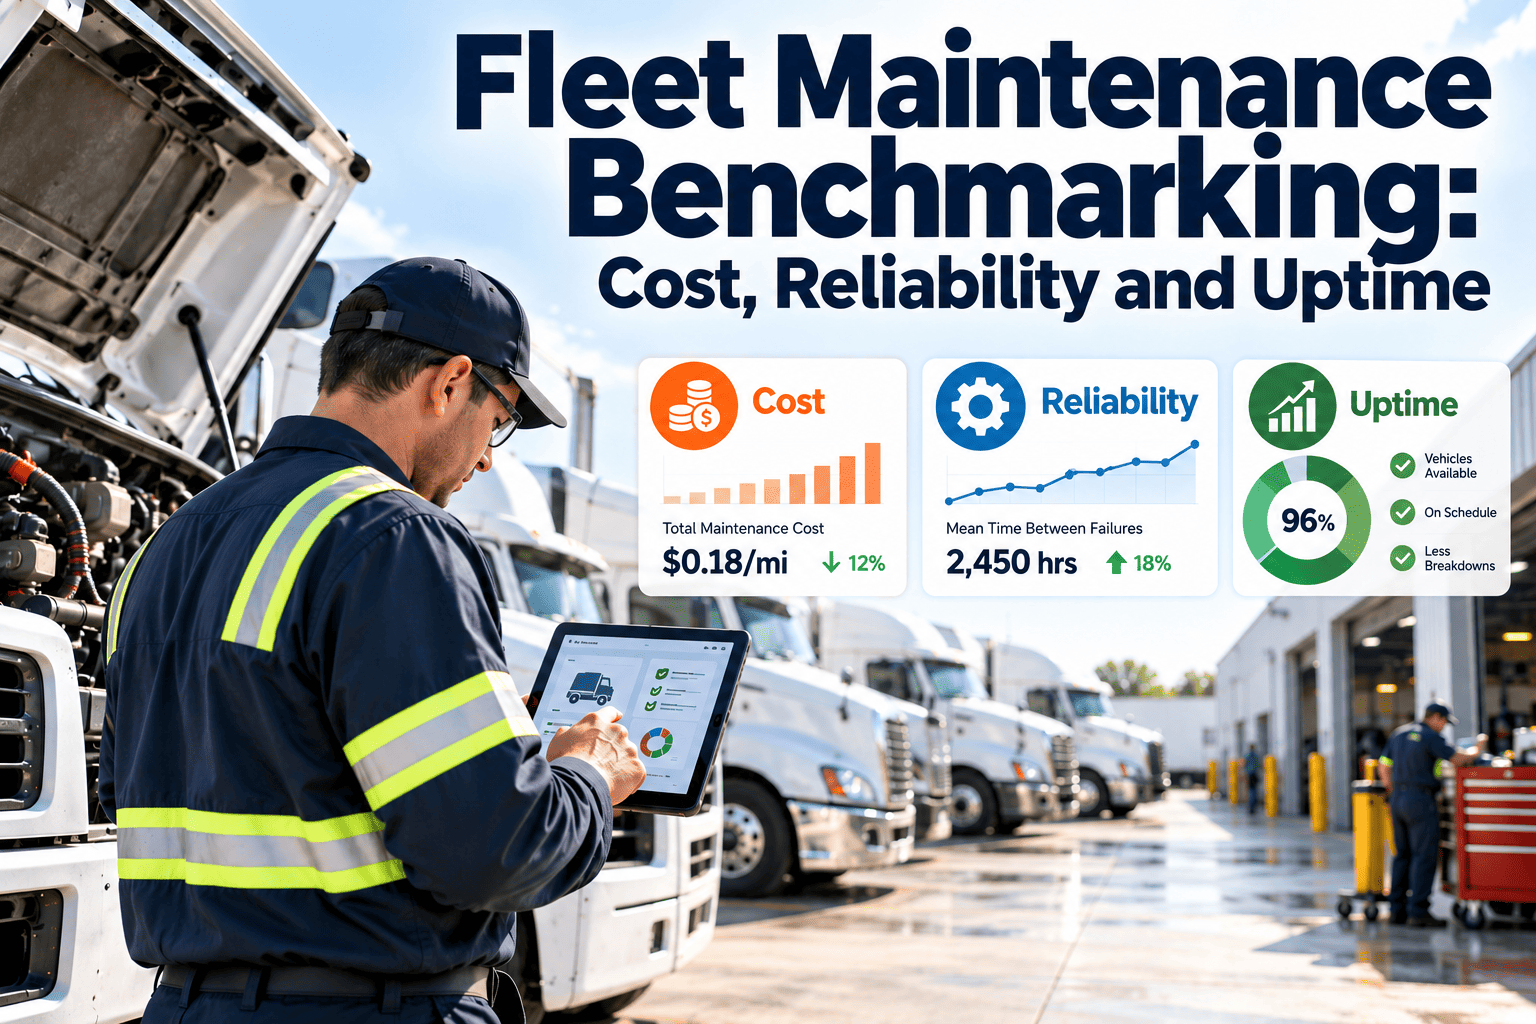
$0.202/mi
The 2026 benchmark most fleets are quietly running above without knowing it
Bottom Quartile
Over $0.30/mi
Mostly reactive repair, aging assets, and no benchmark visibility to catch it
5.5x
Vehicles over 10 years old cost 5.5 times more per mile to maintain than vehicles under 5 years old. Age alone can move a fleet from top quartile to bottom quartile — which is exactly why cost-per-mile benchmarking has to be normalized by asset age, not just averaged across the fleet.
OxMaint · Cost Benchmarking Dashboard
Stop Guessing Where Your Fleet Ranks. See the Percentile.
OxMaint pulls every work order, part, and labor hour into a live cost-per-mile figure — benchmarked against 2026 industry percentile bands automatically.
Where a Typical Maintenance Dollar Actually Goes
Labor 32%
Parts 28%
Reactive 20%
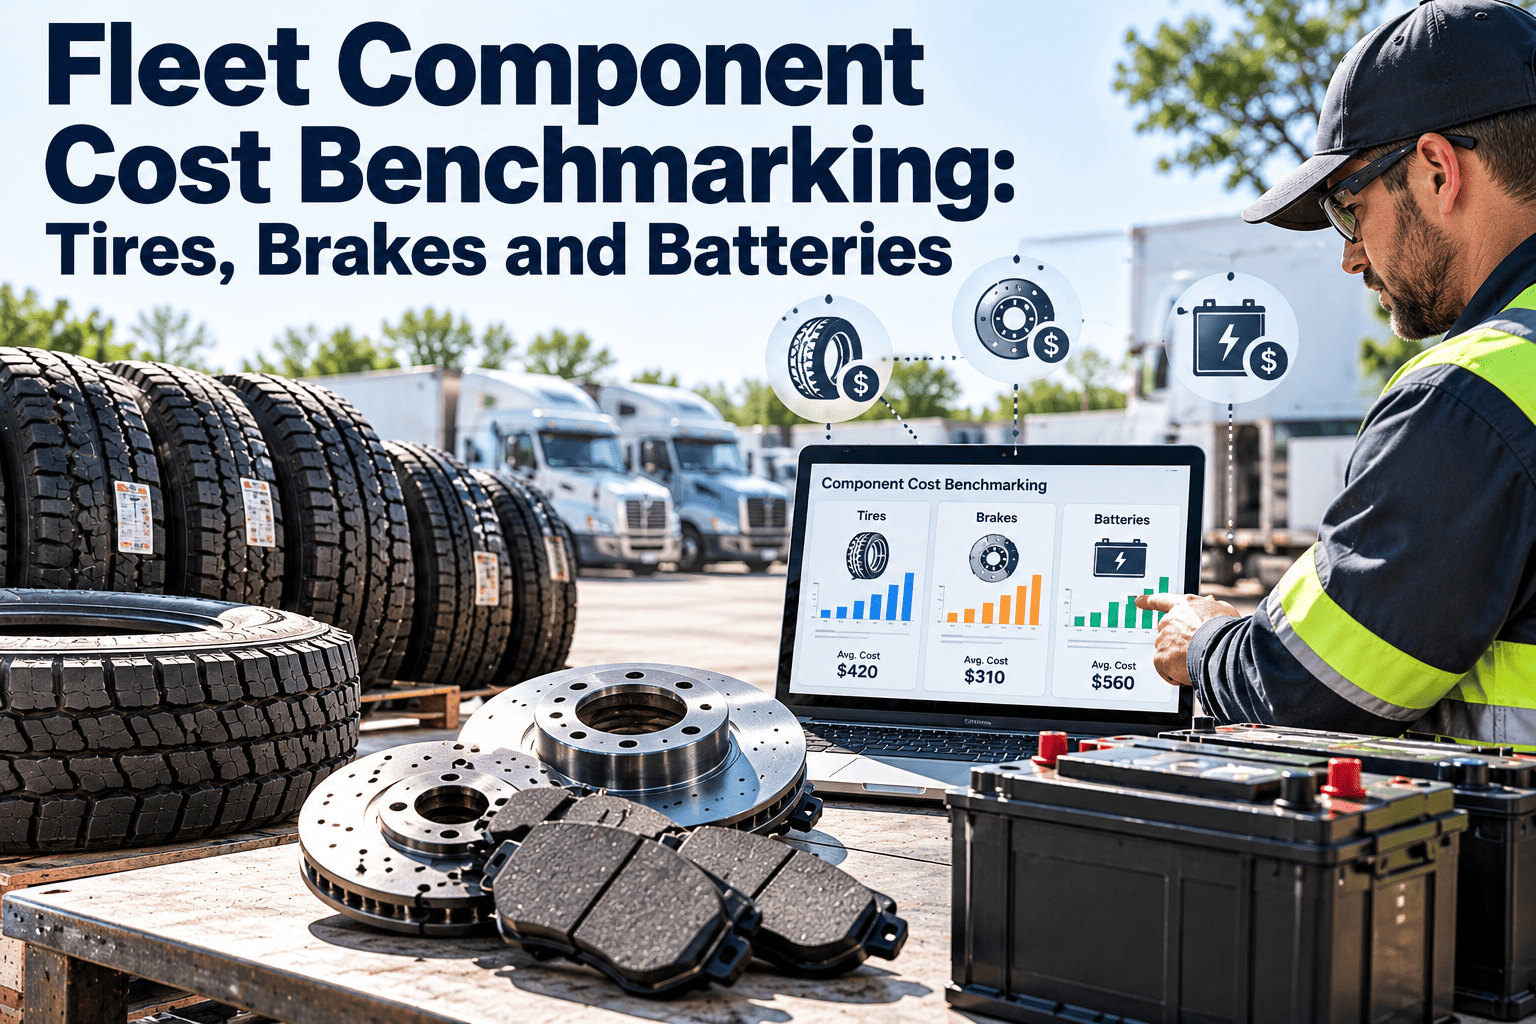
Tires 12%
Fluids 8%
Labor — technician hours, in-house or outsourced
Parts — components, filters, batteries, belts
Unscheduled repair — the category benchmarking exposes first
Tires — replacement, rotation, alignment
Fluids and filters — oil, coolant, hydraulic fluid
On a typical mixed-age fleet, the unscheduled repair slice is the one benchmarking is built to shrink — every point moved from reactive to planned maintenance compounds directly into a lower cost-per-mile figure.
Cost Per Mile Benchmark by Vehicle Segment
Benchmarking Your Fleet in Four Steps
1
Pull twelve months of cost data
Gather labor, parts, tires, fluids, and outsourced repair invoices by vehicle — not just a fleet-wide total.
2
Normalize to cost per mile per asset
Divide total maintenance cost by miles driven for each vehicle so age and usage differences stop distorting the comparison.
3
Compare against percentile bands
Map every vehicle against the 2026 industry bands to see which assets sit in the top quartile and which sit in the bottom.
4
Route outliers into corrective work orders
Flag bottom-quartile assets for a PM compliance review, a repair-vendor audit, or a replacement decision before the gap widens further.
Before we benchmarked cost per mile against industry percentiles, every maintenance conversation with finance was a debate about whether our number was reasonable. Now the dashboard shows exactly which trucks sit above the top-quartile line, and the conversation is about which three assets to fix — not whether the whole budget is bloated.
— Director of Fleet Operations, regional distribution carrier, 210-vehicle fleet
Frequently Asked Questions
What is a good fleet maintenance cost per mile benchmark for 2026?
The 2026 industry average is $0.202 per mile. Top-quartile fleets run between $0.12 and $0.18 per mile, and anything above $0.30 per mile signals a significant optimization opportunity worth investigating.
Why does cost per mile matter more than total maintenance spend?
Total spend hides usage differences — a vehicle running twice the miles will naturally cost more in absolute terms. Cost per mile normalizes for that, which is why it is the standard benchmarking metric across fleet finance.
How much can benchmarking and a CMMS actually reduce maintenance cost?
Fleets that move from reactive to structured, benchmark-driven preventive maintenance typically cut total maintenance spend by 25 to 35 percent in the first year.
Sign in to OxMaint to see this modeled against your own fleet data.
Does vehicle age change what benchmark I should target?
Yes. Vehicles over 10 years old cost roughly 5.5 times more per mile than vehicles under 5 years, so benchmarks should always be segmented by age band rather than applied fleet-wide.
How does OxMaint calculate cost-per-mile benchmarks automatically?
OxMaint captures labor hours, parts costs, and vendor invoices at every work order close, then divides by odometer or telematics mileage to produce a live cost-per-mile figure plotted against percentile bands.
Book a demo to see it against your fleet.
Know Exactly Where Your Fleet Ranks — Not Just What It Costs.
A maintenance bill without a benchmark is just a number. OxMaint turns it into a percentile you can defend in front of finance.


.png)