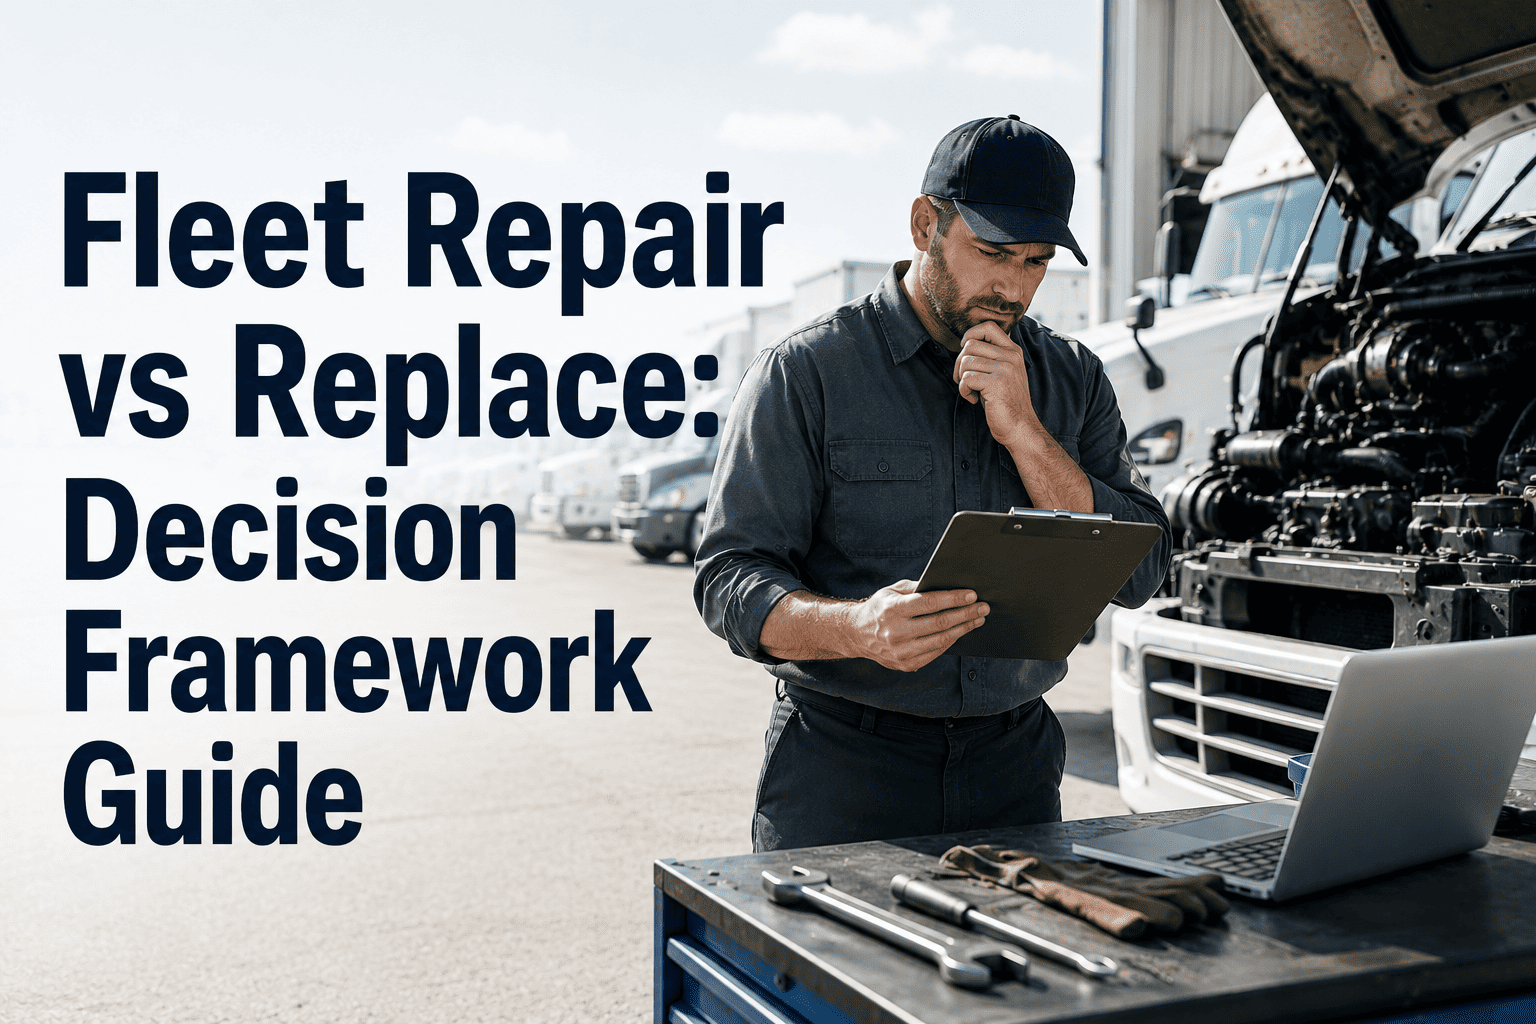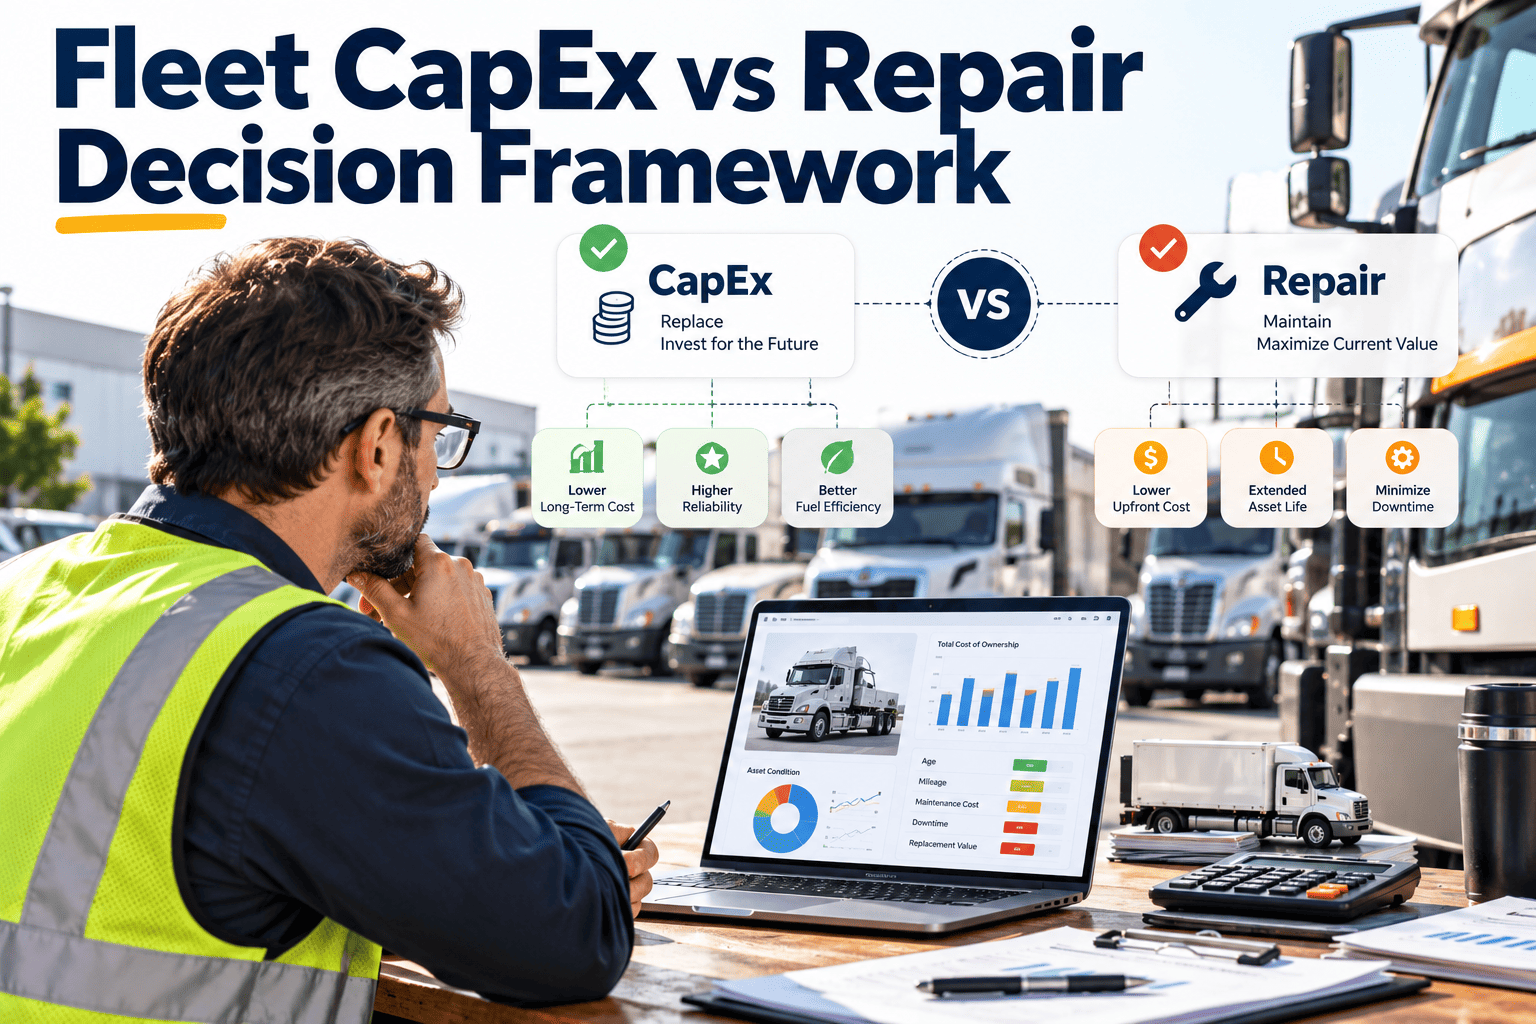
Every fleet has a few units that keep coming back to the shop. Each repair looks reasonable on its own work order, yet the unit's total spend quietly climbs past what a replacement would cost while downtime keeps hitting operations. Deciding when to stop repairing and start replacing is one of the most expensive judgment calls in fleet management, and it is usually made on instinct. This framework turns it into a repeatable decision using lifecycle cost, repair history and downtime impact, supported by fleet maintenance CMMS records that show what each vehicle has really cost.
Fleet CapEx vs Repair Decision Framework
A practical way to decide whether a vehicle deserves one more repair or a place in the capital plan, using repair history, lifecycle cost and operational risk instead of gut feel.
The Decision in One Glance
Why Repair Decisions Drift
- Invoices are judged one at a time. A manager approving a single repair rarely sees the unit's twelve-month history.
- Sunk cost thinking. Money already spent on a unit makes the next repair feel like protecting an investment rather than a fresh decision.
- Capital and maintenance budgets are separate. The maintenance team absorbs repair cost, while replacement needs a different approval path, so units stay too long.
- Downtime is invisible. Cost of substitute vehicles and lost service days is seldom recorded against the unit.
- Data lives in several places. Parts, labor, outside shop invoices and warranty claims are rarely totaled by VIN.
The Inputs You Need Per Unit
The framework only works when each unit has a clean cost record. Collect these inputs from work orders and asset records.
Acquisition and age
Purchase cost, in-service date, current mileage or engine hours, and expected service life for the vehicle class.
Repair history
Parts, labor and outside repair totals for the trailing twelve months and for the life of the unit.
Failure pattern
Repeat repairs on the same system, such as powertrain, aftertreatment or electrical, and any open recalls.
Downtime record
Days out of service, parts wait time and the cost of covering the route or job with another unit.
Replacement estimate
Current cost of an equivalent vehicle, expected residual value of the old unit and any upfit cost.
Operating cost change
Fuel economy, warranty coverage and emissions or technology differences in the new model.
Scoring a Unit Against Replacement Triggers
Set thresholds once as policy, then apply them consistently. The values below are examples for structure; your own numbers should come from your fleet's history.
| Trigger | How to measure | Example policy action |
|---|---|---|
| Cumulative repair ratio | Trailing twelve-month repair cost divided by replacement cost | Flag at a set ratio, review at a higher one |
| Cost per mile against class | Unit cost per mile versus class average | Review units well above class norm |
| Availability | Days out of service in the period | Review when availability misses target repeatedly |
| Major component age | Engine, transmission or body nearing rebuild | Compare rebuild cost with replacement |
| Safety or compliance risk | Recurring brake, steering or emissions defects | Escalate to immediate decision |
| Technology gap | Fuel use, telematics and warranty compared with current models | Weigh operating savings in the case |
Before and After: Moving to Lifecycle Decisions
Before: repair-by-repair approval
- Manager sees one estimate
- No view of twelve-month spend
- Downtime treated as a nuisance
- Replacement discussed only after a major failure
After: unit lifecycle review
- Approval screen shows unit history
- Repeat failures flagged automatically
- Downtime cost included in the case
- Replacement list built months ahead
Make Repair Versus Replace a Data Decision
Track every repair, part and hour against the unit so your capital planning reflects the true cost of keeping each vehicle on the road.
A Worked Approach, Step by Step
- Rank by exposure.Sort units by trailing repair cost and by days out of service. The top of both lists is your review pool.
- Separate cause from symptom.Group repeat repairs by system. Three unrelated repairs suggest age; three on the same system suggest a failing design, poor diagnosis or misuse.
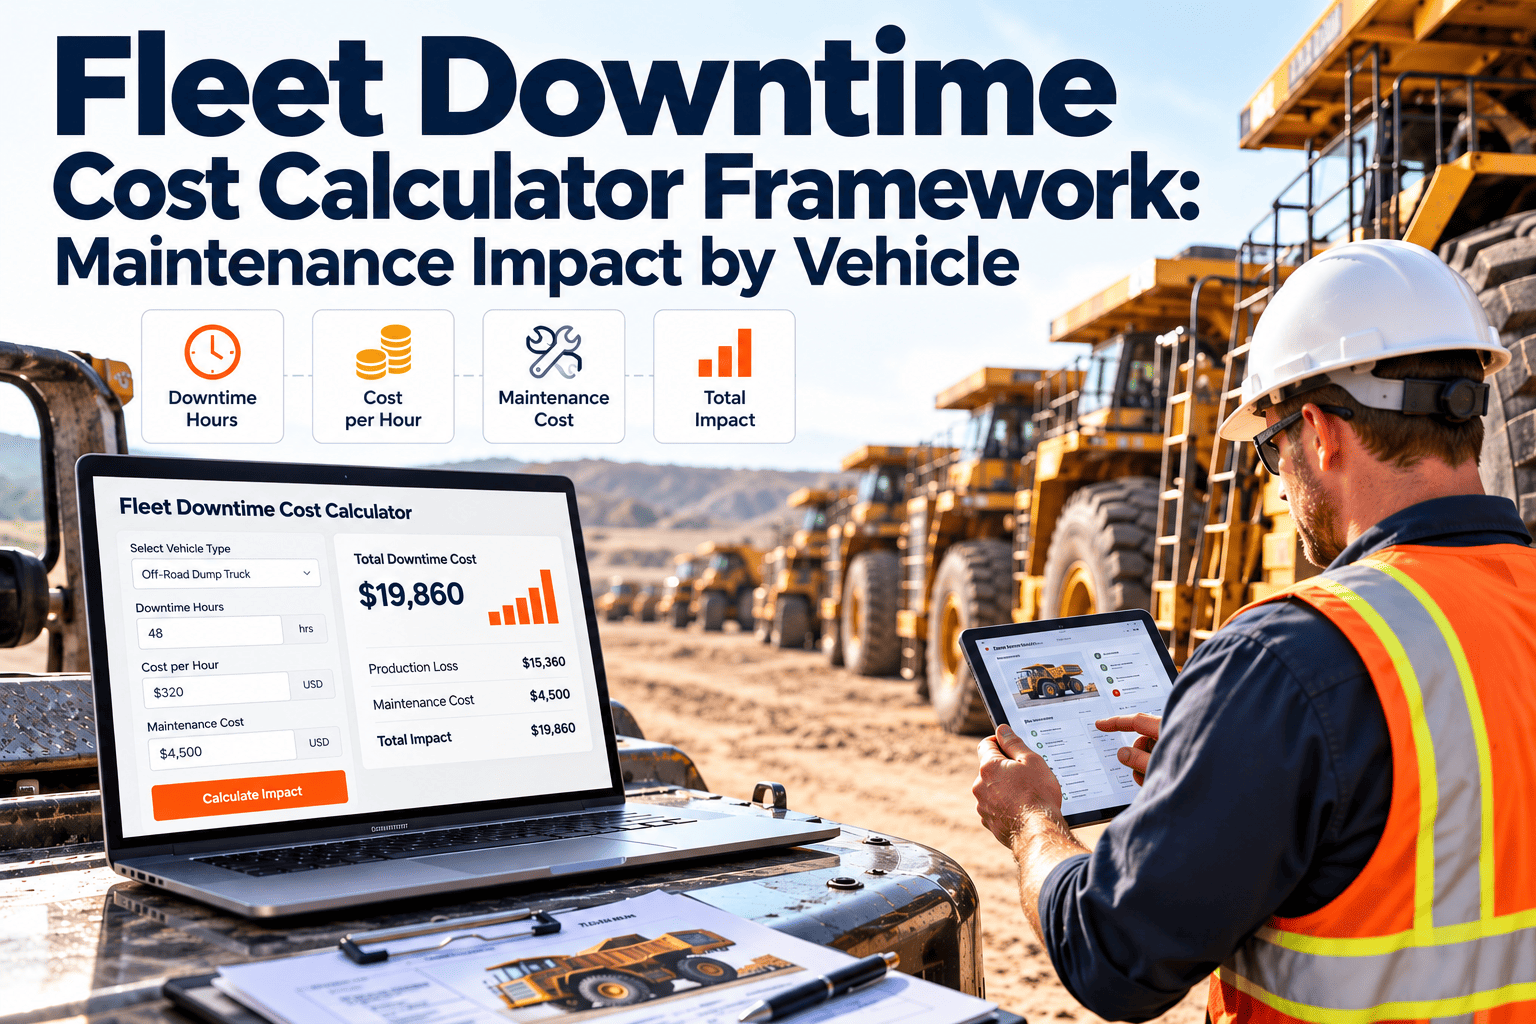
- Price the downtime.Add rental or substitute cost, overtime and missed service. Even a rough, consistent estimate beats ignoring it.
- Compare remaining life.Estimate what a repair buys. A transmission rebuild that restores several years differs from a patch that lasts weeks.
- Decide and document.Record the decision, owner and review date in the unit record so the reasoning survives staff changes.
What Each Outcome Means Operationally
Repair
Within thresholds, failure is isolated and the repair restores meaningful life.
Repair and watch
Approve the repair but place the unit on a watch list with a review date and tighter inspections.
Plan replacement
Add to the capital plan, limit major spend and keep the unit safe until delivery.
Accelerate
Safety or availability risk is high. Replace early and consider lease or short-term cover.
Data Quality Checklist Before You Trust the Numbers
- Every repair, including outside shop invoices, is entered against the correct VIN or unit number.
- Labor hours are logged on the work order, not estimated afterward.
- Warranty and recall work is flagged separately so it does not inflate cost.
- Failure and repair codes follow one standard across locations.
- Accident and abuse damage is separated from normal wear.
- Meter readings are captured at every work order so cost per mile is accurate.
Calculating Lifecycle Cost per Unit
Repair cost alone is a partial view. Lifecycle cost combines ownership, operating and downtime costs so that a newer unit with higher payments can be compared fairly with an older unit that is cheap to hold but costly to run.
| Cost element | What to include | Common mistake |
|---|---|---|
| Ownership | Purchase or lease payments, financing, expected residual value | Ignoring residual value that falls as repairs mount |
| Maintenance and repair | Parts, labor, outside repair, tires, tows | Leaving out outside invoices and roadside events |
| Fuel or energy | Fuel cost per mile for each unit | Assuming old and new units perform equally |
| Downtime | Substitute vehicles, overtime, missed service | Treating downtime as free |
| Insurance and registration | Annual premiums and fees where they differ by unit | Excluding them because they are not in the shop budget |
- Annual ownership cost = (purchase cost minus expected residual value) divided by years in service, plus financing.
- Annual operating cost = maintenance and repair + fuel + downtime cost + insurance differences.
- Compare the remaining annual cost of keeping the old unit with the annual cost of the replacement for the same period.
Illustration: Two Units, Same Age, Different Answers
| Question | Unit A | Unit B |
|---|---|---|
| Repair pattern | Unrelated repairs spread across several systems | The same aftertreatment and electrical faults repeat |
| Downtime | Short and predictable | Long, often waiting for diagnosis or parts |
| Safety exposure | No open safety defects | Recurring warning conditions raised by drivers |
| Major components | Powertrain in good condition | Engine approaching a rebuild decision |
| Likely decision | Repair and watch | Plan replacement and limit major spend |
A Capital Planning Calendar
- Quarter one: rank the fleet.Review lifecycle cost, repair ratio and availability by unit and class, and build the candidate list for replacement.
- Quarter two: confirm specifications and lead times.Vehicle build and delivery times can be long, so confirm specifications and supplier lead times early enough to avoid emergency decisions.
- Quarter three: submit the budget case.Present unit histories, projected repair cost for keeping each unit and the operating savings expected from replacement.
- Quarter four: order and prepare to dispose.Place orders, plan disposal of old units and update PM templates for the new models.
Special Cases That Change the Answer
Warranty and recalls
Work covered by warranty or recall should be flagged so it does not inflate repair ratios, but repeated failures still matter for reliability.
Accident-damaged units
Collision repair is a different cost category from wear. Separate it, then decide whether repaired structure and residual value justify keeping the unit.
Low-utilization units
A unit that rarely runs may be cheap per year but expensive per mile. Consider whether it should exist at all or be replaced by shared capacity.
Spare ratio and coverage
If spares are used to cover a troublesome unit, the true cost includes the spare vehicle that is no longer available for other work.
Leased units
Return conditions, mileage limits and early termination terms may make repair, swap or replacement decisions different from owned units.
Technology and emissions
Newer models may change fuel use, safety features and compliance obligations. Include these in the case when they apply to your operation.
Questions to Ask Before Approving a Major Repair
- What does the unit history show? Review twelve months of repairs, not only the estimate in front of you.
- Is the cause confirmed? Approving a repair without confirmed diagnosis often leads to the same failure returning.
- What will this repair buy? Estimate the remaining service life and compare it with the cost.
- What else is likely to fail next? Check age and condition of related systems before investing in one component.
- What does downtime cost? Include substitute vehicles and disruption, not only invoice cost.
- Who is accountable for the decision? Record the owner and a review date on the unit record.
Reading the Repair-to-Replacement Ratio in Practice
The numerator
Use total maintenance and repair cost for the unit over a defined window. Include parts, labor, outside repair, tires and towing. Exclude collision damage and warranty work if you want to see wear-related cost.
The denominator
Use the current cost of an equivalent replacement, not the original purchase price. Price changes between purchase and replacement can make an old unit look cheaper to keep than it is.
Trailing versus lifetime
Trailing twelve months shows current trend, while lifetime cost shows total investment. Look at both, because a unit with moderate lifetime cost but a sharp recent rise is a different case from one with steady spend.
Class-specific thresholds
Vehicle classes age differently. A policy ratio that suits a delivery van may be wrong for a heavy tractor, so set ratios per class using your own history and review them periodically.
Adjusting for age
Repair cost normally rises with age. Compare a unit with others of similar age in the same class, so an old unit is not flagged merely for being old when it is performing normally.
Review frequency
Run the ratio monthly for units on a watch list and quarterly for the rest of the fleet. Recalculate whenever a major repair is proposed, so the decision uses the latest data.
Documenting the Decision for Audit and Learning
A decision that is not recorded gets remade every quarter. Capture the reasoning on the unit record so the next reviewer starts from facts.
- The date, the person making the decision and the alternatives considered.
- The trailing and lifetime repair totals and the replacement estimate used.
- Downtime and substitute cost assumptions, with the source of each figure.
- Safety or compliance issues that influenced the outcome.
- The condition that would change the decision, such as another failure of the same system.
- A review date, so a repair-and-watch unit is checked rather than forgotten.
How Oxmaint Supports the Decision
Unit-level cost history
Work orders accumulate parts, labor and outside repair totals per asset, giving the cumulative figure that approvals normally lack.
Repeat failure visibility
Asset history makes it easier to spot the same component failing again and to challenge the diagnosis.
Preventive maintenance control
Scheduled services and inspections keep watch-list units safe and show whether deferred PM contributed to failures.
Reports for capital planning
Export cost per unit and per class to support budget requests with records instead of anecdotes.
Frequently Asked Questions
Stop Guessing When to Replace
Build the unit-level records that make every repair and replacement decision defensible to operations and finance.