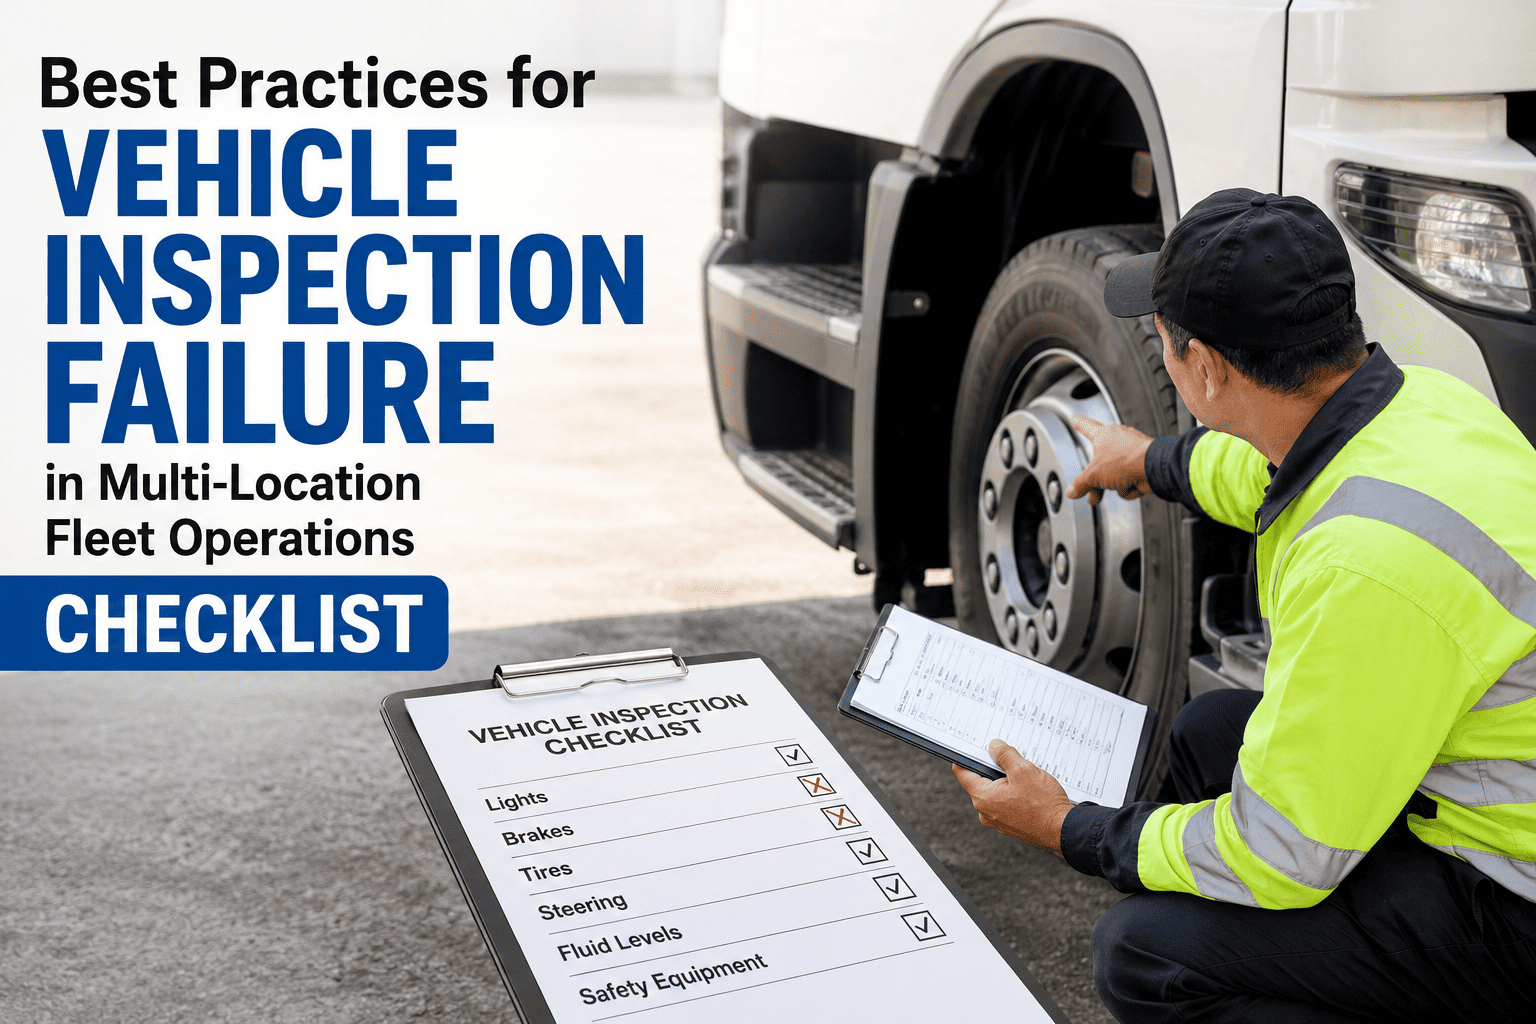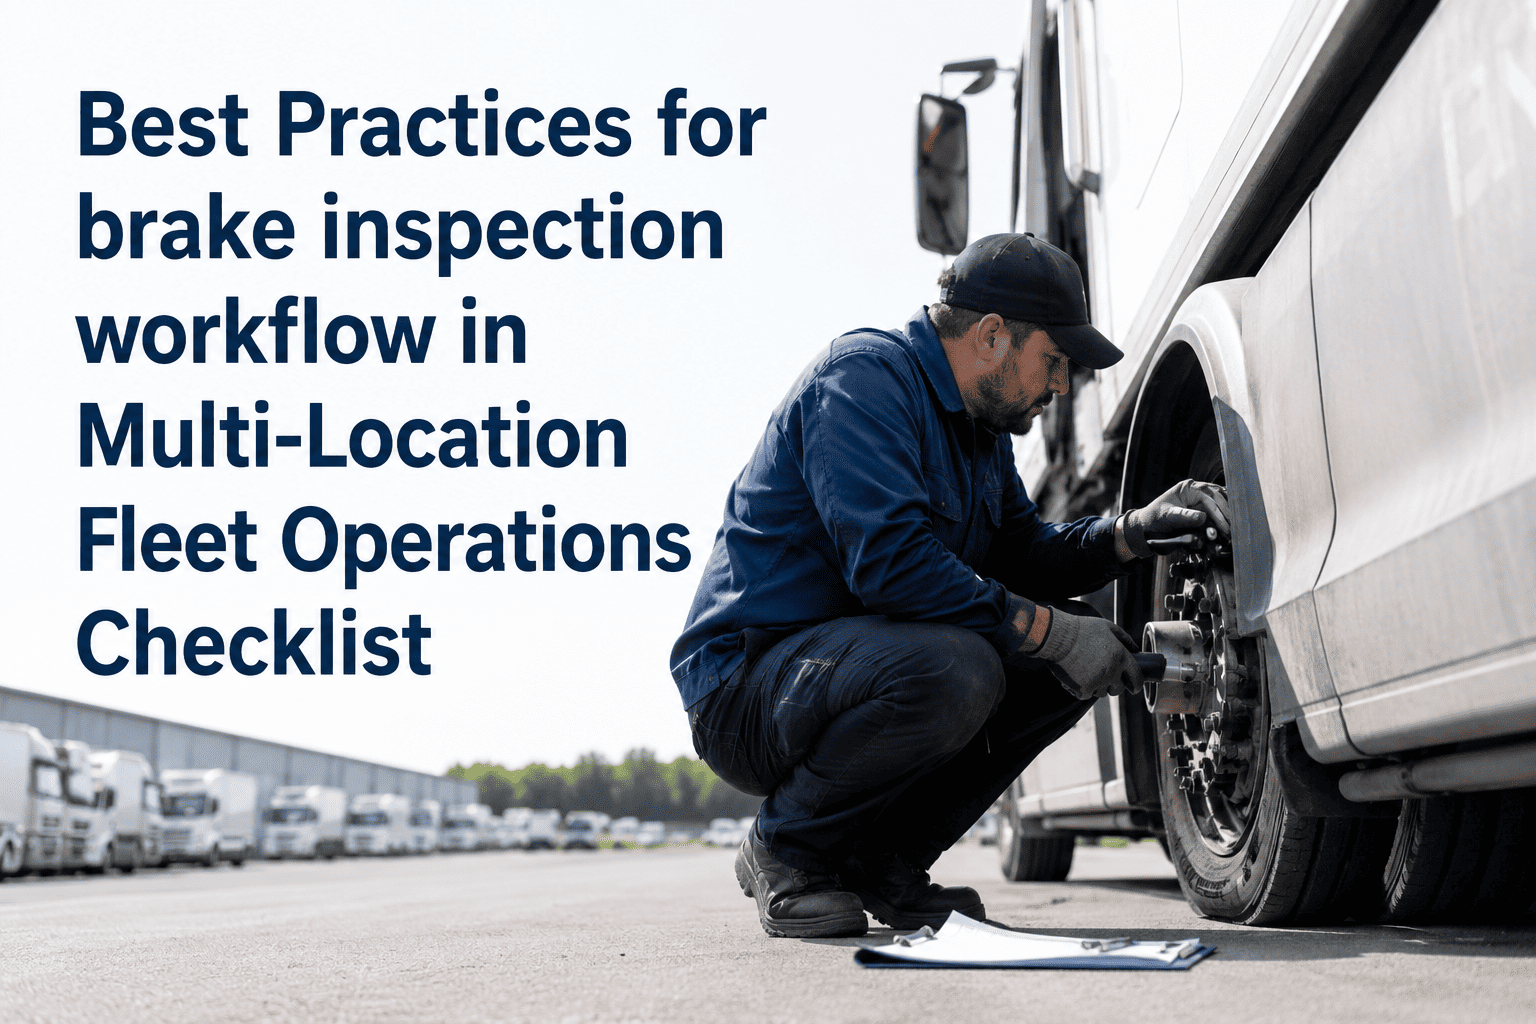
A fleet continuous improvement program for maintenance operations is a repeatable cycle of measuring, fixing and verifying how vehicles are inspected, serviced and repaired. Most shops already work hard, yet the same defects return, parts run short and records stay scattered across paper, spreadsheets and memory. A program turns that daily effort into steady gains in uptime and cost control. With a maintenance-first fleet maintenance software workflow, every improvement is tied to real work orders and asset history.
Fleet Continuous Improvement Program for Maintenance Operations
Stop repeating the same breakdowns. Build a measure, fix and verify loop that uses your inspections, work orders and asset history to raise uptime and lower cost per mile.
Why Fleet Maintenance Improvement Efforts Stall
Improvement usually fails for ordinary reasons, not lack of effort. Technicians fix the symptom, close the ticket and move to the next bay.
- Driver defects reported verbally or on paper that gets lost
- PM schedules based on habit instead of usage and duty cycle
- Repeat repairs treated as new, unrelated jobs
- Parts ordered after the vehicle is already down
- Reports built by hand at month end, then ignored
- Defects captured at inspection and converted to work orders
- PM intervals reviewed against failure and mileage data
- Repeat failures flagged and sent for root cause review
- Parts min and max levels tied to actual consumption
- Dashboards reviewed on a fixed weekly and monthly rhythm
The cost of staying reactive
- Unplanned downtime pulls vehicles off routes and forces costly substitutions.
- Emergency repairs and rush freight on parts cost more than planned work.
- Missed inspections create audit exposure and safety risk.
- Tribal knowledge leaves the shop when experienced technicians do.
The Five-Stage Improvement Loop
Each stage produces a record the next stage can use. Skip one and the loop breaks.
Build the Data Foundation Before You Chase Gains
Analysis is only as good as the records behind it. If failure descriptions are free text and vehicles are named inconsistently, patterns stay hidden.
- One asset record per vehicle and trailer, with VIN, unit number, class, in-service date and assigned site
- A short, agreed list of failure codes and system categories such as brakes, electrical, cooling, tires and exhaust
- Meter readings captured on every work order and inspection
- Labor hours and parts recorded against the job, not in a separate note
- Close-out notes that state the cause and the fix, not only the word "repaired"
- Warranty status noted so eligible claims are not missed
Why technician close-out notes matter
- A note such as "replaced air line" is weak, while "chafed air line at frame bracket, rerouted and added clamp" can be searched and trended.
- Consistent wording lets reports group similar failures across shops and shifts.
- Short mobile prompts make good notes quick enough that technicians will complete them every time.
KPIs That Show Whether the Program Works
Pick a short list and review it on a schedule. Too many metrics hide the signal.
| KPI | What It Reveals | Data Source | Review |
|---|---|---|---|
| PM compliance rate | Whether scheduled service is actually completed on time | PM work orders | Weekly |
| Repeat repair rate | Fixes that did not address the real cause | Asset history by failure code | Monthly |
| Vehicle availability | Share of fleet ready for service | Downtime logs | Daily |
| Planned vs unplanned ratio | How reactive the shop remains | Work order type | Monthly |
| Backlog age | Deferred defects waiting too long | Open work orders | Weekly |
| Cost per mile or hour | Lifecycle cost trend by vehicle class | Labor, parts, usage | Quarterly |
| Parts stockout rate | Delays caused by missing parts | Inventory and work orders | Monthly |
Put Your Baseline Into One System
Start tracking inspections, work orders and asset history in one place so every improvement has data behind it.
Finding Root Causes in Repeat Repairs
A repeat repair is the clearest sign that a fix treated the symptom. Use asset history to decide where to dig first.
Questions to ask for each recurring failure
- Was the failure code recorded consistently across technicians?
- Does the problem cluster in one model year, route, driver group or shop?
- Was the correct part used, and did it come from a reliable source?
- Was a PM task skipped, or is the task list missing a check?
- Did the inspection catch early warning signs that nobody acted on?
Choosing Which Improvement to Tackle First
A long list of ideas can freeze a team. Rank each idea by expected benefit and effort, then start with the quick wins.
Illustrative scenario: a recurring brake defect
This is a hypothetical example, not a customer case study, showing how one loop might run.
Tuning Preventive Maintenance Instead of Just Doing More
Adding tasks everywhere raises cost without raising reliability. Improve PM by matching it to how each vehicle works.
- Set intervals by mileage, engine hours or calendar, whichever fits the duty cycle.
- Separate severe-service vehicles such as idle-heavy or stop-and-go units from highway units.
- Remove tasks that never find anything, and add checks where failures keep appearing.
- Bundle PM with open defects so a vehicle visits the bay once, not three times.
- Track PM findings, since a rising number of findings per service often signals a deeper issue.
Inspections as the Front End of Improvement
Driver and pre-trip inspections are the earliest data source in the shop. Paper forms delay that data and often lose it.
Compliance and record keeping
In the United States, motor carriers covered by the FMCSA rules must keep systematic inspection, repair and maintenance records, and driver vehicle inspection reports where required. Local rules vary, so confirm what applies to your operation.
- Vehicle identification and ownership details
- Inspection, repair and maintenance dates with the work performed
- Driver defect reports and proof of correction
- Annual inspection documentation where required
- Technician and sign-off details for each job
Using Asset History for Lifecycle and Replacement Decisions
Continuous improvement is not only about repairs. The same history that exposes repeat failures also shows when a vehicle has stopped paying its way.
- Compare cumulative repair cost and downtime by vehicle against others in the same class.
- Flag units whose cost per mile keeps rising after PM and repair improvements.
- Note which models, engines or components cause the most road calls, and feed that into purchasing specifications.
- Review warranty claims so early failures are recovered rather than absorbed.
Training as an improvement lever
- Use repeat-failure findings to build short toolbox talks for technicians and drivers.
- Teach drivers what a useful defect report looks like, including location, symptom and when it started.
- Pair newer technicians with experienced ones on the failure modes that recur most often.
- Update checklists first, then train, so the written standard and the practice stay aligned.
Parts, Inventory and Technician Time
Downtime often comes from waiting, not wrenching. Two areas deserve a regular review.
- Link parts to work orders so usage is visible
- Set reorder points for fast movers such as filters, belts and brake components
- Track parts that are repeatedly returned or fail early
- Count high-value items on a cycle
- Compare estimated and actual hours by job type
- Schedule PM in low-demand windows
- Assign by skill and certification
- Watch waiting time between steps, not only wrench time
Technology Trends Supporting Continuous Improvement
Telematics, fault codes and mobile tools now feed maintenance teams data that used to require manual collection.
- Odometer and engine hour feeds can trigger PM work orders based on real usage.
- Diagnostic trouble codes can open corrective work orders before a breakdown.
- Mobile access lets technicians update jobs, parts and photos at the vehicle.
- Electric and mixed fleets add new inspection needs, such as battery and charging checks.
- Condition-based triggers work best after a clean PM and history foundation exists.
A 90-Day Rollout Plan
Start small and prove value before expanding across every shop.
Roles and Review Rhythm That Keep Improvement Alive
Programs fade when nobody owns the review. Assign each meeting an owner, a data set and an expected output.
| Review | Participants | Focus | Output |
|---|---|---|---|
| Daily huddle | Shop lead, technicians | Vehicles down, parts holds, today's priorities | Updated bay assignments |
| Weekly backlog review | Maintenance supervisor, planner | Aging defects, overdue PMs, parts shortages | Cleared or rescheduled work orders |
| Monthly reliability review | Fleet manager, shop lead | Repeat repairs, planned versus unplanned work | Root cause actions with owners |
| Quarterly planning | Operations, finance, maintenance | Cost per mile, replacement candidates, training needs | Updated targets and budget requests |
Ownership rules that help
- Every improvement action has one named owner and a due date.
- Actions are logged where the team already works, not in a separate document.
- Results are reported back at the next review, even when the outcome is negative.
- Drivers and technicians are asked for input, since they see failures first.
Common Mistakes That Slow Improvement
Most stalled programs share a handful of avoidable habits.
- Tracking too many KPIs, so no one knows which number matters.
- Changing several variables at once, which makes results impossible to read.
- Letting backlog grow while the team debates reports.
- Collecting data in several systems that never reconcile.
- Skipping the verify stage, so changes are never confirmed or reversed.
- Treating the program as a one-time project instead of a standing routine.
- Ignoring night and weekend shifts, where many repeat defects first appear.
- Letting inspection findings sit unassigned instead of converting them into work orders.
- Setting targets without first agreeing how each metric is calculated, which leads to arguments over the numbers instead of action on them.
- Forgetting to celebrate and share gains, which weakens support from technicians and drivers.
How Oxmaint Supports the Program
Oxmaint is a CMMS that keeps improvement work connected to daily maintenance records.
- Asset management stores each vehicle, its history and recurring issues.
- Preventive maintenance scheduling supports usage and calendar-based triggers.
- Work orders capture defects, labor, parts and completion notes.
- Inspection checklists and mobile workflows move findings out of the cab and into the shop.
- Inventory tracking and reports show stock use, backlog and cost trends.
Frequently Asked Questions
Turn Daily Repairs Into Lasting Fleet Improvement
Give your shop one place for inspections, work orders, parts and history, then improve it every month with real data.