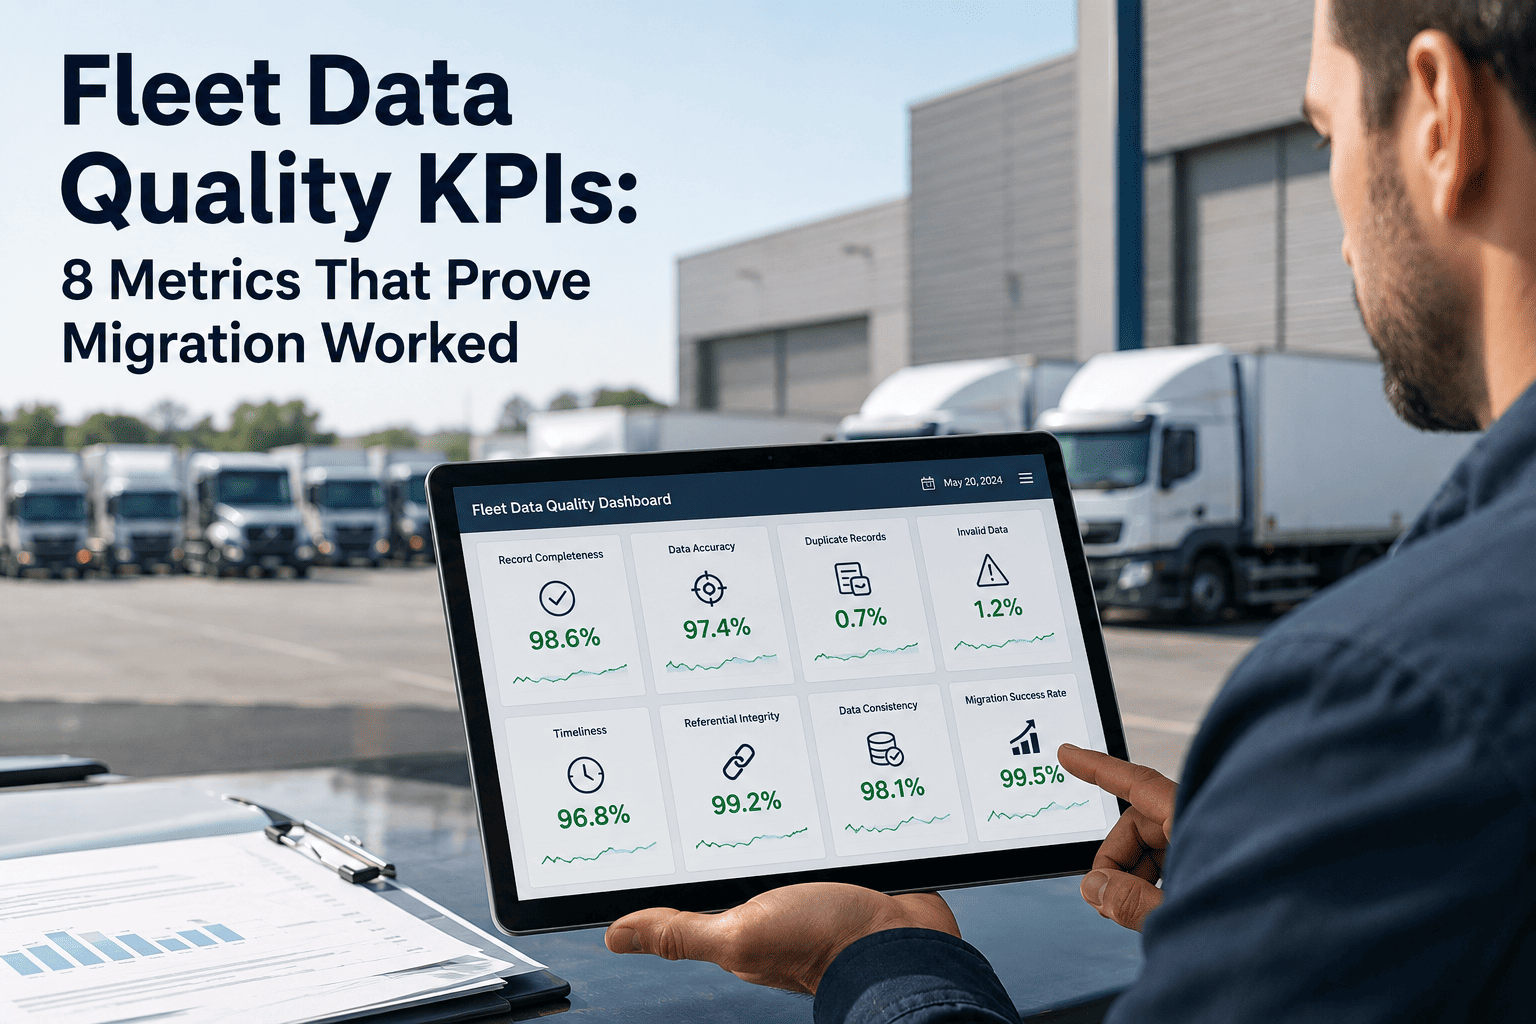
A CMMS migration is only successful if the data inside it is actually trustworthy — and "we moved everything over" is not a metric anyone can act on. Fleet and maintenance leaders who sign off on a migration without measuring data quality routinely discover, six months later, that duplicate assets are still inflating parts spend and that half their preventive maintenance schedules never made the jump correctly. Proving a migration worked requires the same rigor as proving a fleet is safe: specific, measurable, repeatable numbers. This guide walks through eight KPIs that separate a migration that merely finished from one that actually improved fleet data quality, plus the benchmarks that tell you whether your numbers are healthy or hiding a problem. If your team is still eyeballing spreadsheets to judge a migration's success, start a free trial with OxMaint and see what a measured, audit-ready data set looks like.
8 KPIs That Prove Your Fleet Data Migration Actually Worked
Duplication rate, completeness, timeliness, and five more measurable indicators that tell you whether your new CMMS holds better data than the system it replaced — or just moved the same mess somewhere new.
The Four KPIs That Measure Whether Your Data Is Structurally Sound
These four metrics look at the data itself, independent of how anyone uses it day to day. They answer a simple question: is what's stored in the new system actually correct, complete, and non-redundant?
The percentage of asset, vehicle, or driver records that exist more than once under different names or IDs. Duplicates inflate parts inventory counts and split maintenance history across two incomplete records instead of one accurate one.
The share of required fields — VIN, odometer, purchase date, warranty status — that are actually populated rather than left blank or defaulted. Incomplete fields are the leading cause of reporting errors after migration.
How current maintenance, inspection, and mileage records are relative to when the underlying event happened. A system full of accurate but three-week-old data still produces wrong maintenance scheduling decisions today.
Work orders, parts transactions, or inspection entries that reference a vehicle or asset ID no longer present in the system. Orphan records are the clearest sign of a rushed migration mapping that broke relationships between tables.
The Four KPIs That Measure Whether People Actually Trust and Use the Data
A migration can be technically flawless and still fail if the fleet team does not trust or use the new system. These four metrics measure adoption, consistency, and the audit integrity that regulators and insurers actually check.
Whether the same vehicle's mileage, status, and assignment match across the CMMS, telematics platform, and fuel card system. Inconsistent numbers between systems are usually the first thing that erodes team trust in a new platform.
The share of technicians and drivers actually logging work orders and inspections in the new system versus falling back to paper or spreadsheets. Low adoption quietly recreates the exact data gaps the migration was meant to fix.
Whether every record change is attributed to a user and timestamp, or whether edits can be made silently. Insurers and safety auditors increasingly ask for this specifically, and it cannot be retrofitted after the fact.
How quickly flagged errors — a duplicate, a missing field, an orphan record — actually get fixed once identified. A high error count with fast correction velocity is healthier than a low error count nobody is watching.
Migration Data Quality Benchmarks at a Glance
Use this table as a scorecard during the first ninety days after migration. Any metric sitting in the red-flag column deserves attention before it hardens into a permanent habit across the fleet team.
| KPI | What It Measures | Healthy Benchmark | Red Flag | How OxMaint Tracks It |
|---|---|---|---|---|
| Duplication Rate | Repeated asset or driver records | Under 2% | Above 8% | Automated duplicate detection on import |
| Field Completeness | Required fields populated | Above 95% | Below 80% | Live completeness dashboard per asset type |
| Timeliness | Event-to-record lag | Under 24 hours | Over 1 week | Mobile logging with GPS-stamped timestamps |
| Orphan Records | Broken record relationships | Under 1% | Above 5% | Referential integrity checks on every entry |
| Cross-System Match | Consistency across platforms | Under 3% variance | Over 15% variance | Native telematics and fuel card sync |
| User Adoption | Active logging by technicians | Above 90% by day 60 | Below 60% | Per-user activity reporting |
| Audit Trail | Attributed, timestamped edits | 100% coverage | Any untracked edits | Immutable change log on every record |
| Correction Velocity | Speed of fixing flagged errors | Under 5 days | Over 30 days | Flagged-record queue with owner assignment |
Most fleets discover data quality problems the hard way, months after go-live, when a report doesn't match reality. Measuring these eight KPIs from week one turns that discovery into a routine check instead of a crisis.
What a Well-Measured Migration Actually Improves
These are the typical shifts fleets report when they track data quality KPIs through the first ninety days rather than assuming the migration succeeded because the go-live date passed without incident.
How OxMaint Keeps Migration Data Quality Measurable, Not Assumed
Every KPI in this guide requires infrastructure most legacy CMMS platforms were never built to provide. OxMaint generates the tracking automatically as part of daily operations.
Asset and driver records are automatically screened for duplicates during migration and every subsequent bulk import, flagging likely matches for review instead of silently creating a second version of the same vehicle.
Required fields are tracked per asset type in a live dashboard, so gaps in VIN, warranty, or odometer data are visible immediately rather than discovered when a report comes back wrong.
Mobile inspection and work order entries are timestamped and location-verified the moment they happen, keeping the event-to-record lag consistently under the healthy 24-hour benchmark.
Every edit is attributed to a user and timestamp automatically, satisfying the audit-trail integrity insurers and safety auditors increasingly request without any extra logging step from the team.
What Measured Migrations Report at the Ninety-Day Mark
Typical duplicate rate once automated detection runs across every migrated and newly imported record.
Required-field completion rate fleets reach with a live dashboard flagging gaps in real time.
Active logging rate reached by day 60 when mobile entry replaces paper and spreadsheets.
Share of record edits attributed to a user and timestamp, satisfying insurer and regulator requests.
Fleet Data Quality — What Operations Teams Ask After Go-Live
How soon after go-live should we start measuring these KPIs?+
Which of these eight KPIs matters most if we can only track a few?+
What causes a high orphan record rate after migration?+
Does low user adoption really affect data quality metrics?+
How long should we keep monitoring before calling the migration successful?+
OxMaint tracks duplication, completeness, timeliness, and audit trail integrity automatically from the moment your fleet data lands in the system, turning migration success from a guess into a measurable, ninety-day scorecard.