Fleet operations without a structured KPI dashboard run blind. Industry data shows that fleets tracking 15+ performance metrics in real-time achieve 24% lower cost-per-mile and 31% higher vehicle uptime than fleets relying on monthly spreadsheet reports. A proper fleet KPI dashboard consolidates uptime, MTBF, PM compliance, fuel efficiency, and 16 other critical metrics into one visual control center — giving fleet managers the data they need to act fast, justify budgets, and prove ROI to executives. Ready to replace your manual reports with a live, automated dashboard? Start a free trial with Oxmaint to see the built-in fleet KPI dashboard, or book a demo for a walkthrough customized to your fleet size.
FLEET ANALYTICS · KPI TEMPLATE · 2026
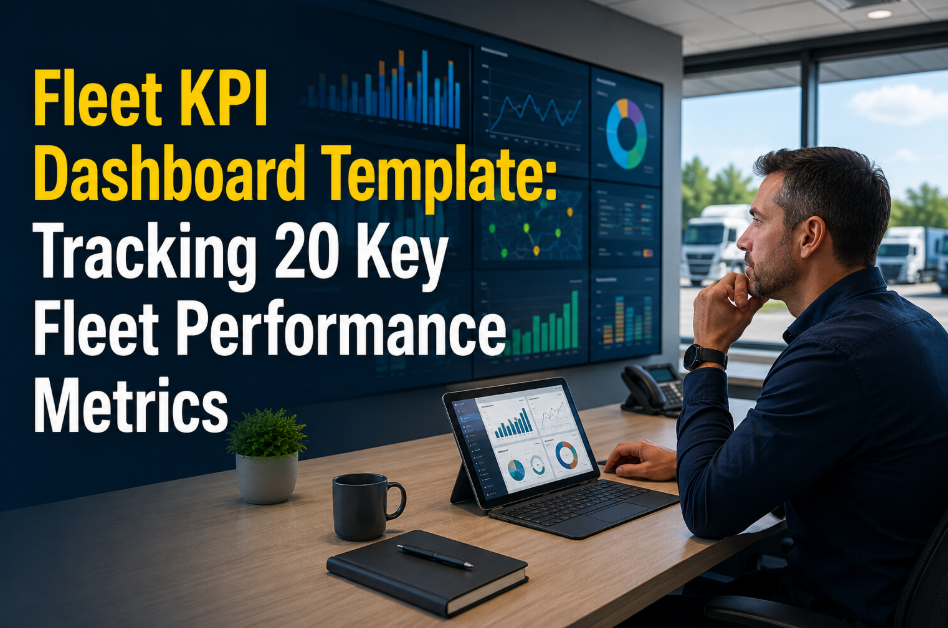
Fleet KPI Dashboard Template: Track 20 Performance Metrics That Drive Real Results
A complete framework covering uptime, cost-per-mile, MTBF, PM compliance, fuel efficiency, and 15 more — formatted for Excel, Google Sheets, and live CMMS dashboards.
For fleets tracking 15+ KPIs in real-time vs. monthly reports
31%
higher vehicle uptime
When fleet managers monitor live dashboards daily
$0.18
average savings per mile
Achieved through data-driven maintenance and routing decisions
3.5x
faster decision cycles
Live dashboards eliminate weeks of spreadsheet compilation
What Is a Fleet KPI Dashboard?
A fleet KPI dashboard is a visual analytics tool that aggregates real-time performance metrics across your entire vehicle operation. It consolidates data from telematics, CMMS work orders, fuel cards, and driver logs into one screen — showing exactly how your fleet is performing right now, not last month.
Without a dashboard, fleet managers spend 6-10 hours per week compiling reports from disconnected systems. With one, those same managers spend that time fixing the issues the data exposes. The shift from reactive reporting to proactive decision-making is where measurable ROI begins. Start a free trial to access pre-built dashboards, or book a demo to see live fleet analytics in action.
The 20 Essential Fleet KPIs You Must Track
These 20 metrics are grouped into four categories — operational, financial, maintenance, and safety. Each one drives a specific business decision and should appear on your dashboard with current value, target threshold, and trend indicator.
Category
KPI Metric
Target Benchmark
Why It Matters
Operational
Vehicle Uptime %
95%+
Direct revenue impact per asset
Operational
Asset Utilization Rate
78-85%
Right-sizes fleet count
Operational
Average Vehicle Age
Under 7 years
Predicts replacement timing
Operational
Miles Per Vehicle/Month
Class-dependent
Identifies underused assets
Operational
Vehicle Availability Rate
96%+
Operational readiness measure
Financial
Cost Per Mile (CPM)
$0.12-0.22
Master profitability metric
Financial
Maintenance Cost Per Mile
$0.04-0.08
Shop efficiency indicator
Financial
Fuel Cost Per Mile
Diesel: $0.45-0.62
Largest variable cost
Financial
Total Cost of Ownership
Asset-dependent
Lifecycle financial truth
Financial
Parts Cost Variance
Within 5% of budget
Inventory and procurement health
Maintenance
PM Compliance Rate
95%+
Predicts future breakdowns
Maintenance
MTBF (Hours)
Asset-dependent
Reliability indicator
Maintenance
MTTR (Hours)
Under 4 hours
Shop responsiveness
Maintenance
First-Time Fix Rate
90%+
Technician skill measure
Maintenance
Reactive vs Planned Ratio
20:80 or better
Maintenance maturity score
Maintenance
Work Order Backlog
Under 2 weeks
Shop capacity indicator
Safety
Accident Rate Per Million Miles
Under 0.8
Insurance and liability driver
Safety
DVIR Defect Rate
Under 12%
Pre-trip inspection quality
Safety
CSA BASIC Score
Under intervention threshold
FMCSA compliance signal
Safety
Driver Hours of Service Violations
Zero
DOT compliance non-negotiable
6 Most Critical KPIs Explained
While all 20 metrics matter, these six drive the largest financial and operational decisions in any fleet operation. Track these first if you are building a dashboard from scratch.
Vehicle Uptime Percentage
Tier 1
Calculated as (available hours / total hours) × 100. Top-quartile fleets achieve 95%+ uptime. Every 1% improvement on a 100-vehicle fleet generates $180,000-$340,000 in annual revenue capacity. This is the single metric most often presented to executives.
Cost Per Mile (CPM)
Tier 1
The master profitability metric. Combines fuel, maintenance, depreciation, insurance, and labor divided by total miles. Best-in-class light-duty fleets run $0.45-0.55 CPM; Class 8 fleets run $1.65-1.95. Reducing CPM by $0.05 saves $50,000 per million miles driven.
PM Compliance Rate
Tier 1
Percentage of preventive services completed on schedule. Fleets above 95% PM compliance experience 60% fewer roadside breakdowns. Below 80% compliance, breakdown rates triple and warranty claims get rejected. This metric predicts every other maintenance KPI.
MTBF (Mean Time Between Failures)
Tier 1
Average operating hours between unplanned failures. Higher MTBF means better reliability and lower reactive maintenance spend. Track by asset class to identify problem units. A 20% MTBF improvement typically cuts emergency repair costs by $14,000-$22,000 per 50 vehicles annually.
Fuel Efficiency (MPG)
Tier 2
Tracked per vehicle and per driver. Fuel is 30-40% of operating cost. A 0.5 MPG improvement on a Class 8 tractor saves $3,800 annually at current diesel prices. Outlier drivers consuming 15%+ more fuel than peers represent immediate coaching opportunities.
Accident Rate Per Million Miles
Tier 2
Directly drives insurance premium calculations. Industry benchmark is under 0.8 per million miles for commercial fleets. Each preventable accident costs an average of $74,000 when factoring in repair, downtime, increased premiums, and potential litigation exposure.
Why Spreadsheet-Based KPI Tracking Fails
Manual fleet reporting in Excel is a productivity tax. Data lives in 4-6 different systems — telematics, fuel cards, CMMS, driver logs, accounting — and merging them weekly consumes an entire workday. By the time the report is ready, the data is already stale.
Worse, manual reports rarely surface outliers. A single vehicle running at $0.42 CPM when the fleet average is $0.18 gets buried in averages. Live dashboards highlight these problem units immediately — letting managers act this week, not next month. Start a free trial to replace your spreadsheets, or book a demo to see automated KPI tracking.
Manual Reports vs. Live Dashboards
Manual Spreadsheet Reporting
Report compilation: 6-10 hours weekly
Data freshness: 7-30 days old
Outlier detection: Rare, after-the-fact
Drill-down capability: Limited to source files
Executive presentation: Static slides
Decision speed: Weeks per intervention
Live Oxmaint KPI Dashboard
Report compilation: Zero — auto-generated
Data freshness: Real-time, updated continuously
Outlier detection: Automated alerts on threshold breaches
Most fleets can deploy a complete KPI dashboard within 30 days using this four-phase approach. Each phase builds on the previous one — do not skip steps.
30-Day KPI Dashboard Rollout Plan
From data audit through full deployment with executive reporting
Week 1 — Data Source Audit
Map every data source feeding your KPIs
Inventory telematics, fuel cards, CMMS, accounting, and driver log systems. Identify data gaps and determine which KPIs you can calculate today versus which require new data collection. Define ownership for each data source.
Week 2 — Integration Setup
Connect data sources to dashboard platform
Configure API integrations between Oxmaint and your telematics provider, fuel card vendor, and accounting system. Test data flow accuracy. Establish refresh frequencies — most KPIs update hourly; financial metrics update daily.
Week 3 — Benchmark and Threshold Setting
Establish target values and alert triggers
Set target benchmarks for each KPI based on industry data and your historical performance. Configure automated alerts — for example, notify the fleet manager when any vehicle drops below 90% uptime or any driver exceeds 12% fuel variance.
Week 4 — Rollout and Training
Deploy dashboards to operations and executive teams
Train fleet managers on daily dashboard review routines. Build executive summary views for monthly leadership reporting. Schedule first 30-day performance review to validate dashboard accuracy and adjust thresholds based on real operating data.
How Oxmaint Powers Fleet KPI Tracking
Pre-Built Fleet KPI Templates
All 20 essential fleet KPIs are pre-configured in Oxmaint with industry-standard calculations and benchmark targets. Deploy a complete dashboard in hours, not weeks, with no custom development needed.
Telematics and Fuel Card Integration
Native connectors to Geotab, Samsara, Verizon Connect, WEX, and Comdata pull real-time vehicle, fuel, and driver data automatically. No manual data entry. No reconciliation work.
Threshold Alerts and Outlier Detection
Automated alerts notify managers the moment any vehicle, driver, or KPI breaches your defined thresholds. Problem assets surface immediately — no waiting for end-of-month reports.
Drill-Down by Vehicle, Driver, Route
Click any KPI to drill into the underlying data — by individual vehicle, driver, route, depot, or technician. Identify exactly which units, people, or processes are driving aggregate performance.
Executive Reporting Suite
Auto-generated monthly and quarterly executive summaries with trend analysis, variance commentary, and forecast projections. Share live dashboard links with VPs and CFOs — no PowerPoint required.
Multi-Site Portfolio Rollups
For multi-depot fleets, compare KPI performance across locations side-by-side. Identify your best-performing sites and replicate their practices across underperforming locations.
ROI Impact of Live KPI Dashboards
$42K
avg. annual savings per 50 vehicles
From earlier intervention on outlier units
340
hours/year reclaimed
Per fleet manager from automated reporting
27%
reduction in reactive repairs
After 90 days of active KPI monitoring
96%
executive adoption rate
Of live dashboards vs. 31% for monthly reports
Building Dashboards That Drive Action, Not Just Information
A dashboard that just displays data is wasted screen space. The best fleet KPI dashboards surface decisions — they tell the manager what to do, not just what is happening.Every KPI on your dashboard should have a defined action when it crosses a threshold. If PM compliance drops below 92%, the assigned response is a same-day shop review. If a vehicle drops below 88% uptime, the response is an immediate engineering investigation. This action-orientation is what separates dashboards that drive ROI from those that just collect dust. Start a free trial to deploy action-driven dashboards, or book a demo to discuss your specific KPI priorities.
Frequently Asked Questions
Can Oxmaint pull data from our existing telematics provider?
Yes, Oxmaint has native API integrations with Geotab, Samsara, Verizon Connect, Motive, and 15+ other major telematics platforms. Vehicle data including mileage, engine hours, fuel consumption, and fault codes flows directly into the KPI dashboard with no manual entry required.
How long does it take to deploy a complete fleet KPI dashboard?
Most fleets complete full deployment within 30 days using our four-phase rollout plan. Pre-built KPI templates eliminate custom development, and our integration team handles telematics and fuel card connections during week 2.
Can we customize KPI thresholds for different vehicle classes?
Yes, every KPI threshold can be configured by vehicle class, depot, route type, or any other segmentation. Class 8 tractors and light-duty service vans need different benchmarks — Oxmaint respects that.
Does the dashboard support multi-site fleet operations?
Yes, multi-site portfolio rollups are built-in. Compare KPI performance across depots, regions, or business units. Drill down from portfolio-level to individual vehicle in three clicks. Executive views aggregate all sites into one summary dashboard.
Replace Spreadsheets with Live Fleet Intelligence
Join fleet operations teams across 40+ countries using Oxmaint to track 20+ KPIs in real-time, automate reporting, and cut cost-per-mile by 24%. Free trial, no credit card required.