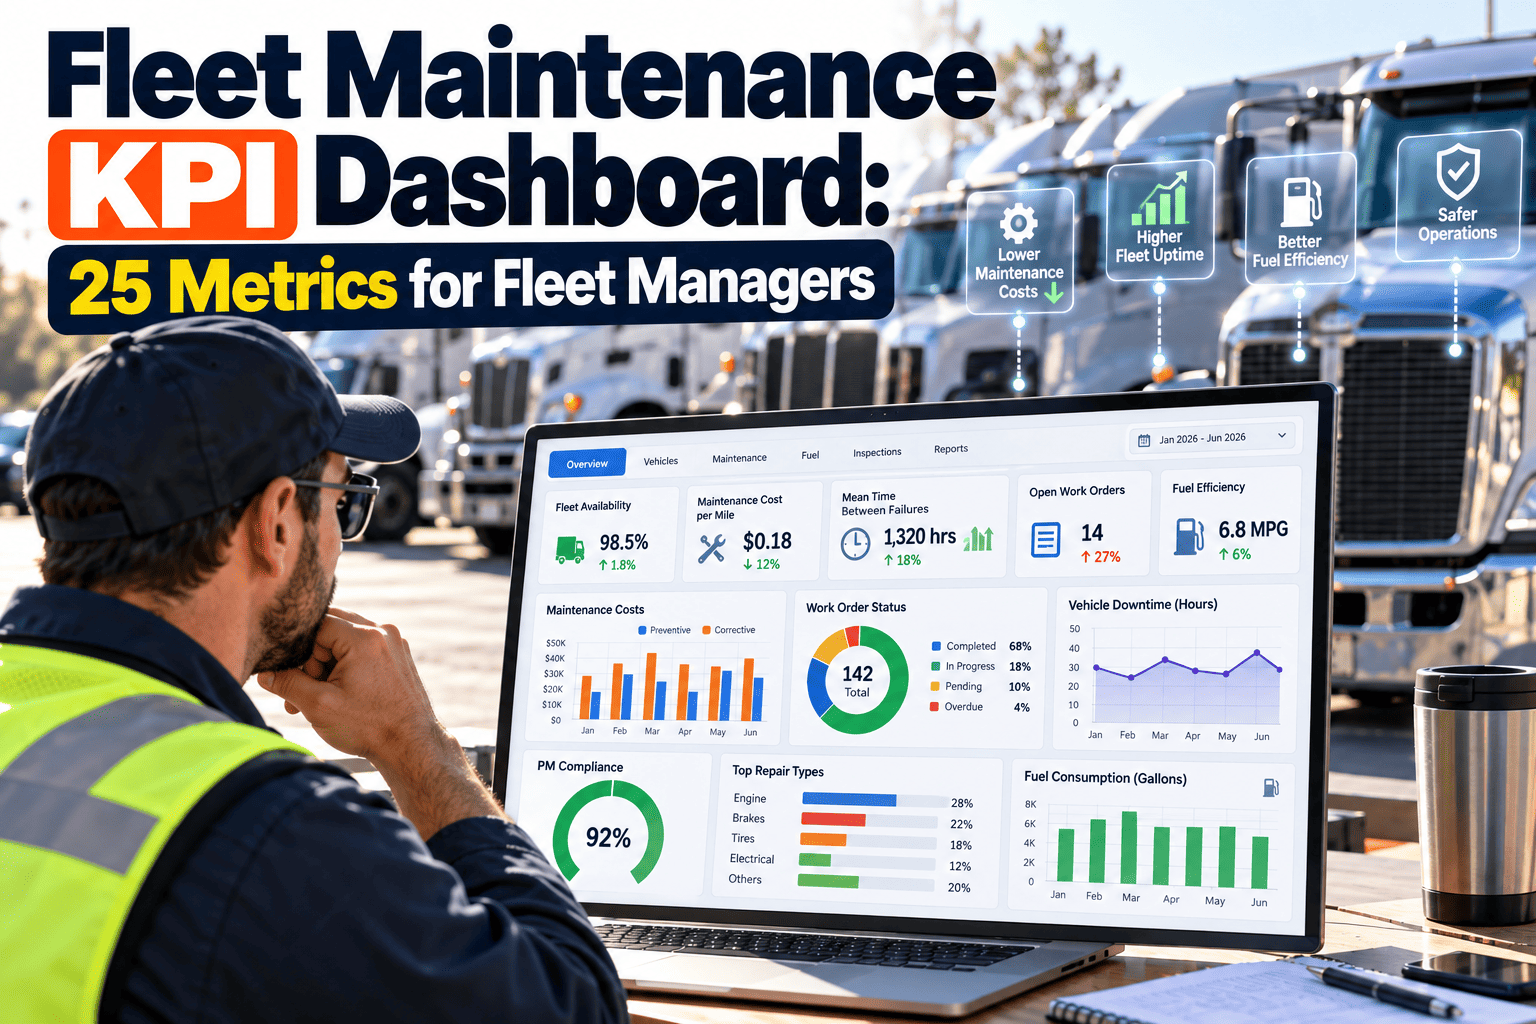
Most fleet managers are drowning in data and starving for signal at the same time. Telematics platforms, fuel cards, and maintenance logs generate more numbers than any single dashboard can meaningfully display, which is exactly why so many fleet teams end up watching whichever metric happens to be easiest to pull rather than the ones that actually predict trouble. A well-built KPI dashboard solves that by grouping the right metrics into categories that map to real decisions — what to fix now, what to budget for, and what to replace. This guide organizes 25 fleet maintenance KPIs into five practical categories and explains how a platform like Oxmaint can surface them automatically instead of requiring a manual spreadsheet pull every month.
Fleet Maintenance KPI Dashboard: 25 Metrics Every Fleet Manager Should Track
A categorized framework of maintenance efficiency, cost, reliability, compliance, and utilization metrics that turn scattered fleet data into a dashboard built for decisions, not just reporting.
Why a Categorized KPI Dashboard Beats a Long List
A dashboard with twenty-five unrelated numbers on it is not actually a dashboard, it is a report. The value comes from grouping metrics so that a rising number in one category prompts a specific, obvious action rather than a general sense that something is wrong somewhere in the fleet.
Category 1: Maintenance Efficiency Metrics
These five metrics describe how well the maintenance operation itself is running, independent of cost or compliance. A team can be spending appropriately and still be inefficient if repairs take too long or require repeat visits.
Category 2: Cost and Financial Metrics
Cost metrics tell the finance story behind maintenance decisions, and matter most when justifying budget, comparing vehicle classes, or making repair-versus-replace calls.
Category 3: Reliability and Asset Health Metrics
These metrics look at how often and how predictably vehicles fail, which is where the earliest warning signs of a developing problem usually appear before cost or downtime numbers catch up.
Category 4: Compliance and Safety Metrics
Compliance metrics protect the fleet from regulatory exposure and safety risk, and are often the category most likely to cause an operational shutdown if allowed to slip unnoticed.
Put All 25 KPIs on One Live Dashboard Instead of Five Spreadsheets
Oxmaint pulls maintenance efficiency, cost, reliability, compliance, and utilization metrics directly from work orders, inspections, and asset records, updating automatically as the fleet operates.
Category 5: Utilization and Productivity Metrics
The final category connects maintenance performance back to the business purpose of the fleet: how much of the available capacity is actually being used productively.
Building the Dashboard: Implementation Checklist
Which Metrics Matter Most at Different Fleet Sizes
| Fleet Stage | Priority Category | Key Metrics to Start With |
|---|---|---|
| Small Fleet (Under 20) | Efficiency and Compliance | PM Compliance Rate, Inspection Completion Rate, MTTR |
| Mid-Size Fleet (20–100) | Cost and Reliability | Cost Per Mile, MTBF, Preventive-to-Corrective Ratio |
| Large Fleet (100+) | All Five Categories | Full 25-metric dashboard segmented by vehicle class and location |
Frequently Asked Questions
No. Smaller fleets generally get the most value from starting with preventive maintenance compliance, inspection completion, and MTTR before expanding into the full dashboard.
Compliance-related metrics are best reviewed weekly given their regulatory exposure, while cost and reliability metrics are typically reviewed monthly to capture meaningful trends. Book a demo to see recommended review cadences inside Oxmaint.
Preventive-to-corrective maintenance ratio is one of the strongest leading indicators, since a rising share of corrective work usually shows up here before it appears in cost or downtime figures.
Yes, when work orders, inspections, and asset records live in a connected system, most of these metrics can calculate automatically rather than requiring manual data pulls. Sign up to see automated KPI tracking in action.
No, targets should be segmented by vehicle class and duty cycle, since a single fleet-wide benchmark tends to obscure meaningful differences between, for example, delivery vans and long-haul trucks.
Give Your Fleet Team One Dashboard Instead of Five Disconnected Reports
Oxmaint brings maintenance efficiency, cost, reliability, compliance, and utilization metrics together in one live view, built directly from your work orders and inspections.