Fleet emissions are not only a purchasing or routing problem. Many of the largest controllable losses happen in the shop: underinflated tires, dirty filters, misaligned wheels, ignored fault codes, and engines running out of tune. Each one burns fuel without moving freight. A maintenance-led carbon plan starts with those losses, measures them, and fixes them in a repeatable order. Below is a practical action plan, and a look at how fleet maintenance software turns it into scheduled, trackable work.
Sustainability and Efficiency
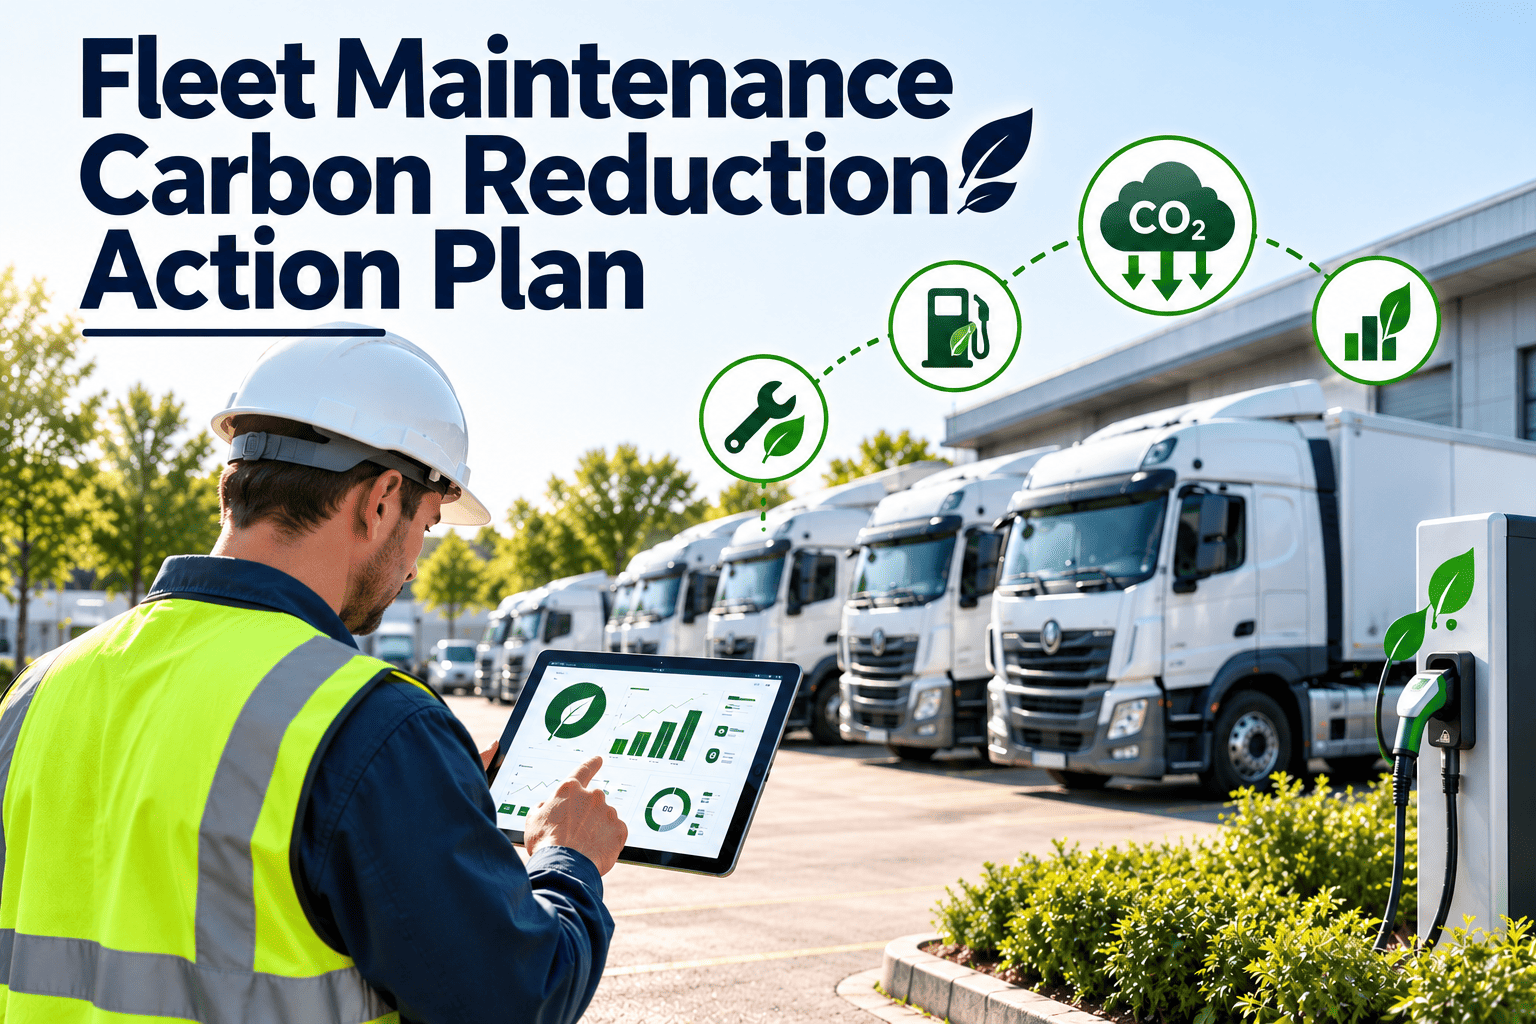
Fleet Maintenance Carbon Reduction Action Plan
Cut fuel burn and emissions through the work your shop already controls. Baseline, prioritize, schedule, and verify maintenance actions that lower fuel use per mile.
Where fuel is lost
Tires
Engine tune
Air and fuel filters
Alignment and drag
Illustrative layout, not measured data
Why Maintenance Belongs in the Carbon Plan
Fuel is the emissions driver
For most fleets, fuel combustion is the main source of direct emissions, so fuel waste is carbon waste.
Maintenance affects efficiency
Rolling resistance, engine condition, and aerodynamic drag all depend on how well vehicles are maintained.
Savings and reduction align
Lower fuel use cuts cost and emissions together, which makes the plan easier to fund.
Step 1: Establish a Baseline
Fuel use by vehicle
Gallons or liters by unit and period from fuel cards, tank logs, or telematics.
Distance or hours
Mileage, engine hours, or another activity measure to calculate fuel per distance.
Fuel type
Diesel, gasoline, CNG, electric, or other, since emission factors differ.
Maintenance condition
PM compliance, open defects, and overdue inspections that may affect efficiency.
Emissions are normally calculated from fuel quantity multiplied by a published emission factor. Use factors from a recognized source such as your national environmental agency, and record which source and year you used.
Step 2: Rank Actions by Impact and Effort
Low effort
Higher effort
Higher impact
Do first
Tire pressure checks, fixing fault codes promptly, replacing clogged filters, anti-idling practicesPlan and fund
Right-sizing vehicles, retiring least efficient units, aerodynamic upgrades, electrification readinessLower impact
Fill in
Cleaning and minor adjustments, consistent fluid specification checksReconsider
Large changes with unclear benefit or no way to measure resultsMaintenance Actions That Support Lower Emissions
| Action | Why it helps | How to make it routine |
|---|---|---|
| Maintain tire pressure | Underinflated tires raise rolling resistance and fuel use | Pressure check in every inspection and PM |
| Align wheels and balance | Misalignment increases drag and wears tires early | Alignment triggered by wear or interval |
| Replace air and fuel filters on schedule | Restricted flow can reduce engine efficiency | Filter tasks inside PM templates |
| Respond to engine fault codes | Faults can cause poor combustion and higher emissions | Diagnostic alerts create work orders |
| Maintain emission control systems | Faulty systems raise pollutant output and may breach rules | Scheduled inspection of aftertreatment components |
| Use correct fluids and viscosity | Wrong specification can increase friction losses | Fluid spec stored on each asset |
| Check brakes for dragging | Dragging brakes add resistance and waste fuel | Brake checks during PM and inspection |
Step 3: A Phased Action Plan
First 30 days
Measure and fix basics
- Collect fuel and distance data
- Clear overdue PMs
- Add pressure checks to every inspection
- Assign an owner for the plan
Days 30 to 90
Standardize and monitor
- Update PM templates with efficiency tasks
- Create alerts for fault codes
- Track fuel per distance by unit
- Investigate outliers
Days 90 to 180
Target the worst performers
- Review the least efficient vehicles
- Decide repair, retrain, or retire
- Compare tire and fluid choices
- Report results to leadership
Ongoing
Verify and improve
- Review results quarterly
- Update targets with real data
- Plan replacement with efficiency in mind
- Prepare for alternative fuel units
Preparing the Shop for Electric and Alternative Fuel Vehicles
Maintenance planning starts before the first vehicle arrives
- Identify technician training and safety requirements for high-voltage systems
- Set up separate PM templates, since electric vehicles have fewer fluid-based tasks but new inspection points
- Track battery health, charging equipment, and software updates as assets
- Keep records separate by fuel type so efficiency comparisons stay valid
Assets to register
Charging equipment
Traction battery data
Thermal management parts
Specialized tools and PPE
Measuring Progress Honestly
Fuel per distance
Compare by vehicle class and duty cycle so changes are real, not due to route differences.
PM compliance
Efficiency tasks only help if they are completed on schedule.
Fault-code response time
Days from code to repair, a direct indicator of avoidable waste.
Idle time
Hours idling by unit, where telematics data is available.
Estimated emissions
Fuel used multiplied by the chosen emission factor, reported with the factor source.
Report what you can verify. Avoid claiming a specific percentage reduction until your own before-and-after data supports it.
Common Barriers and How to Handle Them
Poor fuel data
Fuel records are scattered across cards, tank logs, and spreadsheets. Start with the best source available, note its limits, and improve it gradually instead of waiting for perfect data.
Competing priorities
Carbon work competes with uptime and cost. Frame efficiency tasks as part of normal PM so they are scheduled and funded like any other maintenance work.
Unclear ownership
Sustainability sits between operations, maintenance, and finance. Name one owner and agree which team supplies each dataset.
Working With Drivers and Operations
Idling practices
Idling burns fuel without moving freight. Agree reasonable idle limits with operations and give drivers clear guidance for different conditions.
Driving behavior
Harsh acceleration, speeding, and excessive braking raise fuel use and wear. Share telematics findings through coaching rather than blame.
Pre-trip reporting
Drivers are first to notice dashboard warnings and tire problems. Make reporting simple so defects reach maintenance before they waste fuel.
Vehicle assignment
Matching vehicle size and type to the route avoids running oversized units on light work.
Start With the Fuel Losses in Your Own Shop
Schedule the basics, track the results, and build a carbon plan from real maintenance data.
Data Sources and How to Check Quality
| Data source | What it gives you | Quality check |
|---|---|---|
| Fuel card transactions | Volume, date, and vehicle for purchased fuel | Compare with tank size and odometer to catch errors |
| On-site tank logs | Fuel dispensed into each vehicle | Reconcile with deliveries and inventory |
| Telematics | Distance, idle time, speed, and sometimes fuel use | Check against odometer and fuel records |
| Work orders | Maintenance actions, fault codes, and repair history | Confirm completion dates and recorded findings |
| Inspection records | Tire pressure, defects, and condition checks | Look for gaps in vehicles or periods |
Fuel Type and Technology Considerations
Make comparisons fair
- Compare vehicles of the same class, load, and duty cycle, since fuel use differs widely between them.
- Keep diesel, gasoline, gas, and electric vehicles in separate groups when measuring efficiency.
- Record the energy measure used for each, such as liters, gallons, or kilowatt-hours.
- For electric vehicles, note charging source and losses where known, since they affect reported emissions.
- Use consistent distance measures so units are not penalized for idling or auxiliary equipment use.
Group results by
Vehicle class
Fuel or energy type
Route or duty cycle
Age of the vehicle
Reporting Framework for Leadership
Scope and boundaries
State which vehicles and sites are included and which fuels are covered, so results are interpreted correctly.
Method and factors
Record the emission factors used and where they came from, and keep the method consistent year to year.
Actions taken
List the maintenance actions completed, such as PM compliance and fault-code response, alongside the results.
Results and limits
Report fuel per distance trends and be clear about uncertainty or data gaps.
Next steps
End with the next set of actions, owners, and dates so the report drives work.
Mistakes That Undermine Carbon Plans
Setting targets first
Targets chosen before a baseline exists are guesses and are difficult to defend when results are reviewed.
Ignoring the shop
Plans focused only on vehicle purchases miss the savings already available through maintenance discipline.
Overclaiming results
Claiming reductions without before-and-after data damages credibility with customers and auditors.
One-off campaigns
A single tire pressure drive helps briefly. Lasting results come from scheduled, repeated tasks.
Efficiency Tasks to Add to PM Templates
| PM task | Frequency idea | What to record |
|---|---|---|
| Check and set tire pressure | Every inspection and PM | Pressure reading and any correction made |
| Inspect air intake and filter condition | At each service | Restriction indicator or condition |
| Scan for fault codes | At each PM and when warnings appear | Codes found and work order raised |
| Check wheel alignment indicators | On irregular tire wear or after impact | Wear pattern and alignment result |
| Inspect brakes for drag | At each PM | Heat, noise, or free-rolling check |
| Review fluid specification | At each fluid service | Fluid type and grade used |
Parts and Supplier Choices That Affect Efficiency
Low rolling resistance tires
Where the application suits them, compare options using your own cost per distance data rather than catalog claims alone.
Quality filters and fluids
Use parts that meet manufacturer specifications, since the wrong grade can reduce efficiency and increase wear.
Retread and casing programs
Retreading can reduce material use, so track performance and failure rates to confirm it suits your routes.
Aerodynamic components
Side skirts, fairings, and gap reducers need regular inspection, because damaged parts lose their benefit.
Communicating the Plan Inside the Company
Shop teams
Explain how routine tasks connect to fuel use, and share progress so technicians see their work reflected in the results.
Drivers and dispatch
Provide simple guidance on pressure reporting, idling, and defect reports, with feedback on how their input was used.
Management and customers
Report verified progress, method, and next steps in plain language, without overstating what the data supports.
Fleet Renewal and Right-Sizing Decisions
Use maintenance history to guide replacement
- Identify vehicles with the highest fuel per distance and the highest repair spend, and review them together.
- Compare repair cost, downtime, and fuel use of aging units with the cost of a more efficient replacement.
- Check whether vehicles are oversized for the work they actually perform.
- Consider duty cycle and charging or refueling infrastructure before committing to a new technology.
- Retire the worst performers first, and record the results so the next decision rests on your own data.
Questions to ask
Does this unit fit its route?
What is its repair trend?
How does its fuel use compare?
What would replace it?
Linking Maintenance Cost and Carbon Results
Cost per distance
Track fuel and maintenance cost together, since reducing one at the expense of the other is not a real gain.
Avoided breakdowns
Planned repairs avoid roadside events that waste fuel through towing, replacement vehicles, and delays.
Tire and fluid life
Better maintained vehicles often extend component life, reducing the material and energy used in replacements.
Funding the plan
Show fuel savings from efficiency tasks to finance, which helps fund the next phase of work.
How Oxmaint Supports the Plan
Preventive maintenance
Build efficiency tasks such as pressure, filters, and alignment into PM schedules.
Inspections
Capture pressure readings and defects on mobile checklists before they waste fuel.
Work orders
Turn fault codes and findings into tracked corrective work.
Asset management
Keep fuel type, specs, and repair history by vehicle to compare performance.
Reporting
Review compliance, repeat issues, and spend to support sustainability reporting.
Frequently Asked Questions
How does maintenance reduce fleet emissions?
By keeping tires inflated, engines tuned, filters clean, and faults repaired, vehicles burn less fuel for the same work.
What should a fleet measure first?
Fuel use and distance by vehicle, plus PM compliance. Together they give a baseline and show where waste is concentrated.
How do I calculate emissions from fuel?
Multiply fuel quantity by a published emission factor for that fuel, and note the source and year of the factor.
Can a CMMS help with sustainability reporting?
It supplies maintenance and asset records that support reporting. You can build those records from your current fleet data.
Do electric vehicles change the maintenance plan?
Yes, with new inspection points and training needs. Book a demo to plan templates for mixed fleets.
Turn Maintenance Discipline Into Lower Emissions
Schedule efficiency work, track results by vehicle, and report progress you can back with data.