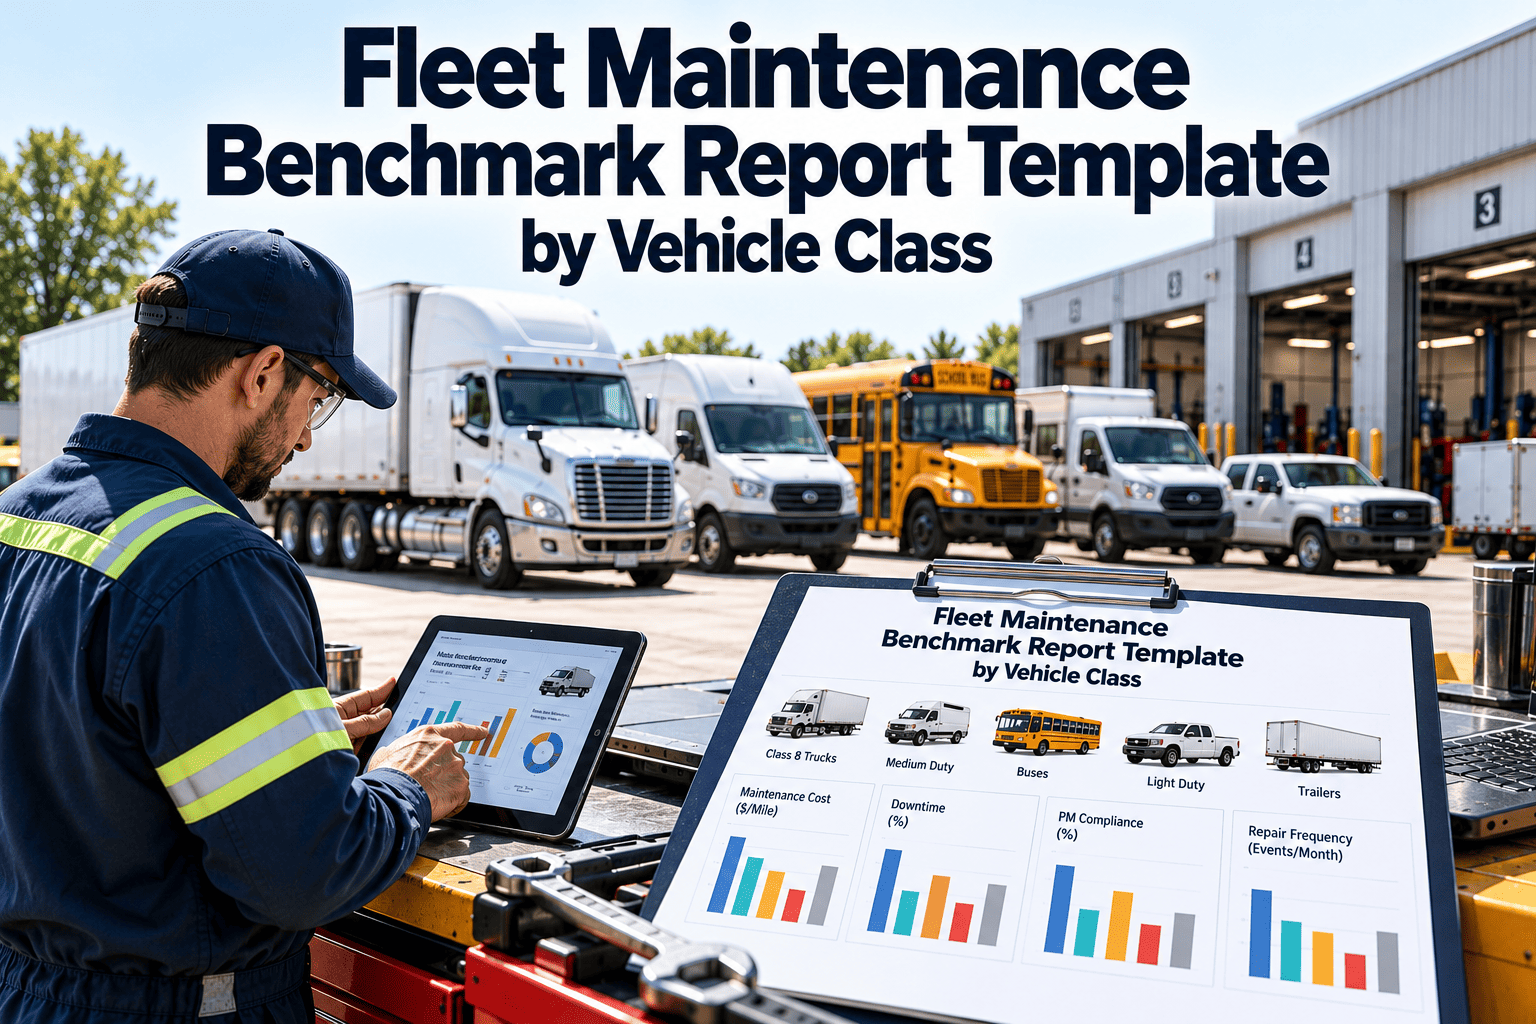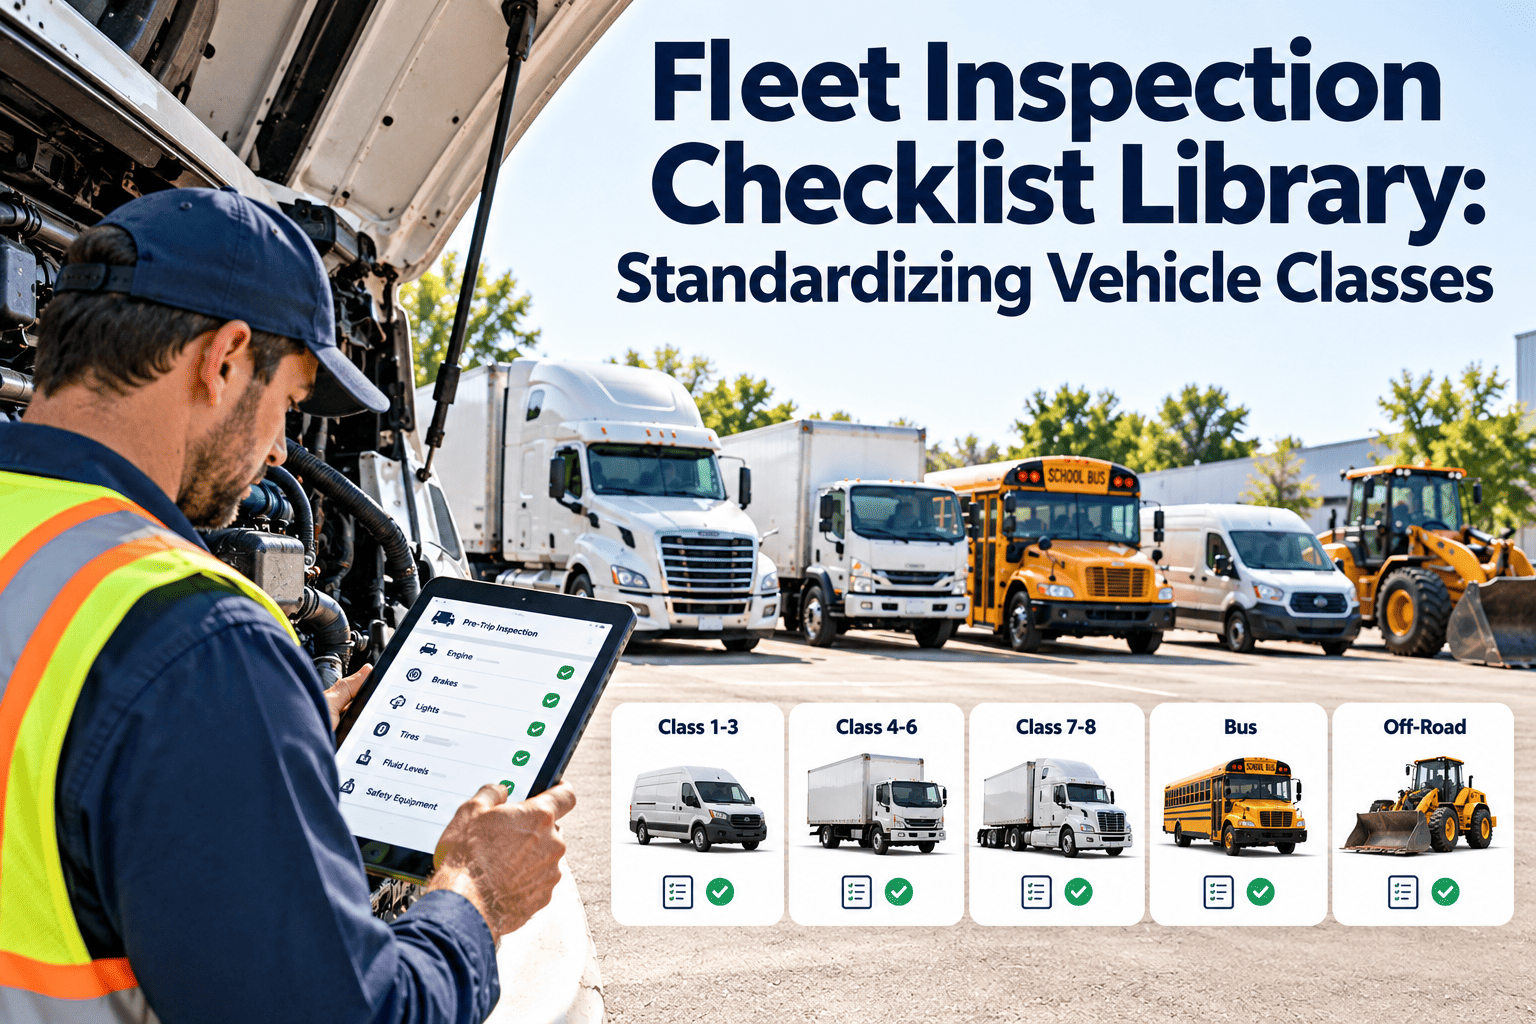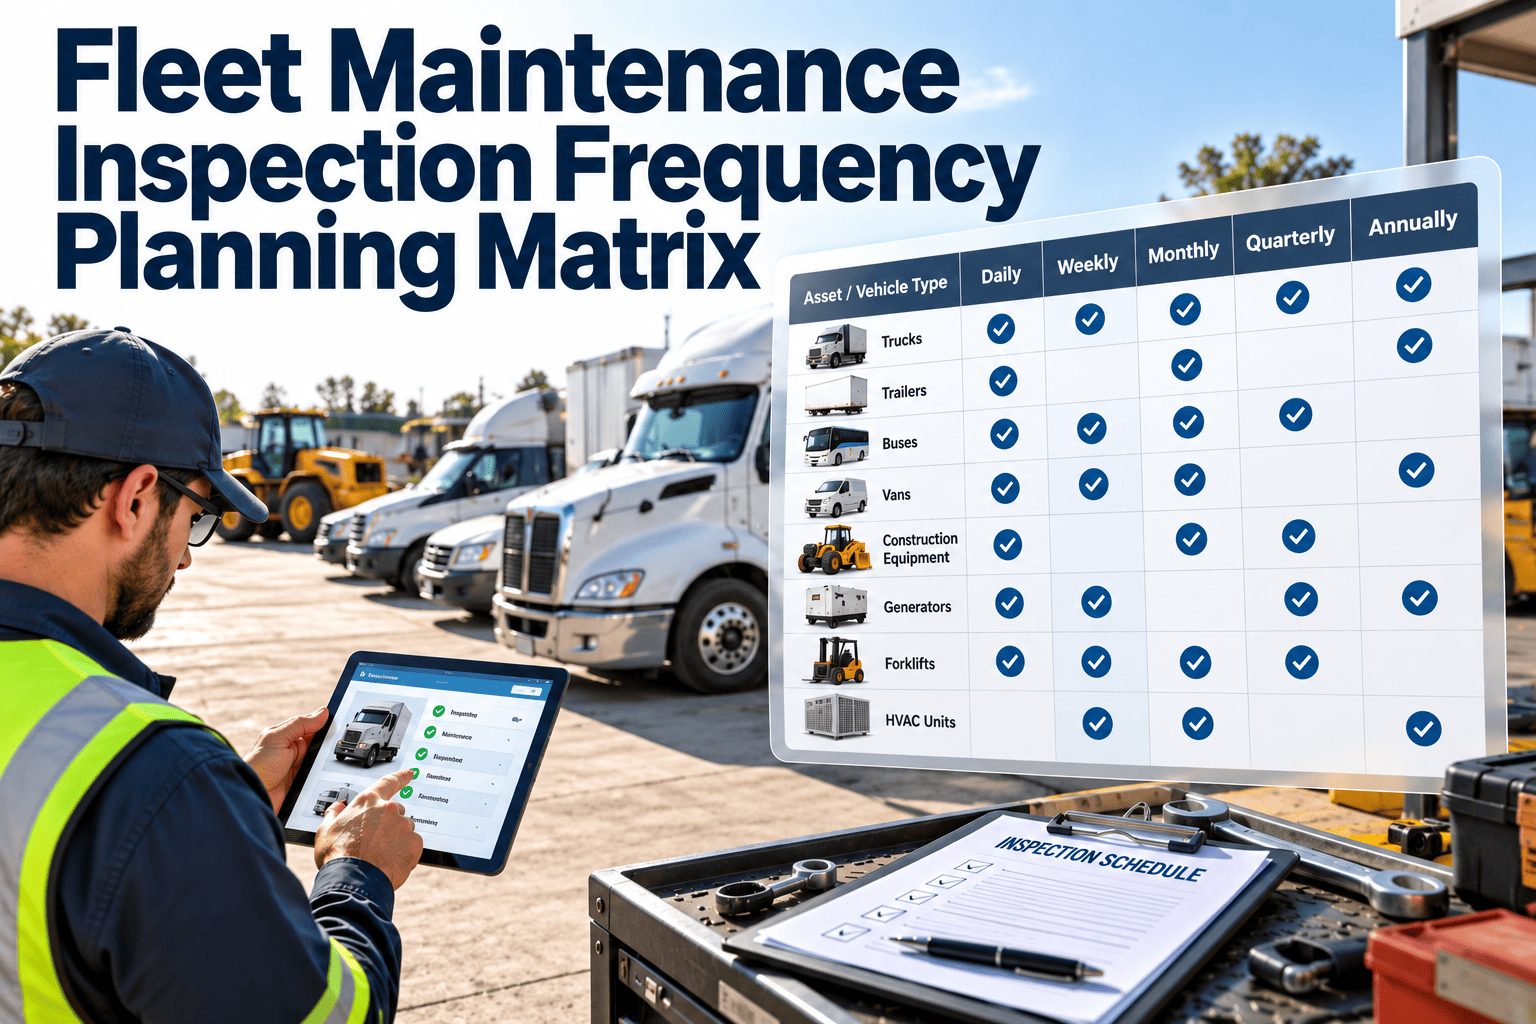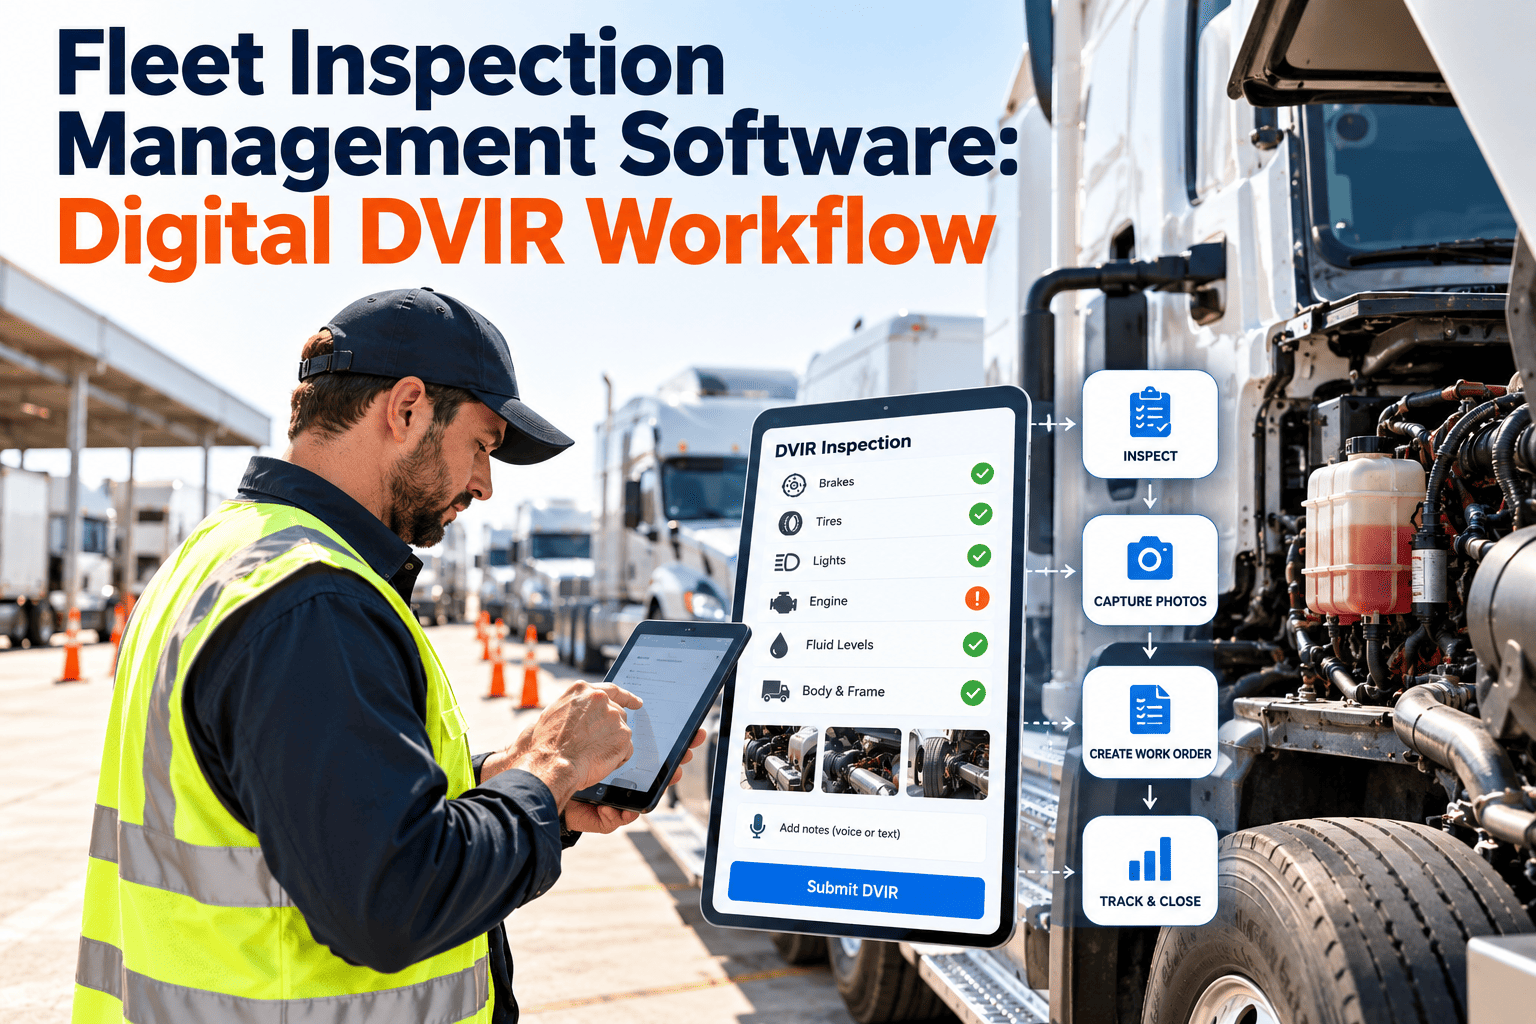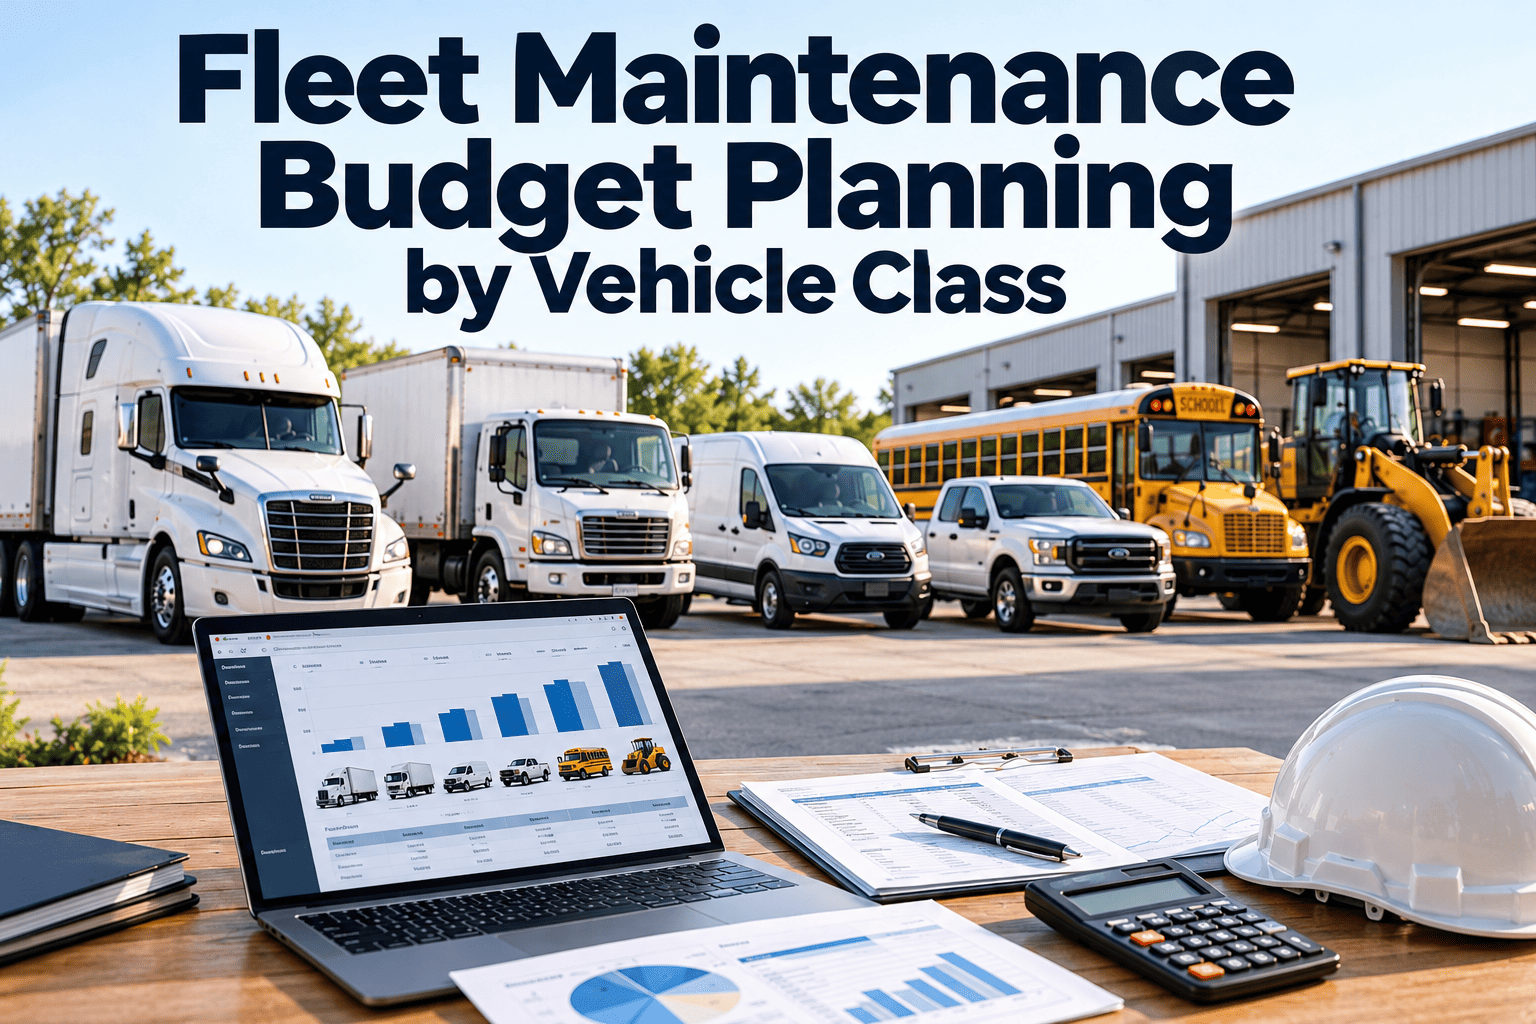
A single maintenance budget line for an entire fleet hides more than it explains. A heavy tractor, a delivery van, and a service pickup age differently, fail differently, and cost different amounts to keep on the road. Budgets set as one fleet-wide percentage tend to overfund some classes and starve others, then get overrun when old units fail. Planning by vehicle class ties spending to actual duty, age, and repair history. Fleets can track maintenance cost by vehicle class and base next year's budget on real work order data.
Fleet Maintenance Budget Planning by Vehicle Class
Build a maintenance budget from class-level cost history, planned preventive work, and age-based risk instead of a single fleet-wide guess.
Why a Single Fleet-Wide Budget Fails
Fleet-Wide Percentage
- Averages hide expensive classes and aging units
- Gives managers no basis to defend a request
- Surprises appear mid-year when major repairs land
- Replacement and repair decisions are made separately
Class-Based Planning
- Each class has its own cost per distance or hour
- Requests rest on history and a stated assumption
- Known lifecycle events are planned in advance
- Repair-versus-replace uses the same cost data
Step One: Group the Fleet Into Meaningful Classes
Classes should group vehicles that share duty, components, and cost behavior. Too many classes make data thin; too few hide differences.
| Class Example | Typical Cost Drivers | Planning Basis |
|---|---|---|
| Heavy tractors | Tires, brakes, engine and aftertreatment, drivetrain | Cost per distance, engine hours |
| Trailers | Brakes, tires, lighting, doors, structure | Cost per unit per year, inspection cycle |
| Medium-duty trucks | Brakes, suspension, hydraulics, body equipment | Cost per distance and per equipment hour |
| Delivery vans | Brakes, tires, stop-and-go wear, door and lift systems | Cost per stop-heavy distance, age band |
| Light-duty pickups | Tires, brakes, routine service, accident repairs | Cost per distance, PM schedule |
| Specialty and off-road | Hydraulics, undercarriage, engine hours, attachments | Cost per operating hour |
Step Two: Split Each Class Budget Into Planned and Unplanned Work
Build Next Year's Maintenance Budget From Real Cost by Class
Use work order, parts, and labor history grouped by vehicle class to support every budget line.
Step Three: Account for Age and Lifecycle Stage
Maintenance cost rarely stays flat as vehicles age. Group units by age band within each class to see where cost begins to climb.
The age band where cost per distance starts climbing is a useful signal for replacement planning.
The Budget Formula, Class by Class
- Use at least a full year of cost history per class, and note unusual events.
- Adjust the cost rate for route changes, fleet age shifts, and price changes in parts and labor.
- Document each assumption so the budget can be reviewed against actuals.
A Planning Calendar That Keeps the Budget Honest
Records That Make Class Budgets Defensible
- Every work order tagged to a vehicle and a class, with parts, labor, and sublet cost.
- Preventive maintenance schedules with due dates, so planned work can be counted.
- Inventory usage by class to forecast parts spend and stock.
- Downtime records to show the cost of delays beyond repair spend.
- Asset age, meter readings, and purchase data for lifecycle planning.
Oxmaint brings these together through asset management, work orders, preventive maintenance, inventory, and reporting. To see class-level cost views, arrange a demo.
Fleet Budget Planning Questions
Gathering the Inputs Before You Build Anything
A class budget is only as strong as the data beneath it. Collect these inputs first and note any gaps openly.
| Input | Source | Use in the Budget |
|---|---|---|
| Vehicle count by class and age band | Asset register | Sets the base for every rate calculation |
| Distance or hours per vehicle | Meter readings and usage logs | Converts cost rates into annual spend |
| Past cost by category | Closed work orders | Establishes cost per distance or hour by class |
| PM schedules and frequencies | Preventive maintenance plans | Builds the planned work layer |
| Failure history by component | Corrective work orders | Sizes the corrective allowance |
| Parts and labor price changes | Supplier quotes and labor rates | Adjusts the rate for expected inflation |
| Planned fleet changes | Acquisition and disposal plans | Updates unit counts and age mix |
Costing the Planned Work Layer, One Task at a Time
Preventive maintenance is the most predictable part of the budget, so build it from tasks, not percentages.
- Pull task frequency from the preventive maintenance schedule for each class.
- Use actual labor hours and parts from past work orders, not estimates from memory.
- Include inspections, fluid analysis, and scheduled component replacements.
- Add the cost of vehicle downtime if lost production is part of your internal case.
Line Items Worth Separating From the Class Total
Some costs are lumpy or controlled elsewhere. Showing them separately keeps class trends readable.
- Show sublet spend separately to see how much work is outsourced by class.
- Track fuel and registration elsewhere, so the maintenance budget stays focused.
- Record internal labor at a consistent rate across classes.
Repair or Replace: Using Class Data to Decide
Budget planning and replacement planning share the same data. A vehicle that costs more each year may be cheaper to replace.
Signals to Review for Replacement
- Cost per distance rising year after year
- Downtime climbing beyond class norms
- Major component failures expected soon
- Parts availability falling for the model
- Repeated corrosion or structural findings
Signals to Keep Repairing
- Cost stable against class average
- Few repeat failures after major repairs
- Low downtime and reliable availability
- Specialized body or equipment still in good condition
- Replacement lead time or price outweighs savings
Managing Variances During the Year
| Variance | Likely Cause | Response |
|---|---|---|
| Class overspend on corrective work | Aging units or deferred preventive tasks | Check PM completion and review replacement candidates |
| Parts cost above plan | Price increases or emergency purchasing | Review supplier terms and stock levels |
| Labor cost above plan | Rework, overtime, or long diagnosis | Check comebacks and job scheduling |
| Underspend on preventive work | Missed or postponed services | Treat as risk, since it often precedes failures |
| Reserve drawn early | Major accident or unexpected failure | Reforecast and agree whether to refill the reserve |
Underspending on preventive work looks like a saving until the corrective bill arrives.
Presenting the Budget to Finance and Leadership
Planning for Classes With Little or No History
New vehicle types, new technologies, and recently acquired fleets have no cost record to lean on. Use careful proxies and update them quickly.
- Train technicians early, since unfamiliar systems often increase diagnosis time.
- Budget for specialist tools or software that new vehicle types may require.
- Track failures from day one so the class has its own history within a year.
Parts, Labor, and Inflation Assumptions
Cost rates from last year rarely hold unchanged. State how prices are expected to move and keep the evidence.
| Assumption | Evidence to Collect | Review Trigger |
|---|---|---|
| Parts price change | Supplier price lists and recent invoice trends | Quarterly, or on any announced supplier increase |
| Labor rate change | Wage agreements and contractor rate cards | Annually, or when contracts renew |
| Tire price and wear | Contract terms and measured wear by class | When routes or tire types change |
| Sublet pricing | Quotes and rate agreements with external shops | When work shifts in or out of house |
| Utilization change | Planned distance and hours per class | When routes, contracts, or schedules change |
Write each assumption down with its source. A budget with visible assumptions is easier to defend and to correct.
How Oxmaint Supports Class-Based Budget Planning
- Asset management: vehicles grouped by class, age, and site, with meter readings.
- Work orders: labor, parts, and sublet cost recorded against each vehicle.
- Preventive maintenance: schedules by class, which reveal planned task volume.
- Inventory: parts usage and cost by class and location.
- Inspections: findings that predict upcoming corrective work.
- Reports and dashboards: actual versus planned spend by class and period.
Common Budget Planning Mistakes
What Goes Wrong
- Copying last year's actuals without checking for one-off events
- Cutting preventive work first when money is tight
- Ignoring the age mix as units move into later life
- Hiding accident cost inside class totals
- Skipping reforecasts until year end
What to Do Instead
- Clean the history of one-off events and note them
- Protect planned work and show the cost of cutting it
- Model the age shift for each class
- Report accident cost and reserve use separately
- Reforecast every quarter with actual data
To see class-level cost views with your own work orders, book a walkthrough with the Oxmaint team.
A Quarterly Budget Review Checklist
- Compare actual spend with plan by class, and write down the reason for each major variance.
- Check preventive maintenance completion, since missed services often predict later overspend.
- Review the oldest units in each class for repair-versus-replace decisions.
- Update cost rates for parts and labor changes that have already happened.
- Confirm the reserve balance and whether any draw needs approval.
- Record decisions and share the updated forecast with finance and operations.
Linking Budget Planning to Preventive Maintenance Compliance
A class budget assumes planned work will actually be done. Track completion so the plan and the spend stay connected.
- Report preventive maintenance completion by class next to spend against plan.
- Investigate classes where planned spend is low and corrective spend is rising together.
- Use inspection findings to forecast the corrective work likely in the next quarter.
- Adjust the reserve when findings show several vehicles approaching the same major repair.
Replace Budget Guesswork With Cost History You Can Defend
Group maintenance spend by vehicle class and plan each line from real work order data.