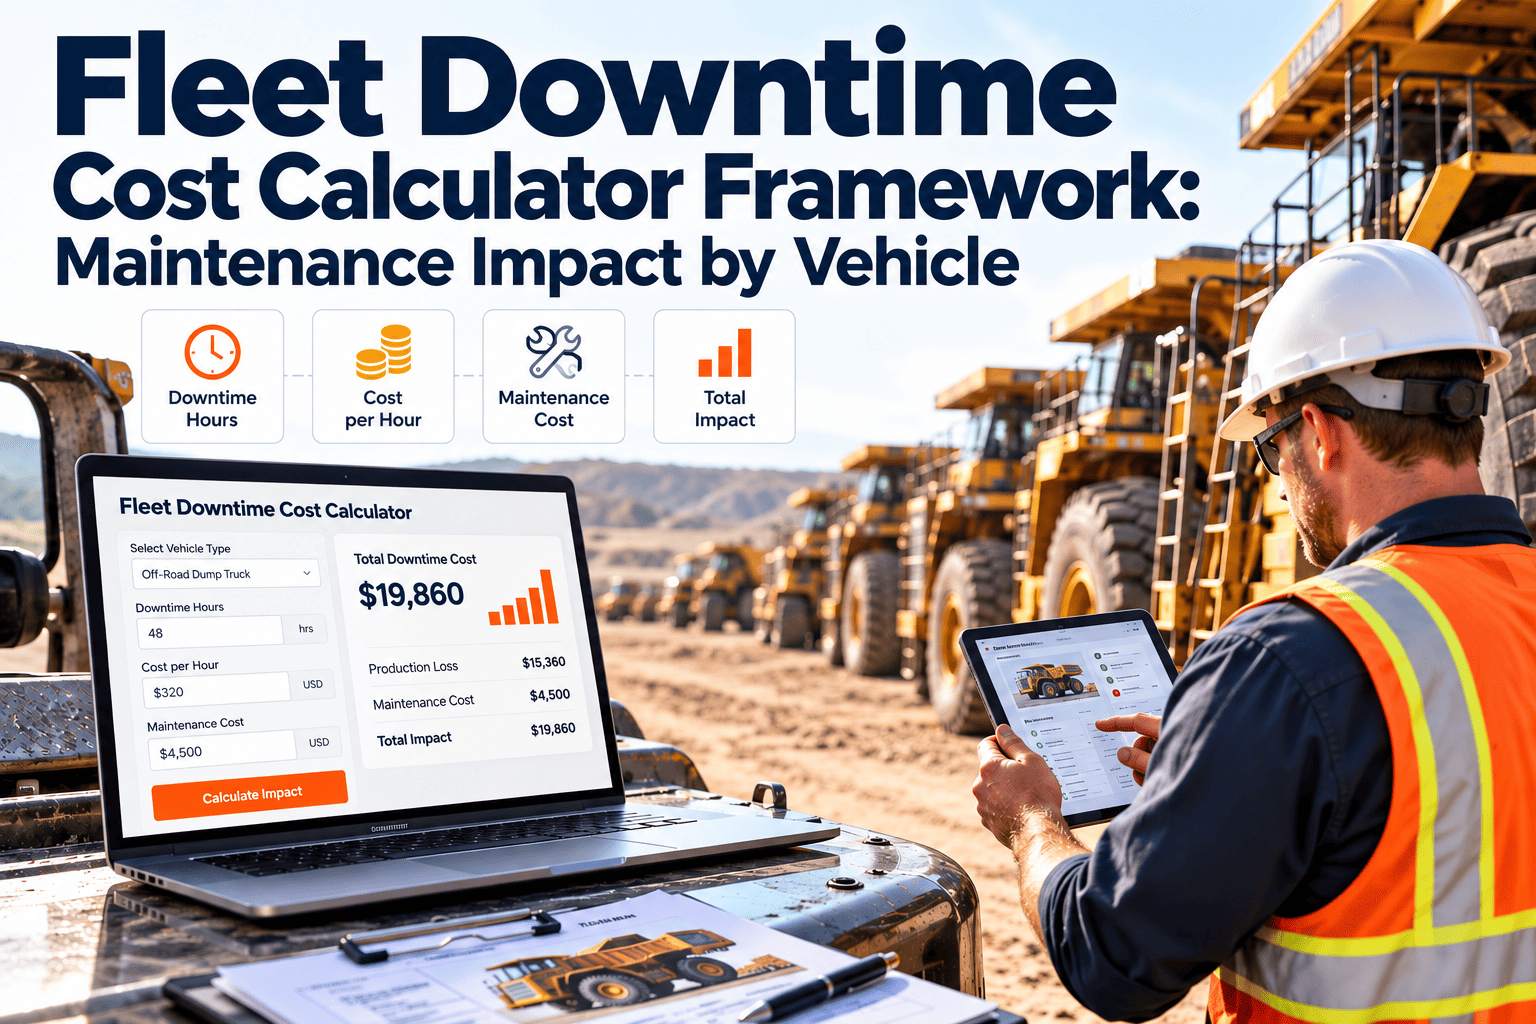
Every vehicle in a fleet loses value each year while its maintenance cost usually rises. Somewhere between those two lines is the best moment to replace it. Fleets that rely on a fixed replacement age, or on gut feel, often keep units too long or sell them too soon. This article explains how depreciation and maintenance cost combine into lifecycle cost, how to decide between repair and replacement, and how a fleet asset management CMMS supplies the cost history behind those decisions.
Fleet Maintenance Depreciation and Lifecycle Cost Analysis
Know what each vehicle really costs to own and run, then replace it at the right time, backed by maintenance records rather than opinion.
Depreciation and Maintenance Are Two Different Costs
They are often discussed together, but they behave differently and belong to different budgets.
Depreciation
- Accounting allocation of purchase cost over time
- Typically highest impact in the early years
- Follows a chosen method and the market value of the unit
- Owned by finance
Maintenance cost
- Real spending on labor, parts, tires, and outside repair
- Tends to rise as components wear
- Includes the cost of downtime when a unit is unavailable
- Owned by maintenance and operations
Depreciation Methods Fleets Commonly Use
Your finance team chooses the method. Maintenance teams should know how each one shapes the asset value they are comparing against.
| Method | How it works | Best suited to |
|---|---|---|
| Straight-line | Equal expense each year over the useful life, after residual value | Simple, predictable planning |
| Declining balance | Larger expense in early years, shrinking over time | Vehicles that lose value quickly early on |
| Units of production | Expense follows distance or hours actually used | Fleets with uneven usage between units |
- Tax treatment varies by country and asset type, so confirm with your accountant.
- Book value is an accounting figure. Resale value is a market figure, and the two often differ.
The Lifecycle Cost Build-Up
Total cost of ownership includes more than the purchase price and the repair bills.
Build Lifecycle Cost From Records You Already Create
Every work order, part, and inspection can feed a per-vehicle cost history. Start free or see a worked setup on a call.
A Simple Way to Compare Repair Against Replacement
One practical approach compares what the current vehicle costs per year to keep against what a replacement would cost per year.
- Use real maintenance cost per vehicle, not fleet averages.
- Use a realistic resale estimate from recent sales of similar units.
- Recalculate yearly, since both lines move.
Warning Signs a Vehicle Is Past Its Economic Life
No single number triggers replacement. Look for several of these together.
Lifecycle Stages and the Maintenance Focus at Each
Maintenance priorities shift as a vehicle ages. Plan for the stage, not just the calendar.
Commissioning
Record baseline data, warranty terms, and the correct PM schedule from day one.
Prime service
Keep to preventive schedules and use warranty claims for covered failures.
Mid-life
Watch cost per distance, plan major component work, and compare with replacement.
Exit planning
Decide on replacement or reassignment to lighter duty, and prepare for resale.
Data You Need Before You Can Trust the Analysis
Cost analysis fails on missing data. Check these basics for every vehicle.
- Complete work order costs. Labor hours and parts recorded against the right vehicle, not lumped by depot.
- Outside repair invoices. Vendor work linked back to the unit.
- Usage data. Odometer or engine hours entered regularly.
- Downtime records. Start and end of each out-of-service period.
- Acquisition details. Purchase date, price, and lease or loan terms from finance.
- Consistent categories. PM, repair, tires, and accident work coded the same way.
How Oxmaint Supports Lifecycle Cost Work
Oxmaint does not replace your finance system. It supplies the maintenance side of the picture.
| Question | Maintenance data used |
|---|---|
| What has this vehicle cost to maintain? | Work order labor, parts, and outside repair per asset |
| Is cost rising faster than comparable units? | Asset history and reports by vehicle class |
| Are we following preventive schedules? | Preventive maintenance records and completion rates |
| Which units fail repeatedly? | Corrective work orders and failure history |
| Which parts drive spend? | Inventory usage linked to work orders |
Frequently Asked Questions
Is there one right replacement age?
No. Duty cycle, usage, and maintenance cost differ by unit, so use cost history alongside age.
Does depreciation affect maintenance decisions?
Indirectly. It shapes book value, but repair-versus-replace should rely on real annual cost and downtime.
What is the most common data gap?
Costs recorded by depot rather than by vehicle. Sign up to track cost against each asset.
Should we include downtime cost?
Yes, where you can estimate it. It often changes which option looks cheaper.
Can you help set up cost reporting?
Yes. Book a demo to review asset records and cost reports for your fleet.
Replace Vehicles on Evidence, Not Guesswork
Give finance and operations one shared view of what each vehicle costs to keep on the road.