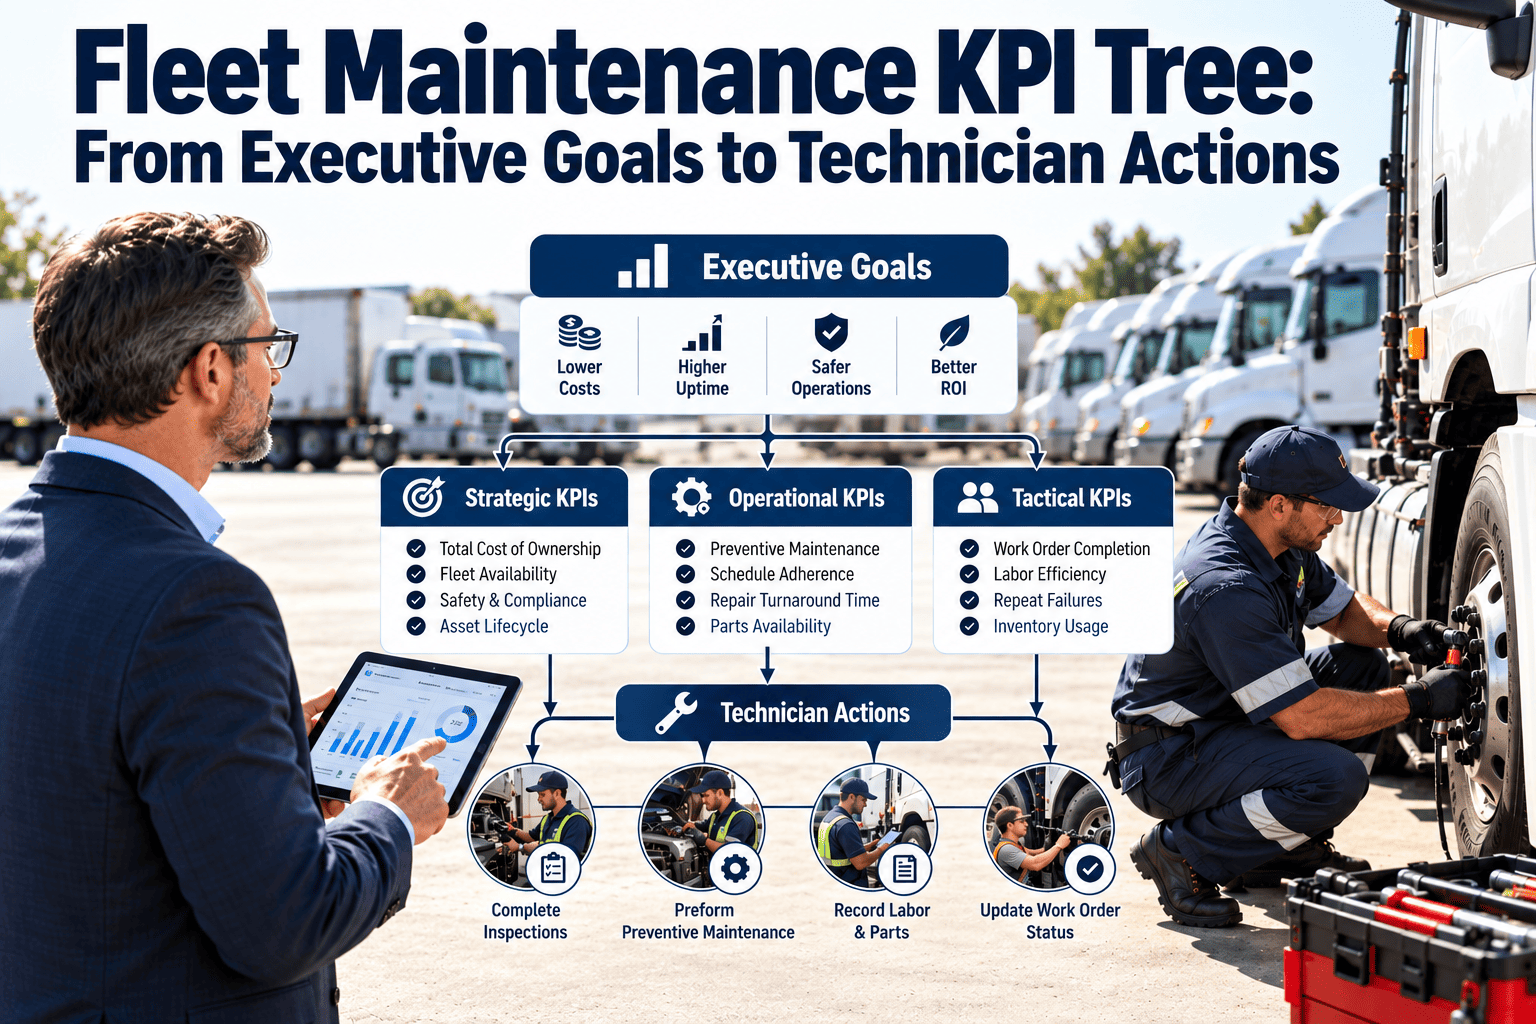
Executives ask for higher availability and lower cost per mile. Technicians receive a stack of work orders and a clock. Between those two worlds sits a long chain of decisions that no dashboard explains. A fleet maintenance KPI tree breaks each executive goal into the measures that drive it, then into the daily actions a technician can actually control. This guide shows how to build that tree, which measures belong on each level, and how a fleet maintenance CMMS supplies the data.
Fleet Maintenance KPI Tree: From Executive Goals to Technician Actions
Connect boardroom targets to shop-floor behaviour. Every number on the executive dashboard should trace down to something a technician does on a work order.
Why Most Fleet KPI Dashboards Do Not Change Behaviour
Many fleets track dozens of measures yet struggle to improve any of them. The usual reason is that the numbers are disconnected. A cost-per-mile figure tells a director something is wrong but gives a technician nothing to do on Monday morning.
A tree makes cause and effect visible
When availability falls, a tree lets the team trace the drop downward. Was it more breakdowns, longer repairs, late preventive work or parts waiting? Each question points to a branch, and each branch points to a person who can act.
Start from decisions, not from available data
Ask which decisions the fleet makes repeatedly, such as when to replace a vehicle, how much stock to hold or how many technicians to schedule. Choose measures that inform those decisions first, and add others only when a real question needs them.
The Four Branches of a Fleet Maintenance KPI Tree
Most fleets can organise their maintenance goals into four branches. The structure below is a starting point; remove anything you cannot measure reliably and add measures that match your operation.
KPI Definitions Worth Writing Down
A KPI is only useful if everyone calculates it the same way. Write the formula, the data source and the owner for each measure, and keep the definition in one place.
| KPI | Formula | Data source | Owner |
|---|---|---|---|
| Vehicle downtime rate | Hours out of service divided by scheduled available hours | Work order open and release times | Fleet manager |
| PM compliance | PM completed within its window divided by PM due | Preventive maintenance schedule | Shop supervisor |
| Breakdowns per vehicle | Unplanned road failures divided by active vehicles, per period | Corrective work orders flagged as breakdowns | Maintenance manager |
| Cost per mile or hour | Parts, labor and outside costs divided by miles or engine hours | Work orders and meter readings | Fleet manager |
| First-time fix rate | Repairs not repeated within a set window divided by total repairs | Work order history by asset and fault | Shop supervisor |
| Defect closure time | Time from reported defect to verified repair | Inspection defects and linked work orders | Compliance lead |
| Backlog age | Age of open, approved work orders not yet started | Work order statuses | Planner |
| Wrench-time share | Hours logged on repairs divided by paid hours | Technician time entries | Shop supervisor |
Build the Tree on Real Work Order Data
Capture the data at the job, then let every KPI roll up from it without rekeying.
Walking One Goal Down the Tree
The easiest way to see how the tree works is to follow a single goal from the top to the shop floor. The example below uses availability, but the same logic applies to cost or compliance.
Leading and lagging measures
Lagging measures such as downtime and cost tell you what already happened. Leading measures such as PM compliance, backlog age and defect closure time tell you what is likely to happen next. A healthy tree contains both, with more leading measures at the lower levels where technicians can influence them.
Common KPI Traps and Better Alternatives
| Trap | What goes wrong | Better approach |
|---|---|---|
| Rewarding fast closure | Work orders are closed early and the fault returns | Pair closure speed with first-time fix rate |
| Ranking technicians on hours alone | Complex jobs are avoided, quality suffers | Compare against job-type estimates and track repeat repairs |
| One cost number for the whole fleet | Mixed vehicle types hide the outliers | Segment by class, age and duty cycle |
| Counting PM done, not PM done well | Checklists are ticked without inspection | Audit samples and review findings per PM |
| Too many measures | Nobody knows which one matters | Keep a short list per role and review quarterly |
Guard against gaming
Any measure used for judgement will attract gaming. Balance each KPI with a counter-measure, publish the definitions openly and review exceptions in person. The goal is to find problems, not to punish the people who report them.
Data Quality: The Foundation Under the Tree
A KPI tree is only as reliable as the records beneath it. Before building dashboards, check that the basics are captured consistently on every work order.
- Each vehicle exists once as an asset, with a reliable meter reading.
- Work orders have request, start, completion and release timestamps.
- Faults are recorded with a consistent set of failure categories.
- Parts consumed and labor hours are logged against the work order, not in a notebook.
- Planned and unplanned work are distinguished clearly.
- Safety defects from inspections link to the repair that closed them.
- Outside repairs and warranty work are recorded in the same system.
Fix the data where it is created
Cleaning data afterwards rarely works. Make the technician's mobile work order short, use drop-down categories instead of free text, and require only the fields that feed a KPI. Better capture at the job saves hours of reporting later.
One Dataset, Four Views: What Each Role Should See
The same work order data can feed every level, but each person needs a different cut of it. Showing everyone everything produces noise. Showing each role its own few measures produces action.
| Role | Question they need answered | Measures to show | Typical action |
|---|---|---|---|
| Executive | Are we meeting the availability and cost goals? | Downtime rate, cost per mile or hour, compliance status | Approve budget, replacement or policy changes |
| Fleet manager | Which vehicle classes or sites are drifting? | Breakdowns per vehicle, repeat repairs, PM compliance by class | Adjust intervals, stock or staffing |
| Shop supervisor | What is stuck today and why? | Backlog age, waiting-for-parts count, bay use | Reassign work, expedite parts |
| Technician | What do I do next and what do I need? | Assigned work orders, checklists, asset history | Complete the job and record findings |
Segment before you judge
A fleet-wide average can look fine while one vehicle class performs badly. Break each measure down by vehicle type, age band, duty cycle and location before drawing conclusions. The segment with the worst trend usually deserves the next improvement project.
Setting Thresholds That People Can Act On
A KPI without a threshold is just a number. Set a target, a warning level and an action level, then record what should happen at each one. Base the values on your own history rather than copying another fleet's figures.
Balance preventive and corrective work
The share of planned versus unplanned work is one of the most revealing measures in the tree. A rising share of unplanned work usually points back to late preventive tasks, weak inspections or repeat faults that were never fully fixed. Track it by vehicle class, then follow the trail down to the specific work orders.
Use trends, not single readings
One bad week is rarely a pattern. Look at rolling periods, note seasonal effects, and mark known events such as a new vehicle batch or a parts shortage so the story behind each movement is not lost.
Review Rhythm: Who Looks at What, and When
Keep each meeting short and specific
Each review should end with named actions and dates. If a meeting produces only observations, the tree is being read but not used.
How Oxmaint Feeds the KPI Tree
Oxmaint captures the work as it happens, which is the data a KPI tree needs. The capabilities below support the measures covered in this guide.
| Tree level | What Oxmaint provides |
|---|---|
| Executive | Dashboards and reports summarising downtime, open work, cost and compliance across assets and locations |
| Fleet management | Asset records with service history, meter readings, preventive maintenance schedules and cost roll-ups |
| Shop supervision | Work order scheduling, priorities, assignments, backlog views and parts inventory |
| Technician | Mobile work orders, inspection checklists, time and parts entry, photos and completion notes |
Start with five measures
A first tree does not need every KPI. Begin with downtime, PM compliance, first-time fix, backlog age and cost per mile or hour. Once the team trusts those numbers, add more. You can book a demo to see how the data rolls up.
What a Complete KPI Definition Card Looks Like
Before a measure goes on any dashboard, write a short definition card for it. The card prevents arguments about what the number means and makes ownership explicit.
Retire measures that nobody uses
Every quarter, ask which KPIs led to a decision or an action. Measures that did not should be simplified, merged or removed, which keeps the tree focused and keeps reporting effort low.
Building Your Tree in Six Steps
KPI Tree Questions From Fleet Teams
Fewer than most teams expect. Aim for a handful per role and keep deeper measures for diagnosis. Sign up to test a small tree on live data.
PM compliance and breakdowns per vehicle usually lead, but your own data decides. Check which branch explains most of your downtime.
Keep mobile forms short, explain how the data is used and fix what they report. People record data when it leads to action.
Yes. Segment the same KPIs by vehicle class and powertrain so averages do not hide problems.
Review them quarterly and reset when the fleet, routes or regulations change. A demo can show how trends support that review.
Turn Executive Goals Into Daily Technician Actions
Give every level of the fleet the same trusted numbers, built from the work orders your team completes each day.