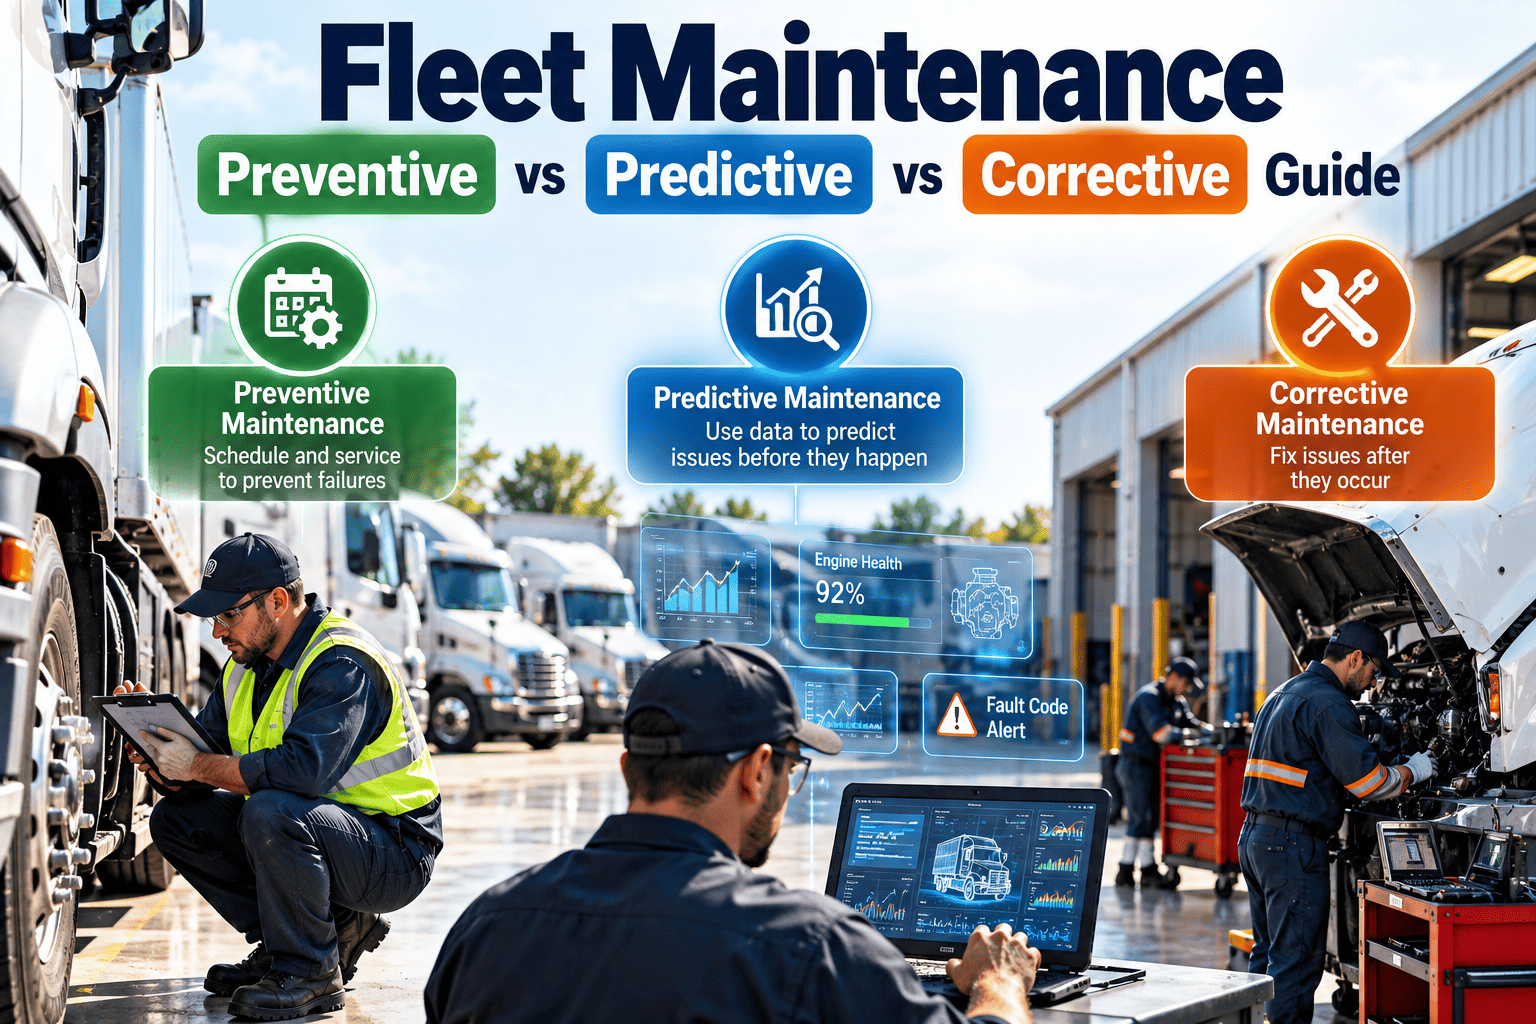
Fleet maintenance managers rarely choose one strategy for every vehicle system. Brakes, tires, filters, batteries, and engine electronics fail in different ways, and each calls for a different mix of corrective, preventive, and predictive work. This guide explains what each approach means, where each fits, and how to blend them into a program your shop can run. It also shows how a work order system such as Oxmaint keeps schedules, inspections, and repair history connected.
Fleet Maintenance: Preventive vs Predictive vs Corrective Guide
Match the maintenance strategy to the asset, the failure pattern, and the cost of downtime. Use corrective, preventive, and predictive work where each one makes sense.
The three strategies at a glance
Each approach answers a different question. Corrective asks what broke, preventive asks what is due, and predictive asks what is changing.
Choosing a strategy by vehicle system
Strategy should follow how a system fails. This table offers a starting point to adapt using your own failure history, manufacturer guidance, and regulations.
| System | Typical failure pattern | Suggested approach | Why | Records to keep |
|---|---|---|---|---|
| Engine oil and filters | Predictable wear by hours or distance | Preventive | Intervals are well understood | Service dates and meter readings |
| Brakes | Gradual wear with safety impact | Preventive with inspection | Wear can be measured before failure | Inspection results and thickness readings |
| Tires | Wear and damage vary by use | Preventive with inspection | Pressure and tread checks catch most issues | Pressure, tread, and rotation records |
| Batteries | Capacity declines, sudden failure possible | Condition-based where data exists | Test results show decline before no-start | Test readings and replacement dates |
| Belts and hoses | Wear and cracking over time | Preventive with inspection | Visual checks work for many cases | Inspection notes and replacement history |
| Cooling system | Leaks, blockage, and gradual loss | Preventive plus fault monitoring | Early leaks are often visible or logged | Fluid checks and fault codes |
| Engine and emissions faults | Intermittent, electronic, and fault-driven | Predictive | Fault codes can flag issues early | Diagnostic codes and repair outcomes |
| Transmission and drivetrain | Costly failure with warning signs | Predictive with preventive fluid service | Early action avoids major repair | Fluid service, temperature, and fault data |
| Lighting and minor body parts | Random, low impact | Corrective | Repair after defect is inexpensive | Defect reports and repair dates |
Cost and risk compared
This matrix shows relative trade-offs, not fixed figures. Use it to discuss priorities with finance and operations.
| Strategy | Planned work level | Unplanned downtime risk | Data effort | Safety exposure |
|---|---|---|---|---|
| Corrective | Low | High | Low | High when applied to critical systems |
| Preventive | Medium to high | Medium | Medium | Low to medium |
| Predictive | Medium | Lower when data is reliable | High | Low to medium |
| Blended | Medium | Lower overall | Medium to high | Low |
Build a maintenance mix that fits every asset
Schedule preventive tasks, record inspections, and manage corrective repairs in one system so strategy follows the data.
When each strategy breaks down
Every approach has a weak spot. Knowing it helps you add the right safeguard.
Corrective only
Waiting for failure works for cheap, low-risk parts. Applied to brakes, steering, or major drivetrain parts, it creates safety exposure and large repair bills.
Preventive only
Fixed intervals can replace parts that still had life and miss failures that develop between services. Intervals need regular review against real repair history.
Predictive without data discipline
Alerts are only as good as the readings behind them. Missing meter updates, inconsistent faults, or ignored alerts weaken the whole approach.
Blended without ownership
A mixed program needs clear owners for schedules, inspections, and alert response. Otherwise tasks pile up in separate lists.
What predictive work needs to succeed
Predictive maintenance is not a product you switch on. It depends on data you can trust and a process for acting on it.
Data foundations
- Accurate asset records and meter readings
- Consistent defect and fault code capture
- Complete repair history with causes
- Regular inspection results
- Clear definitions of failure for each component
Process foundations
- A threshold or rule for opening a work order
- A named owner who responds to each alert
- A review of false alerts and missed failures
- A link between alerts and repair outcomes
- Regular updates to thresholds from results
Five questions to choose the right strategy for a component
Ask these in order when deciding how to maintain a system. Document the answer on the asset or task record.
Does failure affect safety or compliance?
If yes, favor scheduled inspection and preventive work, and add condition data where available.
- Check regulatory inspection rules
- Set short inspection intervals
Is wear predictable?
If wear follows time or distance, preventive intervals are efficient.
- Use manufacturer guidance as a start
- Adjust from failure history
Is there a reliable early signal?
If a measurable signal appears before failure, a condition-based trigger can help.
- Check that data is captured consistently
- Test thresholds on past failures
What does downtime cost?
High downtime cost justifies more monitoring and earlier action.
- Consider route and revenue impact
- Consider spare availability
What does the failure cost to repair?
Cheap parts may not justify monitoring. Expensive components often do.
- Compare repair and prevention cost
- Review secondary damage risk
Worked decision example: a brake system
This illustration shows how the five questions can shape a plan. Replace the details with your own data and manufacturer guidance.
Safety and compliance
Brake failure affects safety and is covered by inspection rules, so inspections must happen regardless of any other strategy.
Wear pattern
Pads and rotors wear gradually by use, so a preventive inspection tied to mileage or hours is appropriate.
Early signal
Thickness readings and driver defect reports signal wear before failure, so a threshold can open a work order before parts reach their limit.
Cost and downtime
Brake repairs take a vehicle out of service, so planned work during scheduled downtime is better than roadside repair.
Result
A blended plan: scheduled inspections, a thickness threshold that triggers planned replacement, and corrective repair for unexpected defects.
KPIs to compare strategies
Measure results by strategy so decisions rest on evidence from your own fleet.
Preventive maintenance compliance
Scheduled tasks completed on time. Shows whether planned work is actually done.
Planned versus unplanned ratio
Share of work that was scheduled. A rising planned share suggests better control.
Mean time between failures
Average time between failures by system. Tests whether intervals work.
Repeat repair rate
Repairs returning for the same issue. Flags weak fixes or wrong intervals.
Alert-to-repair conversion
Share of condition alerts that led to a real finding. Measures predictive accuracy.
Downtime per vehicle
Hours out of service. Shows combined effect of the strategy mix.
Compliance and inspection considerations
Many fleets must perform and document inspections regardless of strategy. Treat these as the fixed base of your program.
Records that support all strategies
- Driver vehicle inspection reports and defect follow-up
- Periodic safety inspections with dates and results
- Repair records showing defects were corrected
- Preventive maintenance history by vehicle
Records that strengthen predictive work
- Fault codes linked to repair outcomes
- Condition readings with date and meter value
- Notes on what was found when alerts led to inspection
Trends shaping fleet maintenance strategy in 2026
Strategy is shifting as vehicles produce more data and shops face skill and parts constraints.
More connected vehicle data
Telematics and onboard diagnostics give fleets more condition signals. The value depends on linking that data to work orders and repair outcomes.
Inspection-driven maintenance
Mobile inspections capture defects early and feed corrective and preventive work in the same system.
Interval review from real history
Fleets are testing whether fixed intervals match actual wear instead of assuming they do.
Technician skill pressure
As skilled labor tightens, clear task lists and early warnings help teams plan work around capacity.
Operational impact of the wrong strategy mix
A poor mix shows up as downtime, cost, and strain on the shop. The symptoms differ depending on which strategy is overused.
Too reactive
- Breakdowns interrupt routes and customer service
- Emergency parts and rush freight raise cost
- Small faults grow into major repairs
- Technicians work in constant firefighting mode
- Safety defects may be found late
Too schedule-heavy
- Parts are replaced earlier than needed
- Technician hours go to low-value tasks
- Failures between intervals still occur
- Preventive work becomes a checkbox exercise
- Intervals never change despite repair history
A phased transition from reactive to blended maintenance
Most fleets cannot change everything at once. A phased approach builds habits and data in stages.
Stabilize records
Clean up asset lists, meter readings, and repair history so the data can be trusted.
Add preventive schedules
Start with oil, filters, brakes, and tires on your highest-impact vehicles.
Add inspections and trends
Use inspection defects and repeat repair data to adjust intervals and find weak spots.
Add condition triggers
Introduce condition-based tasks for selected high-cost components and review accuracy.
Roles in a blended program
Clear ownership prevents tasks from being missed. Each role contributes data or decisions to the program.
Reviewing and tuning intervals
Preventive intervals are a starting point, not a permanent rule. Review them against what technicians actually find.
- Compare findings at service time with the interval used, looking for parts that are routinely still in good condition
- Look for failures that occur shortly before a scheduled service, which may suggest a shorter interval
- Separate vehicles by duty cycle, since severe use may need different intervals
- Check manufacturer guidance and regulations before extending any interval
- Record every interval change with the date, reason, and person who approved it
- Review safety-related intervals more conservatively than cost-only intervals
- Share interval changes with technicians so they understand why a task moved and can report problems quickly
How Oxmaint supports a blended maintenance program
Oxmaint helps fleets run the three strategies from one asset and work order record rather than separate lists.
- Preventive maintenance schedules by date, meter reading, or usage
- Inspections that create corrective work orders from defects
- Work orders with labor, parts, notes, and history
- Asset records that show repairs, services, and open tasks
- Condition-based workflows that open tasks when readings cross thresholds
- Reports on planned versus unplanned work, repeat repairs, and downtime
How teams use it day to day
- Planners schedule preventive work and review overdue tasks
- Technicians complete inspections and update work orders on mobile
- Managers compare strategies and adjust intervals from repair history
- Supervisors see overdue preventive work and open alerts in one queue
Common strategy mistakes
Most poor results come from applying one idea too widely or from weak follow-through.
| Mistake | Effect | Fix |
|---|---|---|
| Same interval for every vehicle | Over-service on light duty, under-service on severe duty | Set intervals by duty cycle and usage |
| Adding alerts without owners | Alerts are ignored | Assign each alert type to a role |
| Skipping root cause on repairs | Repeat failures continue | Record cause and review repeats |
| Delaying inspections to save time | Defects found later at higher cost | Protect inspection time in the schedule |
| Treating predictive as a replacement for preventive | Basic wear items are missed | Keep preventive tasks for predictable wear |
Frequently asked questions
What is the difference between preventive and predictive maintenance?
Preventive follows a schedule by time or usage, while predictive acts when condition data shows a developing problem.
Is corrective maintenance ever the right choice?
Yes, for low-cost, low-risk parts where early repair would cost more than waiting for failure.
Which strategy is best for fleets?
Most fleets use a mix chosen by system risk, repair cost, and data quality. You can book a demo to see a blended setup.
What data do I need for predictive work?
Accurate meter readings, consistent fault and defect records, and repair outcomes linked to each asset.
How do I start moving from reactive to preventive?
Begin with high-impact systems and set up preventive schedules for one vehicle group first.
Choose the right maintenance approach for every asset
Run corrective, preventive, and predictive work from one maintenance record and improve intervals with real repair history.