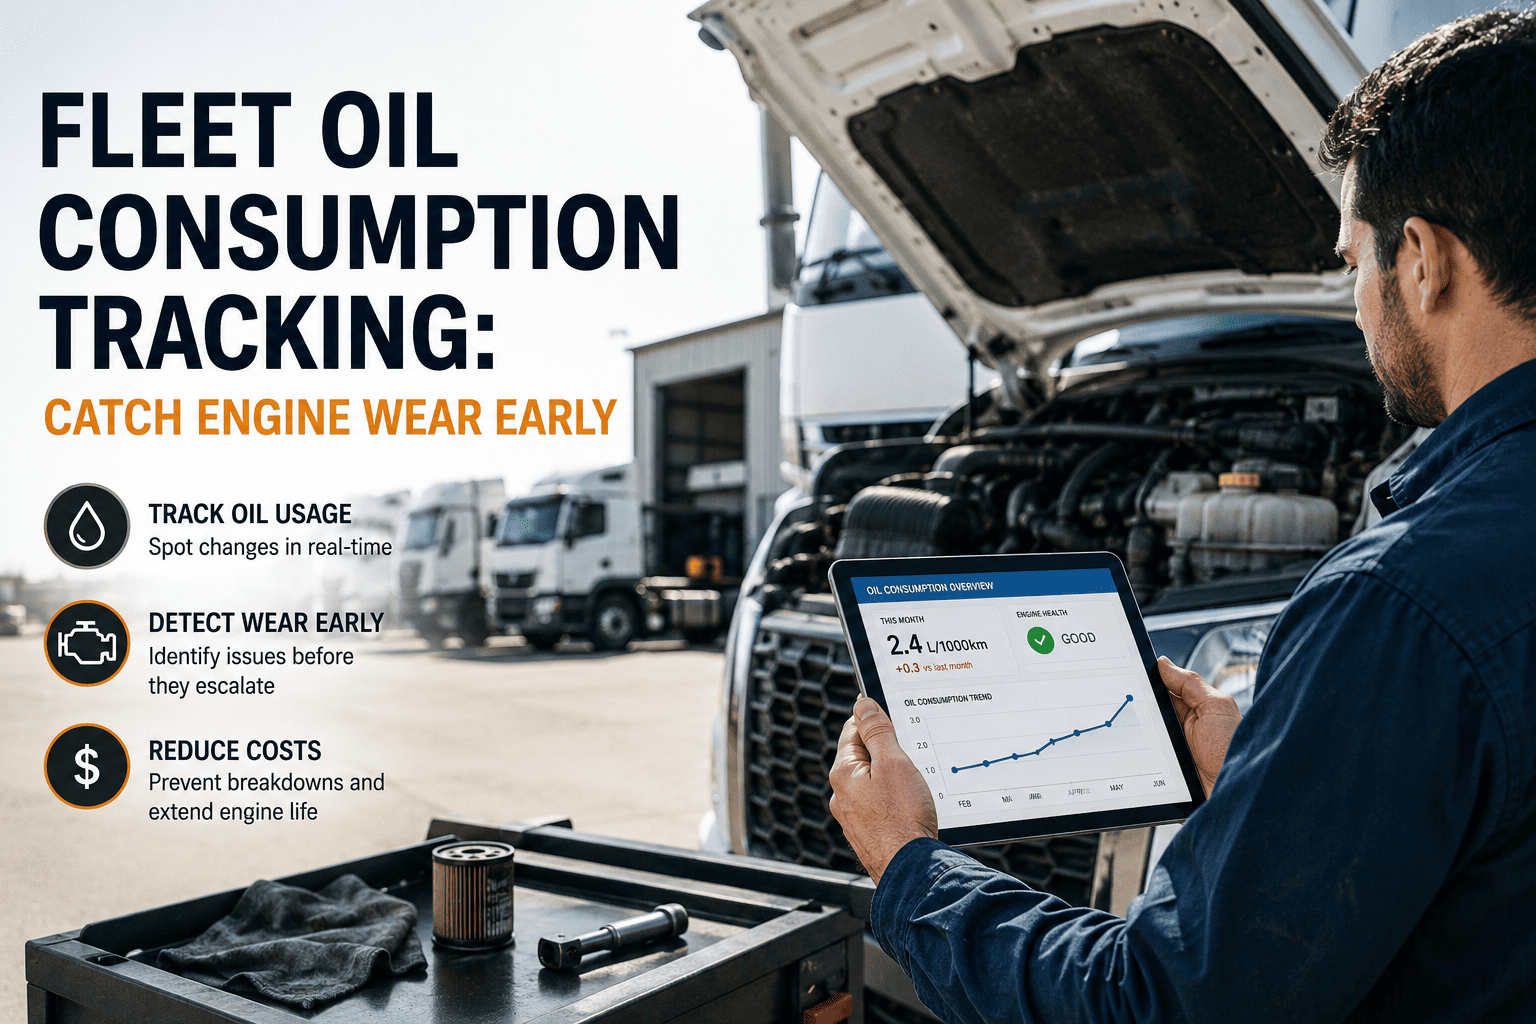
Every diesel engine burns a little oil — a thin film left on the cylinder wall gets consumed with every combustion stroke, and that is normal by design. What is not normal is when the quarts added between oil changes start climbing month over month. That climbing line is worn piston rings, failing valve seals, or a turbo seal starting to pass oil into the intake, and it shows up on a consumption graph months before it shows up as a compression test failure. Most fleets only notice it when a driver mentions topping off oil more often than usual, which is usually well past the point where it was cheap to fix. Sign in to OxMaint to log every top-up against mileage and catch the trend line before it becomes a teardown.
Fleet Oil Consumption Tracking · Engine Wear Detection · OxMaint AI
Rising Oil Consumption Is Engine Wear on a Graph — Catch It Before Compression Loss Becomes a Rebuild
OxMaint logs every oil top-up against mileage or fuel burned per vehicle, calculates the consumption rate automatically, and flags any engine trending out of its normal band — turning a driver's offhand comment into a work order weeks earlier.
0.3–1.5
Quarts per 1,000 miles — the normal consumption band for a healthy diesel engine
$15K–$40K
Typical cost of a diesel engine overhaul once wear reaches compression loss
1 qt
Per 100 gallons of fuel — the heavy-duty benchmark, since load drives oil use more than mileage does
Months
Of visible warning a rising consumption trend gives before compression actually drops
2x
Consumption climbing to double its normal rate is the earliest reliable signal of ring or seal wear. It shows up on the top-up log long before it shows up as blue exhaust smoke, a power loss complaint, or a failed compression test — but only if every top-up is actually logged against mileage instead of guessed at during the next oil change.
Sign in to OxMaint to see the trend line building on your own fleet.
How Oil Consumption Rate Is Actually Calculated
1
Set the Baseline
Start the count right after an oil change, with the level confirmed at full on the dipstick or the digital sensor reading. This is the zero point every future reading gets measured against.
2
Log Every Top-Up
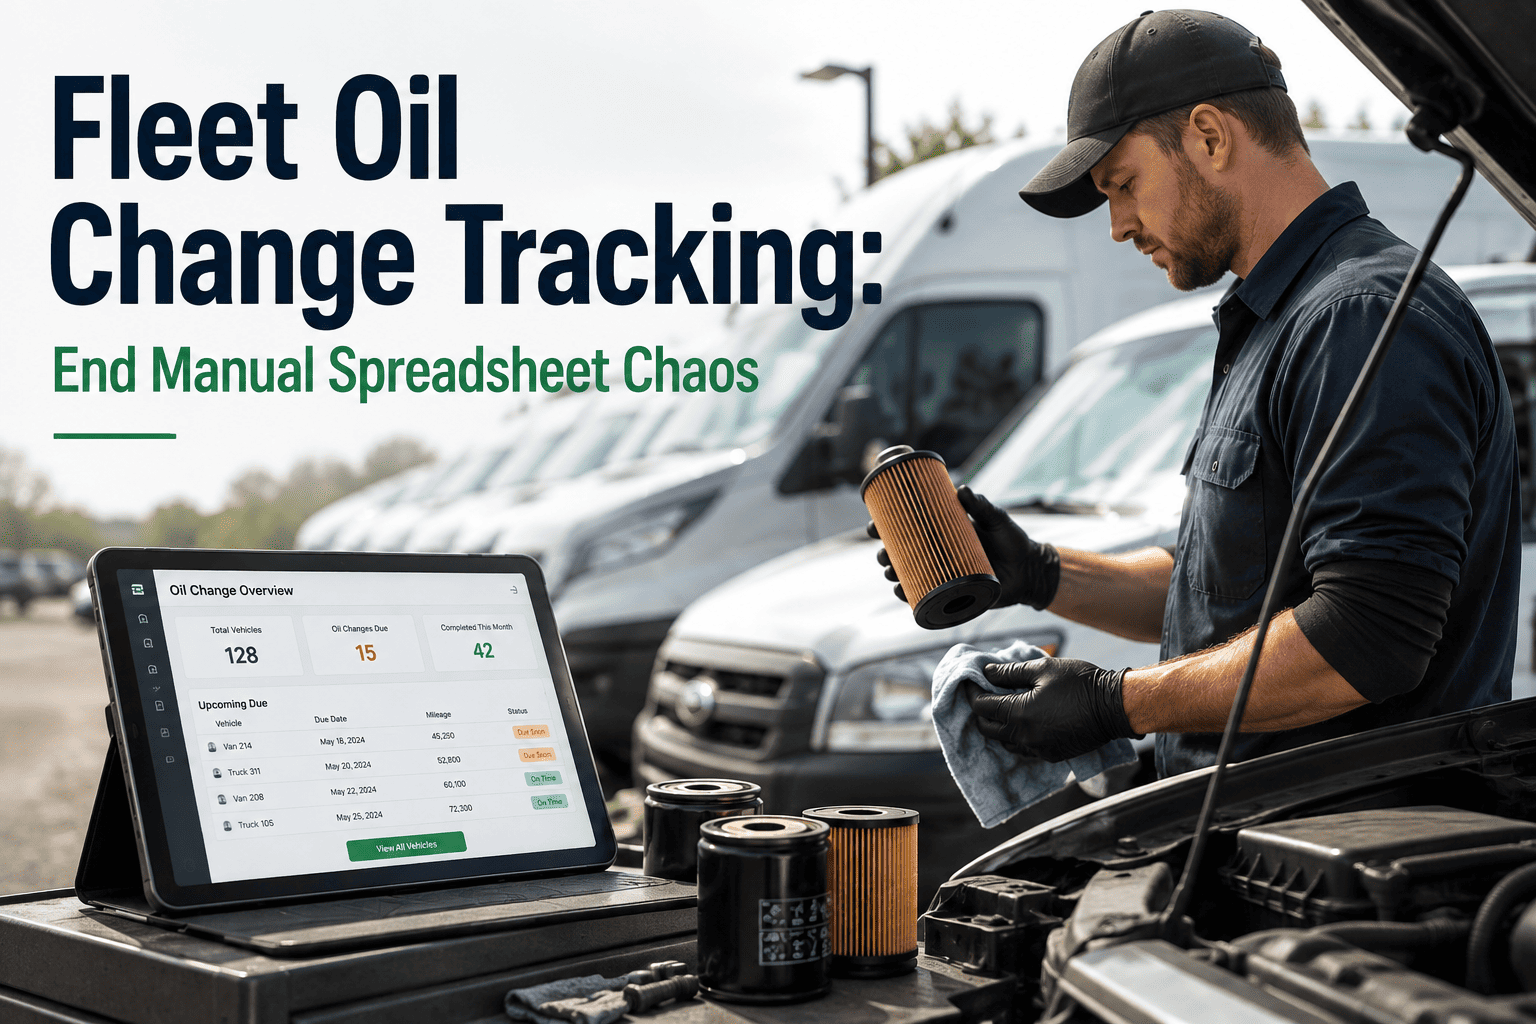
Every quart added between changes gets logged against the vehicle's exact mileage or fuel burned at that point — not estimated later from memory at the next service visit.
3
Calculate the Rate
Quarts added divided by miles driven, scaled to a standard 1,000-mile window, gives a consumption rate that can be compared across vehicles and across time for the same vehicle.
4
Track the Trend
One reading tells you almost nothing. Three or four readings in a row climbing in the same direction is the pattern that actually predicts a coming failure — and that only shows up if the data is logged consistently.
OxMaint Fleet Oil Consumption Tracking
Every Top-Up Logged, Every Trend Line Calculated Automatically
No spreadsheet, no manual math at the next oil change. Log the quart, and OxMaint does the rest — rate calculation, trend tracking, and an alert the moment a vehicle drifts out of its normal band.
Where Your Engine Sits on the Consumption Scale
0.3–1.5 qt / 1,000 mi
Normal
1.5–3 qt / 1,000 mi
Watch
3+ qt / 1,000 mi
Critical
Normal — expected consumption from cylinder wall lubrication; no action needed beyond routine tracking
Watch — schedule an oil analysis and inspect the PCV system before the trend climbs further
Critical — compression and leak-down testing needed now; rings, valve seals, or turbo seals are likely worn
Consumption Benchmarks by Engine Type
The Four Root Causes Behind a Rising Consumption Trend
RNG — Piston Rings
Worn Piston Rings — The Most Common Culprit
Rings seal the combustion chamber and scrape excess oil off the cylinder wall on the downstroke. As they wear, both jobs get worse — more oil slips past into combustion, and compression starts leaking the other way. This is the failure a rising consumption trend catches earliest.
VLV — Valve Seals
Valve Seal Wear — Oil Pulled Down the Valve Guide
Hardened or cracked valve seals let oil seep down the valve stem into the combustion chamber, especially noticeable at startup or idle. It produces a steadier, more moderate consumption increase than ring wear rather than a sudden spike.
PCV — Crankcase Ventilation
PCV System Failure — Oil Pulled Into the Intake
A stuck or failed PCV valve lets crankcase pressure pull oil mist straight into the intake tract, showing up as consumption that rises even though the rings and seals underneath are still in good shape. It is the cheapest of the four causes to fix.
TRB — Turbo Seals
Turbocharger Seal Wear — Oil Drawn Into the Charge Air
A worn turbo shaft seal lets oil migrate into the intake or exhaust side of the turbo, often paired with visible smoke under boost. On turbocharged engines this is one of the first places to check once consumption crosses into the watch range.
4
common root causes behind a rising oil consumption trend
3
consecutive readings needed to confirm a real trend, not a one-off variance
$25K
midpoint cost of the overhaul a caught-early trend line helps you avoid
1
log entry per top-up is all it takes to build the trend line automatically
The quart your driver topped off last week isn't a line item — it's a data point. On its own it means nothing. Logged against the last four top-ups, it's the earliest warning your engine can give.
OxMaint turns every top-up into that trend line automatically, per vehicle.
Frequently Asked Questions — Fleet Oil Consumption Tracking
How much oil consumption is actually normal for a diesel engine?
Roughly 0.3 to 1.5 quarts per 1,000 miles for most diesel engines, though heavy-duty trucks are usually measured against fuel burned rather than mileage.
Sign in to OxMaint to see the benchmark for your specific fleet mix.
Why measure oil consumption against fuel burned instead of mileage for heavy trucks?
A truck pulling a heavy load burns more fuel and more oil per mile than the same truck running empty, so mileage alone distorts the comparison. Fuel-burned tracking accounts for that workload difference directly.
Does one high top-up reading mean the engine is failing?
Not on its own — a single reading can be thrown off by an inconsistent dipstick check or a recent oil change. It takes three or more consecutive readings trending the same direction to confirm a real pattern.
What's usually cheaper to fix — a PCV issue or ring wear?
PCV system failures are typically the cheapest of the common causes, often a valve or hose replacement. Ring and valve seal wear both point toward a much larger overhaul-level repair.
Can consumption tracking replace oil analysis and compression testing?
No — it tells you which vehicle to test next. A rising trend is the trigger for oil analysis or a compression test, not a replacement for them.
Book a demo to see how the two fit together in one workflow.
The Trend Line Is Already Forming. Someone Just Needs to Be Watching It.
OxMaint logs every oil top-up against mileage or fuel burned, calculates the consumption rate automatically, and flags any engine drifting toward a rebuild — while it's still a cheap fix.