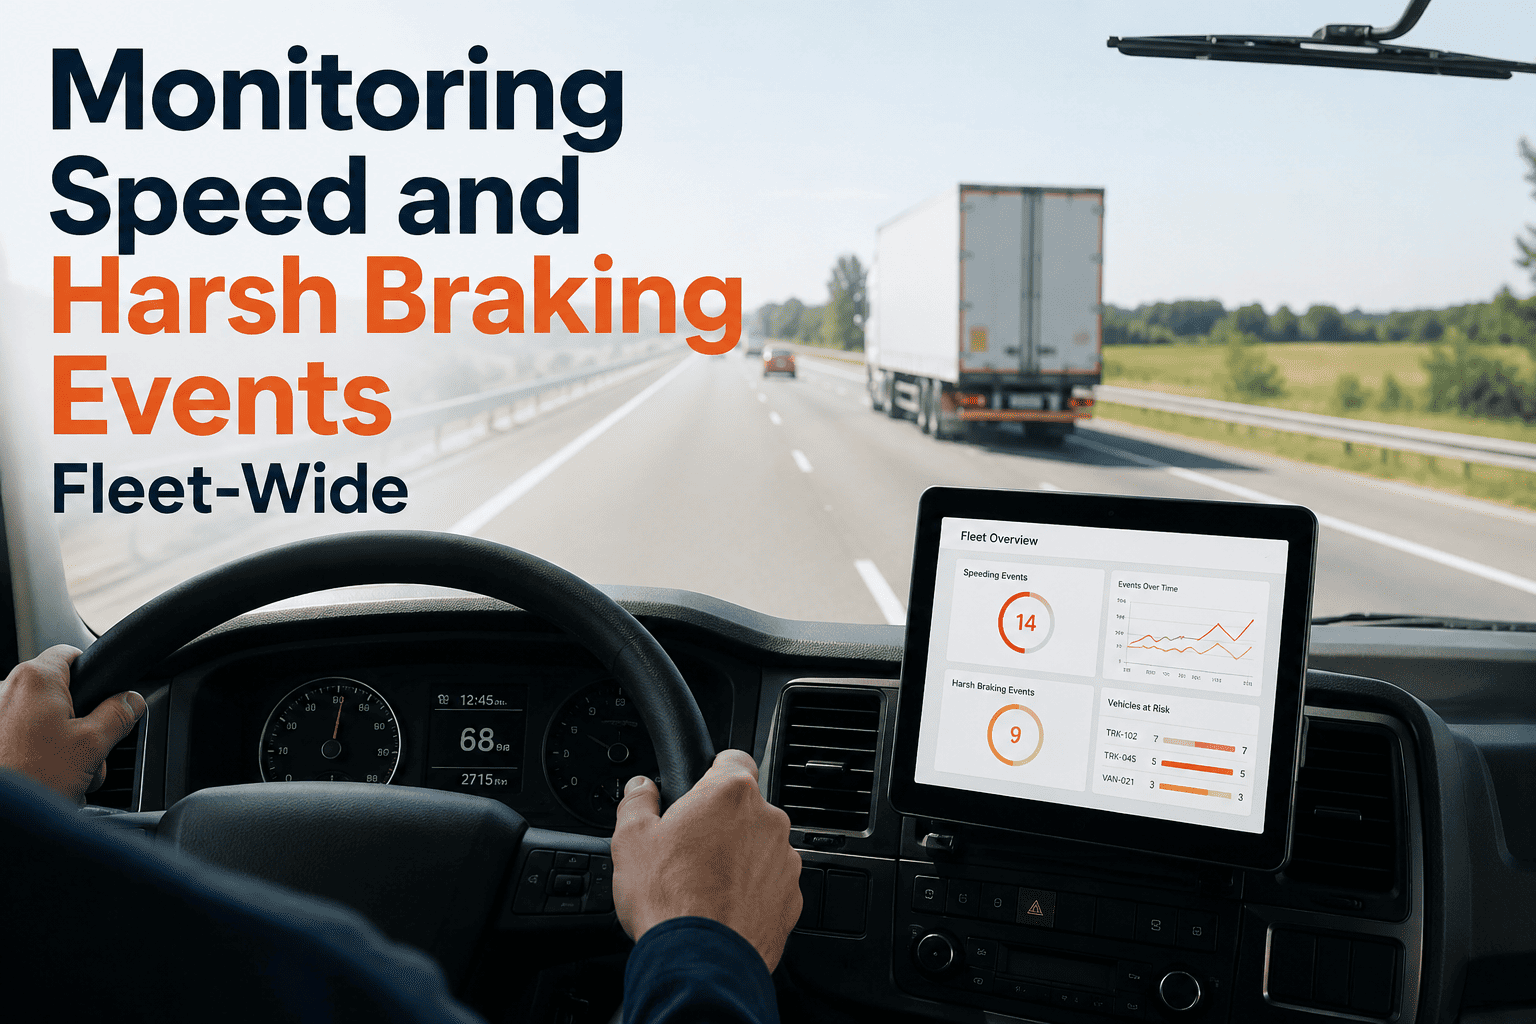
A 140-van delivery fleet was averaging 11 harsh braking events per driver every week, and nobody noticed because the flag sat inside a telematics export nobody opened. Three drivers were also running 20-plus mph over posted limits on residential routes several times a shift. None of it surfaced until a rear-end collision produced a $61,000 claim and an insurance review that pointed straight at a pattern the fleet already had the data to catch. Speed and harsh braking events are two of the strongest available predictors of fleet accident risk, and most fleets are already generating this data through hardware they installed years ago — it just never becomes a driver risk profile until after something breaks. OxMaint turns that raw telematics stream into a live per-driver risk profile, visible weeks before the next incident, not months after.
Speed & Harsh Event Monitoring — OxMaint
Every harsh brake, hard turn, and speeding event scored per driver, in real time, from telematics you already have
3x
higher rear-end collision likelihood for drivers with frequent harsh braking patterns
29%
of fatal crashes nationally involve speeding as a contributing factor
15%
average fuel efficiency loss tied to repeated hard acceleration and braking cycles
34%
of commercial fleets currently run a formal event-based driver scorecard
The Three Events That Predict Almost Every Preventable Accident
Fleet accident data keeps pointing back to the same three kinematic events. Captured individually they look like noise. Captured continuously and weighted by severity, they become a working risk profile per driver — which is exactly what OxMaint builds from telematics data your fleet is already generating.
Highest correlation with rear-end claims
Harsh Braking
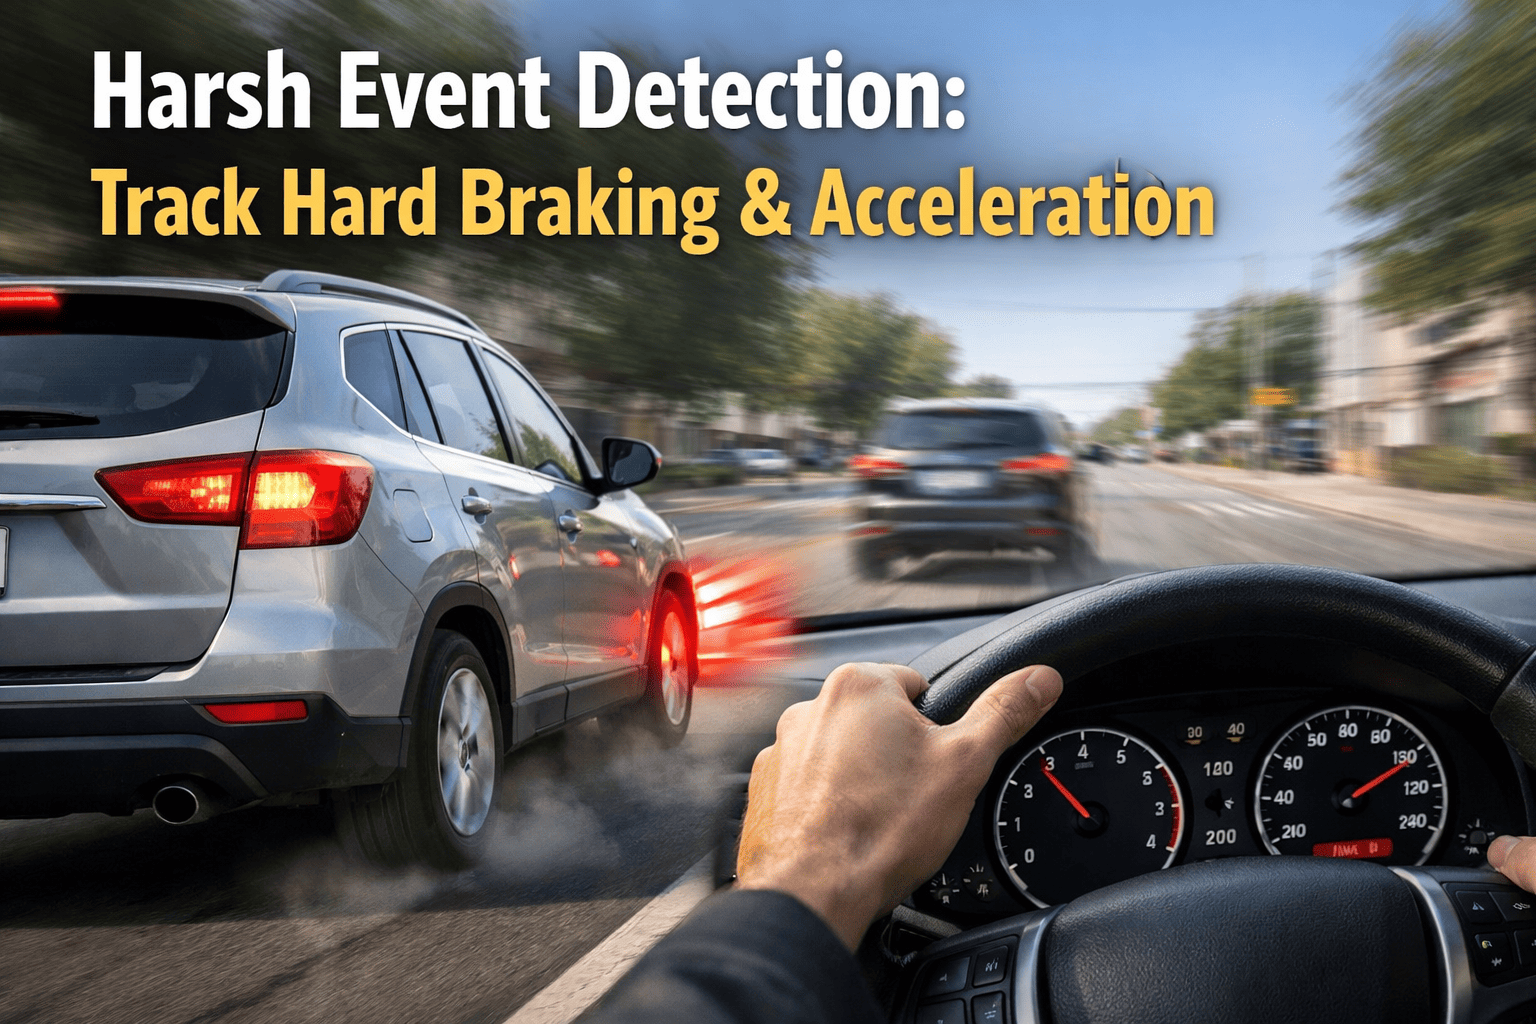
Deceleration events above the hard-brake threshold usually mean the driver was following too close or reacting late. A driver logging harsh brakes on most shifts is showing a pattern, not a one-off — and that pattern is what underwriters and safety managers both want visibility into before it becomes a claim.
Highest correlation with rollover and loss-of-control risk
Rapid Acceleration & Hard Cornering
Aggressive throttle from a stop and high-G cornering both strain drivetrain and suspension components while raising loss-of-control risk in wet or loaded conditions. These events also quietly inflate fuel spend, since aggressive acceleration burns noticeably more fuel per mile than a smooth ramp-up.
Tracked in three violation tiers by severity
Speeding Events
Every mile-per-hour over the posted limit extends stopping distance and raises collision severity if impact occurs. OxMaint tracks speed violations in tiers — modest, moderate, and severe over-limit driving — so a five-minute lapse on an open highway is never scored the same as sustained speeding through a school zone.
From Raw Telematics Signal to a Coaching Conversation
A harsh braking flag sitting in a spreadsheet changes nothing. The value is in the path from raw event to a specific, timely conversation with the driver who generated it — before the pattern becomes an incident.
1
Every Second, Captured
Accelerometer, GPS, and OBD-II data stream continuously from your existing telematics hardware — no new devices required for most fleets.
2
Event Detected & Logged
Harsh braking, rapid acceleration, hard cornering, and speed violations are each timestamped, GPS-located, and attributed to the driver on shift.
3
Normalized Against Route
A mountain-route driver and a flat-highway driver aren't compared on raw counts — OxMaint adjusts for terrain, traffic density, and route type first.
4
Rolled Into a Live Score
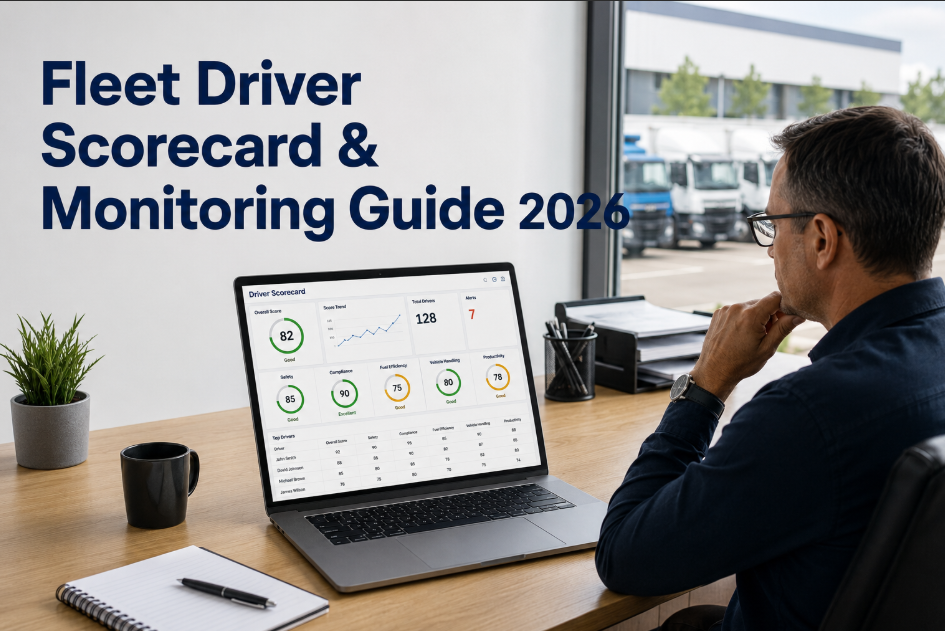
Events aggregate into a rolling per-driver risk score, updated continuously and visible to both the manager and the driver.
5
Coaching Triggered Automatically
Drivers crossing a configurable threshold populate a coaching queue automatically — closing the loop before the tenth event becomes the first accident.
Event Severity Tiers — How OxMaint Weighs What It Sees
Not every hard brake carries the same risk. OxMaint tiers every event by severity and context, so a scorecard reflects actual risk exposure rather than a flat event count.
Event Type
Tier 1 (Low)
Tier 2 (Moderate)
Tier 3 (Severe)
Scoring Weight
Harsh Braking
Occasional, light traffic
Weekly pattern forming
Daily, high-speed onset
Highest
Rapid Acceleration
From full stop, light load
Merging, loaded vehicle
Repeated, laden trailer
High
Hard Cornering
Single low-speed turn
Regular residential turns
Highway ramp, high G-force
High
Speeding
1-10 mph over, brief
11-20 mph over, sustained
20+ mph over, school or residential zone
Highest
See Your Fleet's Current Risk Profile
Connect your existing telematics and OxMaint builds a per-driver scorecard from your last 90 days of trip data
One Fleet's Six Months — Before and After Event Monitoring
The comparison below reflects a 95-vehicle regional delivery fleet before and after six months of structured speed and harsh event monitoring with coaching attached.
Before Monitoring
Harsh braking events / 100 miles
14.2
Drive time above speed threshold
22%
Preventable incidents (6 mo)
9
Driver awareness of own score
None
After 6 Months
Harsh braking events / 100 miles
5.1
Drive time above speed threshold
7%
Preventable incidents (6 mo)
2
Driver awareness of own score
Weekly, in-app
We had a driver with seven years and zero incident reports. Ninety days of event data we hadn't been looking at showed eighteen harsh brakes per hundred miles and heavy speeding on a residential route. We caught it in a scorecard review two weeks before it would have shown up as a claim instead.
Safety Manager, regional parcel delivery fleet
What Powers Continuous Event Monitoring
Telematics & OBD-II Integration
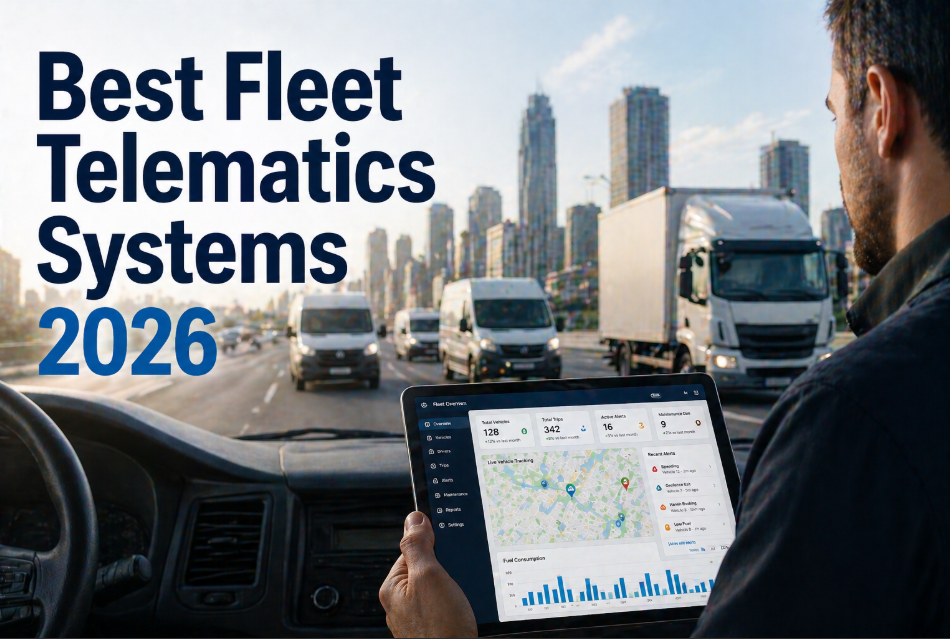
Accelerometer and engine data from Geotab, Samsara, Verizon Connect, and most OEM telematics feed OxMaint via API — existing hardware, no swap required.
Route-Normalized Scoring
Every event is weighed against terrain, route type, and traffic density before it hits a scorecard, so exposure never gets mistaken for risk.
AI Camera Vision
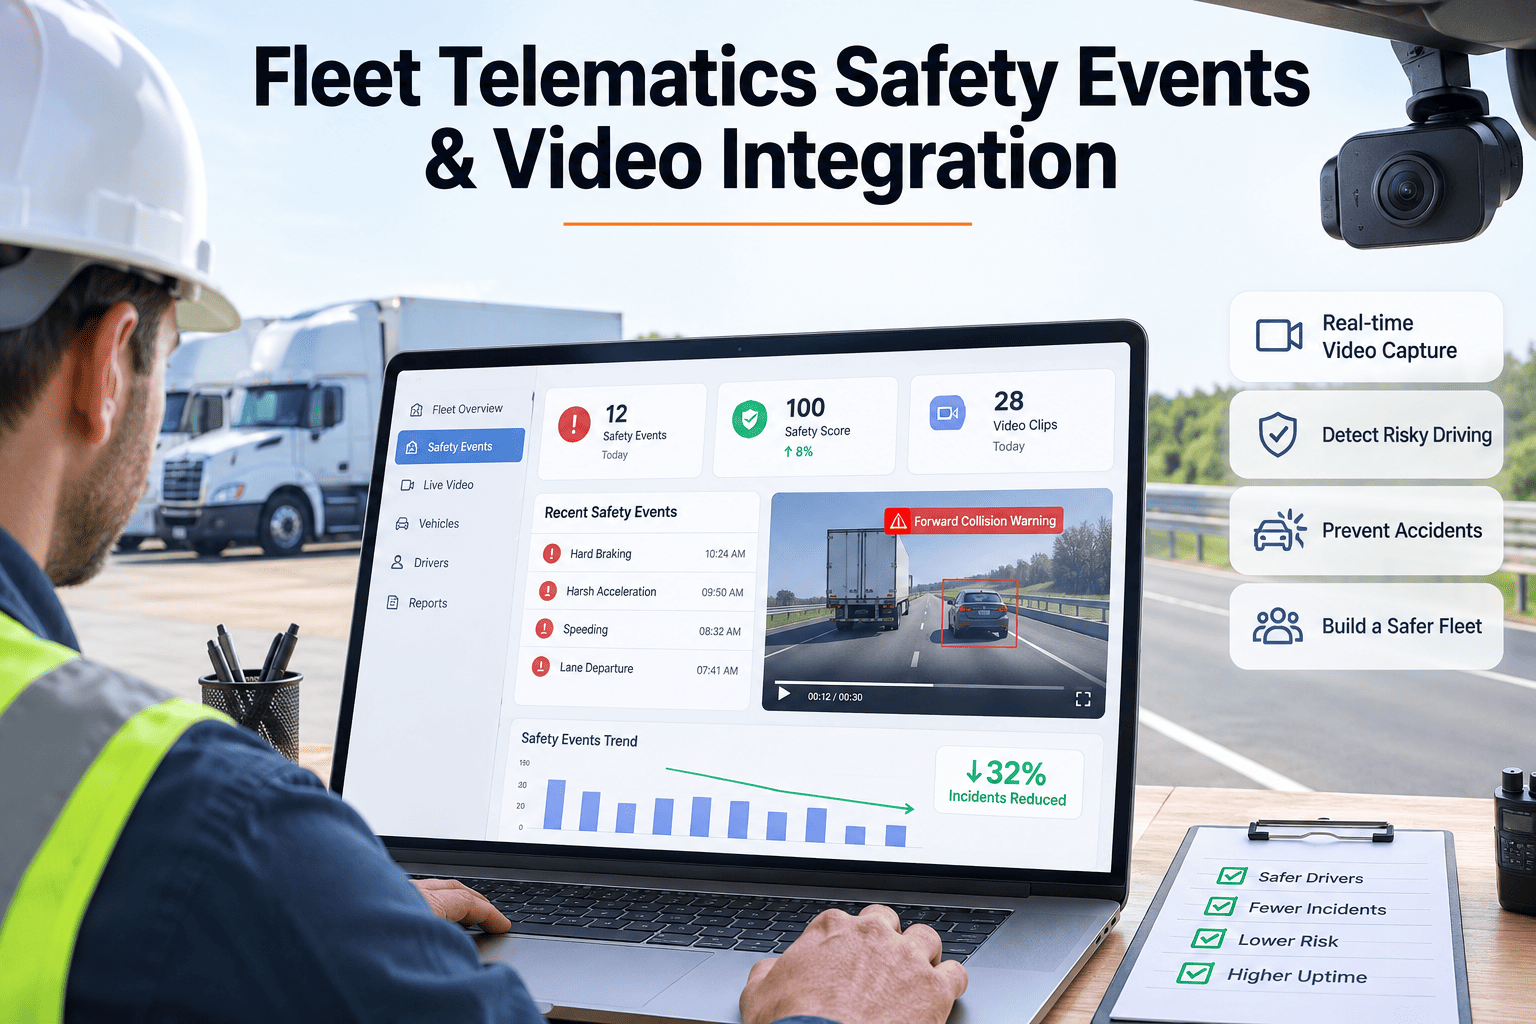
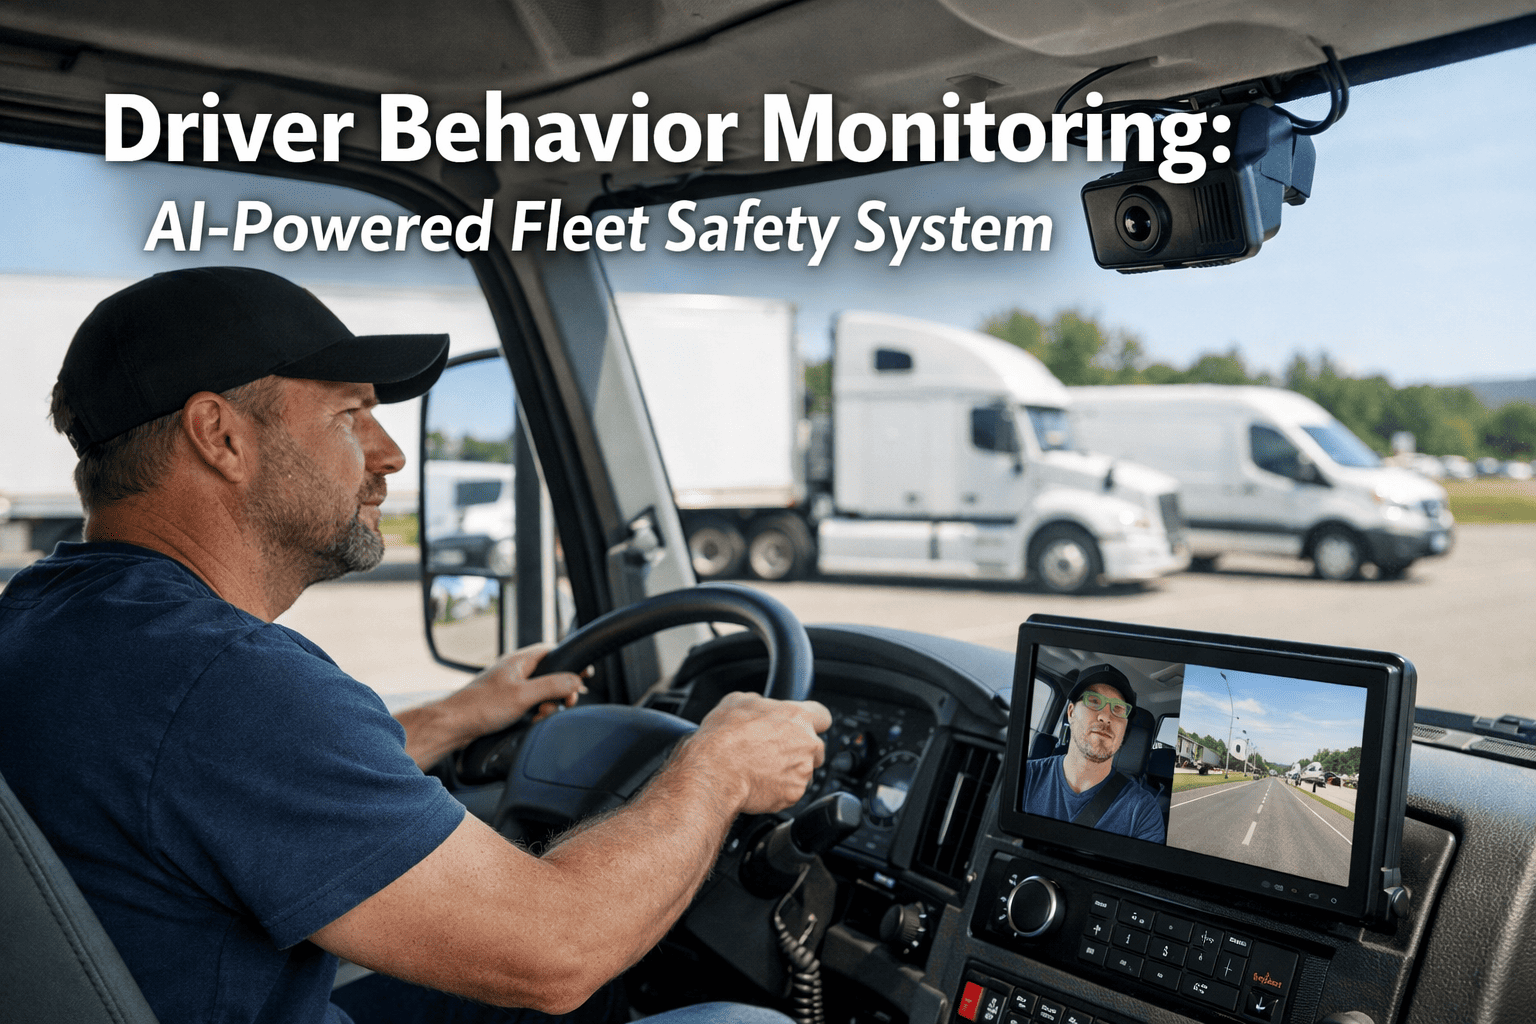
In-cab AI adds distraction and fatigue context to kinematic events, distinguishing a genuine hard brake from a swerve caused by another vehicle.
Automated Coaching Queue
Drivers crossing a configurable event threshold populate a manager's coaching queue automatically, with the specific events attached as evidence.
Frequently Asked Questions
Do we need new hardware to start monitoring speed and harsh braking events?
Usually not. If your fleet already runs Geotab, Samsara, Verizon Connect, or most OEM telematics,
OxMaint connects via API and event scoring can activate within days.
How is a harsh braking event actually defined?
It's a deceleration event above a set G-force threshold, distinct from normal stopping. OxMaint also captures speed and following context so a genuine hard brake isn't confused with routine traffic slowing.
Will drivers see their own event scores?
Yes. Transparent, driver-visible scores are consistently the most effective lever for behavior change — drivers often self-correct within the first week of visibility alone.
Can this data support an insurance renewal conversation?
Yes. A documented, multi-month downward trend in harsh events and speeding gives underwriters evidence rather than a promise, which is what most usage-based pricing conversations require.
How is a fair comparison made between an urban driver and a highway driver?
Scores are normalized against route type, terrain, and traffic density first, so raw event counts never unfairly penalize a driver working a harder route.
Book a demo to see it against your own routes.
Stop Finding Out About Risky Driving After the Claim
OxMaint scores every harsh brake, hard turn, and speeding event per driver, continuously, from telematics your fleet already runs.

.png)