Driver Behavior Analysis: How Telematics and AI Improve Fleet Safety

By Javier Pena on March 19, 2026

driver-behavior-analysis-how-telematics-and-ai-improve-fleet-safety

Driver behavior is responsible for 38% of all commercial fleet accidents, 22–30% of preventable fuel waste, and the single largest variable in fleet insurance premium calculations — yet most fleets still manage it through reactive incident review rather than continuous monitoring. A driver who hard-brakes 14 times per shift, corners aggressively through every left turn, and exceeds 75 mph on 40% of highway miles is generating measurable risk on every trip — risk that shows up as accident costs, claim frequency, and insurance premiums before it ever surfaces in a manager's report. AI-powered telematics platforms like OxMaint close this gap by monitoring every measurable driving behavior continuously, building a per-driver safety scorecard from real trip data, and generating targeted coaching interventions that reduce incident rates by 20–35% within the first 90 days of deployment.

Fleet Safety  ·  Blog  ·  2026

Driver Behavior Analysis: How Telematics and AI Improve Fleet Safety

AI-powered driver behavior analysis monitors harsh braking, speeding, distraction, fatigue, and cornering continuously — building per-driver safety scorecards that reduce fleet accident rates by 20–35% and unlock insurance premium reductions of 8–15% within the first policy year.

38% Of commercial fleet accidents are directly attributable to driver behavior factors
35% Reduction in fleet incident rates achievable with AI-powered driver behavior monitoring
15% Average insurance premium reduction for fleets demonstrating documented safety improvement
90 days Typical timeline to measurable incident rate improvement with AI driver coaching programs

Why Reactive Incident Management Fails Fleet Safety Programs

Reactive fleet safety management — reviewing dashcam footage after an accident, counseling a driver after a complaint, updating policies after an insurance renewal — addresses behavior only after it has already generated cost. By the time a reactive system identifies a high-risk driver, that driver has typically accumulated months of unmonitored behavior that has already contributed to near-misses, vehicle wear, and elevated claim probability. AI-powered telematics driver behavior analysis replaces the reactive cycle with continuous monitoring — surfacing risk before it becomes an incident, not after.

Reactive Management
Unsafe behavior
Near-miss / incident
Review & response
Risk accumulates invisibly for weeks or months before any management action occurs
AI Monitoring
Behavior detected → scored → coaching triggered within 24 hrs — before any incident develops
Zero invisible window — every trip scored, every behavior flagged, every coaching opportunity acted on immediately

The 8 Driver Behaviors AI Telematics Monitors Continuously

AI driver behavior analysis reads telematics data streams from accelerometers, GPS, OBD-II diagnostics, and camera AI to score every measurable behavior on every trip. The eight behaviors that drive the highest correlation with accident risk and insurance claims are monitored individually, weighted by severity, and aggregated into a per-driver safety score that updates with every completed trip.

High Risk
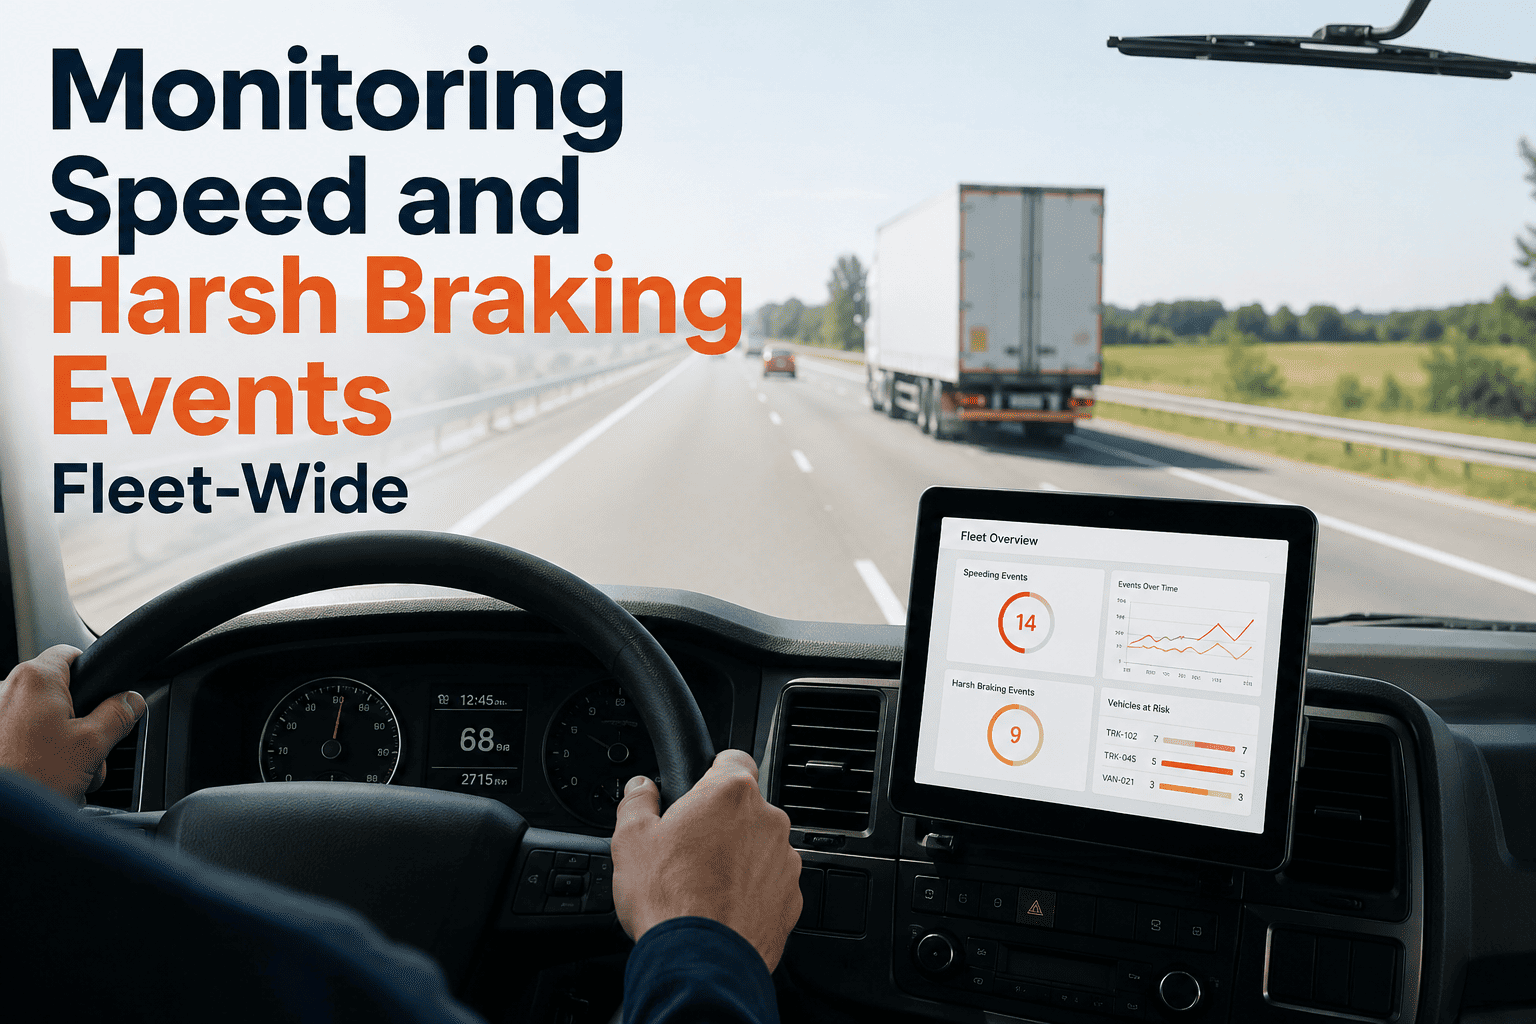
Harsh Braking
Deceleration events exceeding 0.4g — correlates with tailgating, inattention, and fatigue. Each event flagged with location and speed context.
3.4× higher rear-end accident risk vs smooth braking drivers
High Risk
Rapid Acceleration
Events exceeding 0.35g from stopped or low speed. Indicates aggressive style and contributes to loss-of-control risk in wet conditions.
+12–18% fuel consumption per trip vs smooth acceleration baseline
High Risk
Speeding
Speed violations tracked in three tiers: 1–10 mph over, 11–20 mph over, and 20+ mph over posted limits. Severity-weighted in scoring.
Fatal accident probability doubles for every 10 mph above 50 mph
Medium Risk
Aggressive Cornering
Lateral acceleration exceeding 0.3g in turns. Primary rollover risk factor for high-CG vehicles. GPS location mapped to specific intersections.
Primary rollover risk factor for van and box truck fleets
High Risk
Distracted Driving
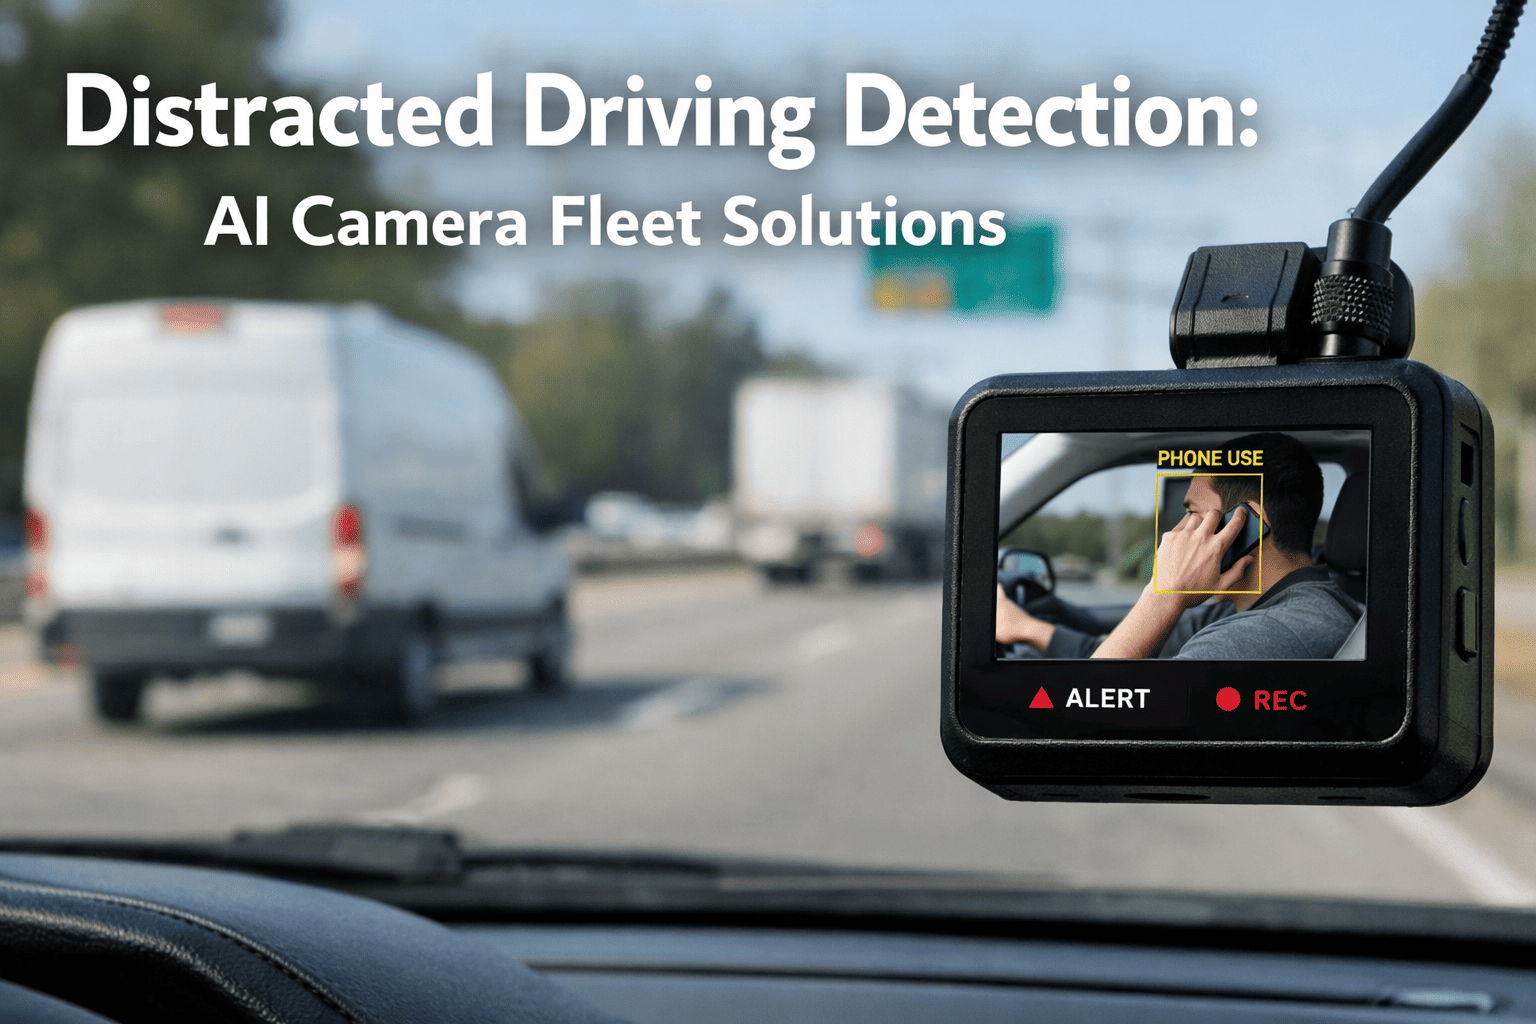
Camera AI detects phone use, eyes-off-road, and hand-not-on-wheel events — now the leading cause of fleet at-fault accidents in urban operations.
#1 cause of at-fault fleet accidents in urban environments
High Risk
Fatigue Indicators
Lane drift frequency, micro-correction steering patterns, and driving duration past HOS limits combined into a fatigue probability signal per shift.
Fatigue-related accidents peak in 6–8 AM and 2–4 PM windows
Medium Risk
Seatbelt Non-Compliance
OBD-II and camera AI detect unbuckled operation within seconds of departure. Increases driver fatality risk by 3× in front-impact collisions.
3× fatality risk in front-impact events without seatbelt
High Risk
Following Distance / Tailgating
Radar and camera AI measure headway in seconds. Less than 2-second following distance on highways flagged with speed and traffic context.
Rear-end collisions are the #1 commercial fleet at-fault accident type

Driver Safety Scorecards: How AI Builds a Per-Driver Risk Profile

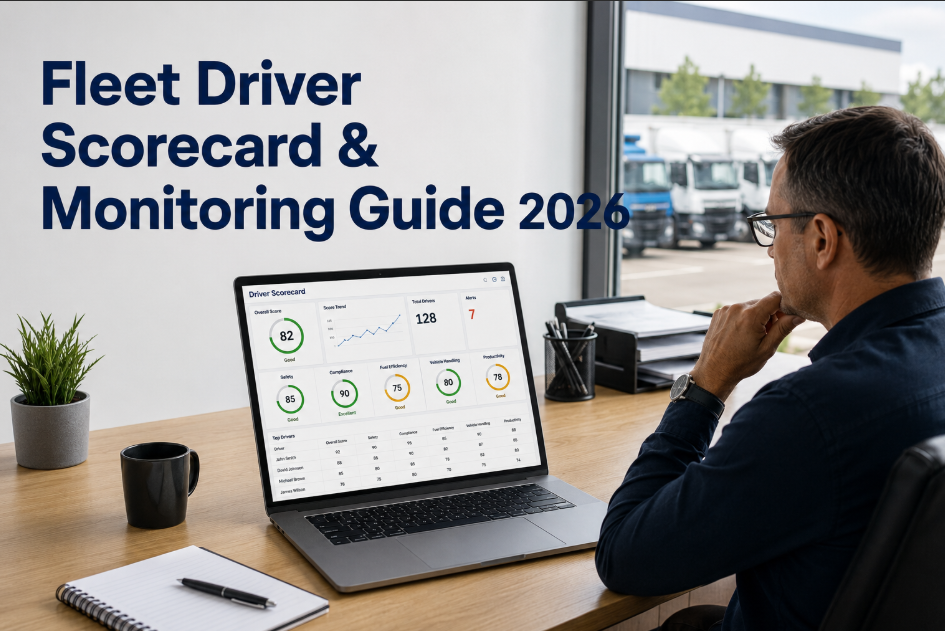
A driver safety scorecard converts raw telematics events into a composite risk score comparable across drivers, routes, and vehicle types. OxMaint's AI driver scoring normalizes every behavior metric against route type, distance, traffic density, and time of day — producing a score that reflects actual risk propensity rather than exposure volume. This makes scorecards actionable for coaching, fair for performance conversations, and credible for insurance documentation.

Sample Driver Safety Scorecard — OxMaint AI Scoring
Driver A
87 / 100
Low Risk
Harsh Braking

88
Speed Compliance

92
Distraction Events

74
Acceleration

90
Cornering

85
Driver B
54 / 100
High Risk
Harsh Braking

42
Speed Compliance

58
Distraction Events

48
Acceleration

66
Cornering

55
Driver B generates 4.8× more high-risk events per 100 miles than Driver A — both operating the same vehicle type on comparable routes. Route normalization makes this comparison valid and defensible in a coaching context.

Driver Coaching Programs: Turning Scorecard Data Into Behavior Change

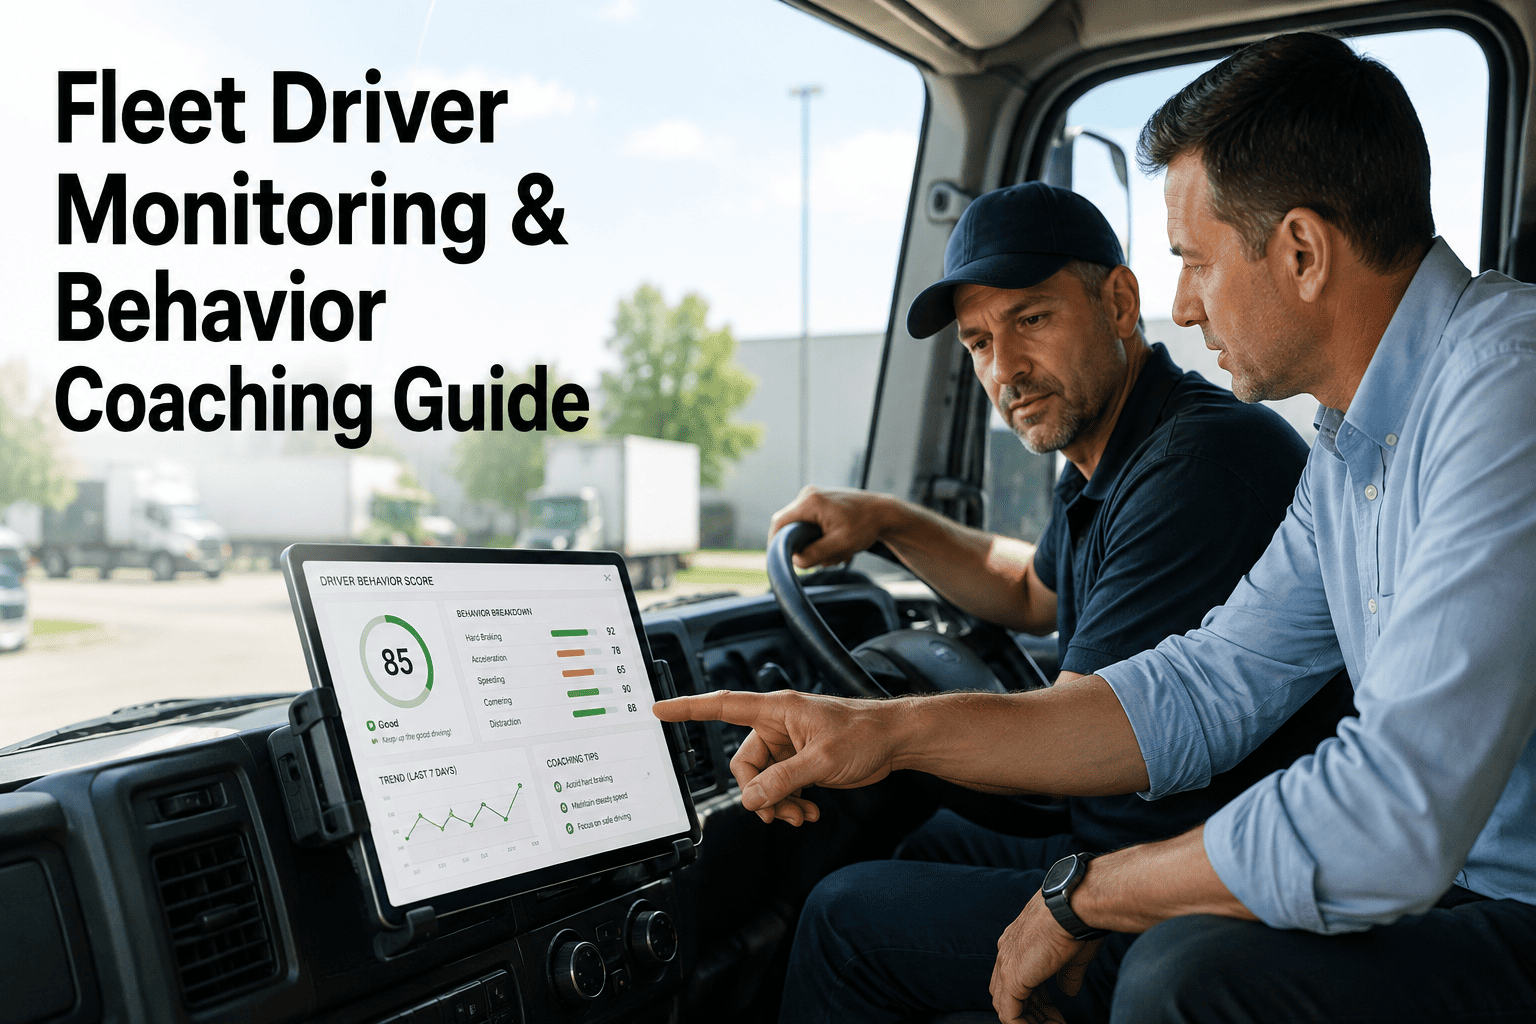
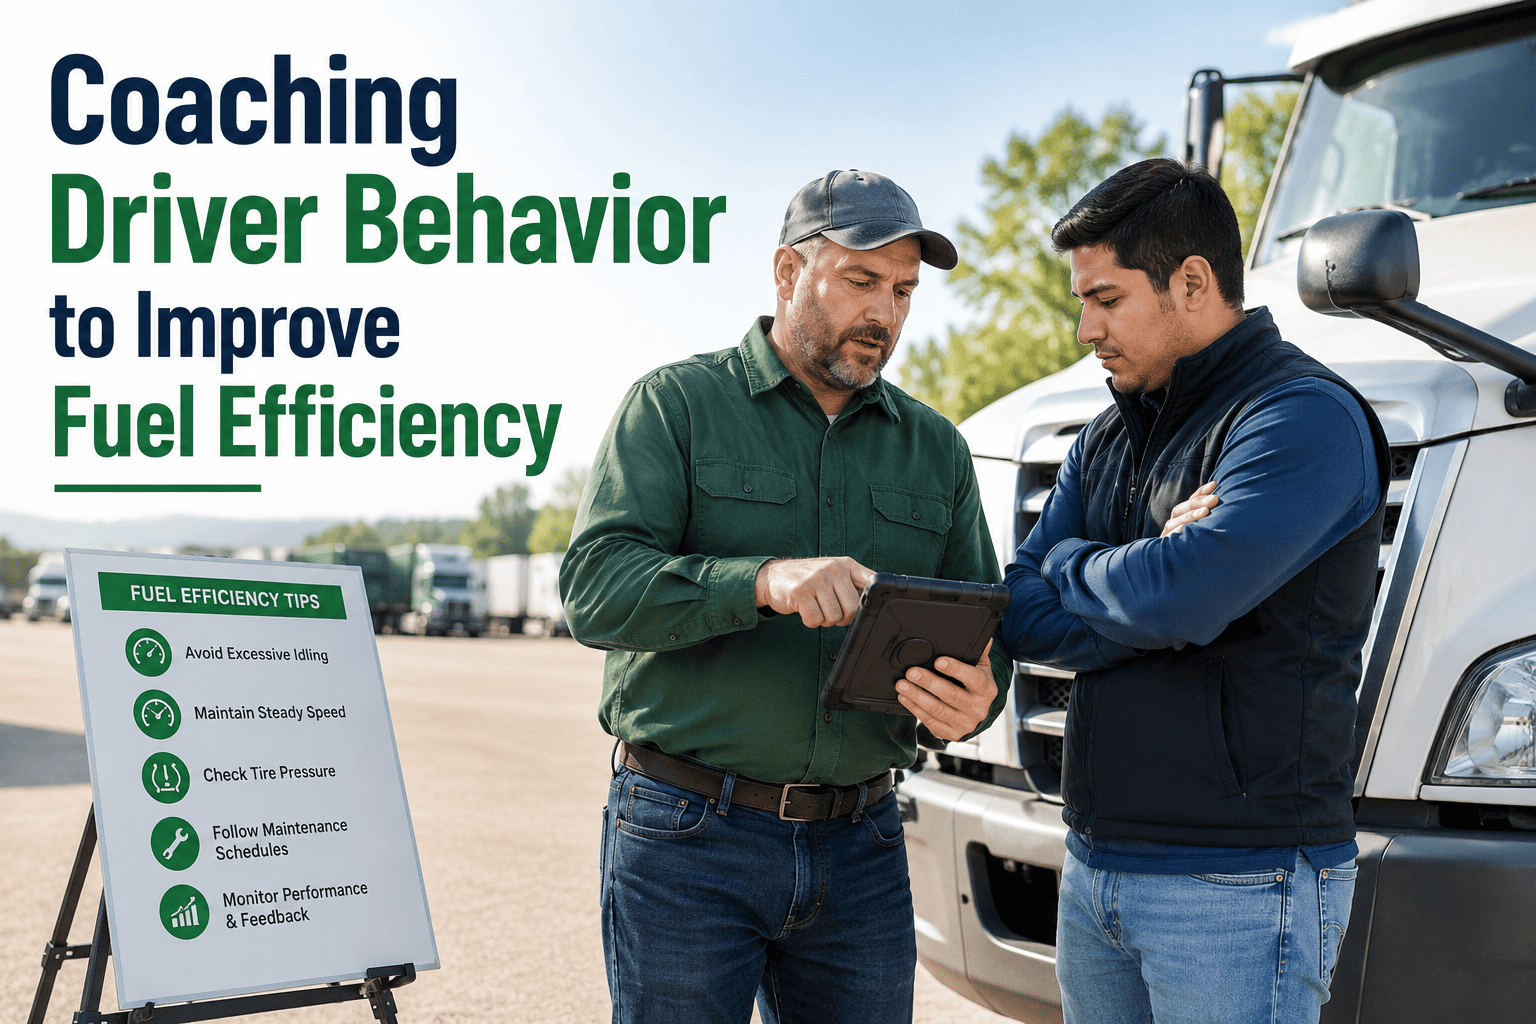
A safety scorecard without a structured coaching program is a reporting tool, not a safety program. Behavior change requires specific, timely, attributed feedback — not generalized instruction. A driver who receives a coaching session three weeks after an event with no trip context will not change their behavior. A driver who sees the precise moment, location, and severity of the event changes behavior durably. OxMaint's driver coaching workflow automates the feedback loop within 48 hours of any qualifying event.

01
Event Detected & Scored
AI flags qualifying behavior event with severity, location, and trip context. Score updated in real time.
02
Coaching Package Generated
Trip data, behavior breakdown, scorecard context, and coaching discussion points compiled automatically.
03
Manager Coaching Session
Manager reviews package, conducts session with driver within 48 hrs. Session logged and signed off in CMMS.
04
Score Trend Monitored
Driver's score tracked over the next 30 days. Improvement confirmed or escalation triggered if behavior persists.
05
Audit Trail Recorded
All coaching actions timestamped, person-attributed, and retained — HR-ready and insurance-defensible documentation.

Insurance Premium Impact: How Driver Behavior Data Reduces Fleet Insurance Costs

Fleet insurance underwriters actively offer premium discounts for carriers that provide telematics-documented driver behavior data — because the data allows them to price risk precisely rather than using fleet-average actuarial tables. OxMaint's CMMS driver safety records generate the exact documentation package underwriters request: per-driver scorecard history, coaching session logs, incident correlation reports, and fleet-wide behavior trend data — timestamped and audit-ready for annual policy renewal.

8–15%
Premium reduction for telematics-documented safety improvement
Most major commercial fleet insurers now offer usage-based pricing tiers. Documented score improvement is the primary qualification criterion.
$42K
Average annual premium saving — 50-vehicle fleet at 12% reduction
For a fleet paying $350,000/year in commercial auto liability, a 12% reduction saves $42,000 — typically 2–4× the annual CMMS platform cost independently.
12 mo
Minimum documented safety trend required for most insurer discount programs
Insurers require a 12-month data trail — meaning fleets that start monitoring now will be positioned for premium reduction at the next renewal cycle.
3× lower
Claim frequency for fleets with active AI driver behavior programs vs reactive management
Lower claim frequency directly reduces experience modification factors — compounding the premium reduction across multi-year policy periods.

Start Building Driver Safety Scorecards for Every Driver in Your Fleet

OxMaint's AI driver behavior analysis monitors every trip, scores every behavior, and generates automated coaching workflows — delivering measurable incident rate reduction within 90 days and insurance documentation that supports premium reduction at your next renewal.

Reactive Fleet Safety vs. AI-Powered Driver Behavior Analysis

Safety Factor
Reactive Management
AI Behavior Analysis (OxMaint)
Risk detection timing
After incident or complaint — risk already realized
During trip — event flagged within minutes, coaching within 48 hrs
Driver score visibility
No objective score — manager judgment only
Per-driver, route-normalized score updated after every trip
Coaching specificity
Generic safety reminders — no trip-specific context
Trip-attributed event data — specific behavior, location, severity
Distraction monitoring
Not detectable without camera — unknown until accident
Camera AI detects phone use, eyes-off-road per event per trip
Insurance documentation
No structured data trail — premiums set by actuarial tables
12-month scorecard history and coaching logs — insurer-ready package
Incident rate improvement
Marginal — reactive programs show 5–8% improvement at best
20–35% reduction — documented outcome at fleet scale within 90 days
High-risk driver identification
Identified after multiple incidents — too late for proactive intervention
Identified within first 30 days of monitoring — before any incident occurs
35%
Reduction in fleet incident rates with AI driver behavior monitoring
Each prevented incident saves $8,000–$45,000 in claim costs, vehicle repair, driver downtime, and liability exposure.
$42K
Annual insurance premium saving — 50-vehicle fleet at 12% reduction
Premium savings alone typically cover 2–4× the annual CMMS platform cost — independent of accident reduction value.
90 days
Time to measurable incident rate improvement with structured coaching
Behavior change responds quickly to specific, attributed feedback — fleets see score improvements within the first month.
25%
Fuel cost reduction from behavior improvement — combined safety and efficiency outcome
Driver behavior improvements simultaneously reduce incident rates and fuel consumption — dual ROI from a single monitoring program.

Frequently Asked Questions

How does AI driver behavior scoring differ from basic telematics event counting?
Basic event counting totals raw incidents without route context — a mountain highway driver will always out-brake an urban driver unfairly. AI scoring normalizes every metric against route type, terrain, distance, and traffic density so scores reflect actual risk propensity, not exposure volume. OxMaint's engine builds a unique baseline per driver — the score measures how they drive relative to their own established pattern.
How should safety managers handle driver resistance to behavior monitoring?
Resistance is lowest when monitoring is framed as a coaching tool, not surveillance — drivers see their own scores, understand how they're calculated, and top performers are recognised. Fleets pairing monitoring with a documented coaching program consistently report 80%+ driver acceptance within 60 days. Book a demo to see the driver-facing scorecard interface.
What documentation does OxMaint generate for insurance purposes?
OxMaint produces a structured underwriter package: 12-month fleet behavior trend data, per-driver scorecard history, coaching session logs, and incident-to-behavior correlation reports — exactly what usage-based pricing insurers request for premium discount qualification. Sign up free to start building your insurance documentation trail today.
How quickly do driver behavior scores improve after coaching program launch?
Bottom-quartile drivers typically improve significantly within 30 days; fleet-average scores rise 12–18 points by 60 days; gains stabilize at 90 days. Fleets that automate the coaching workflow see 40–60% faster improvement than manual-review programs. Sign up for OxMaint free to start the 90-day improvement cycle.

38% of Your Fleet Accidents Are Preventable. OxMaint Prevents Them.

Per-trip scoring, automated coaching, and insurer-ready documentation — all in one platform. Free to start. No hardware required.
Share This Story, Choose Your Platform!