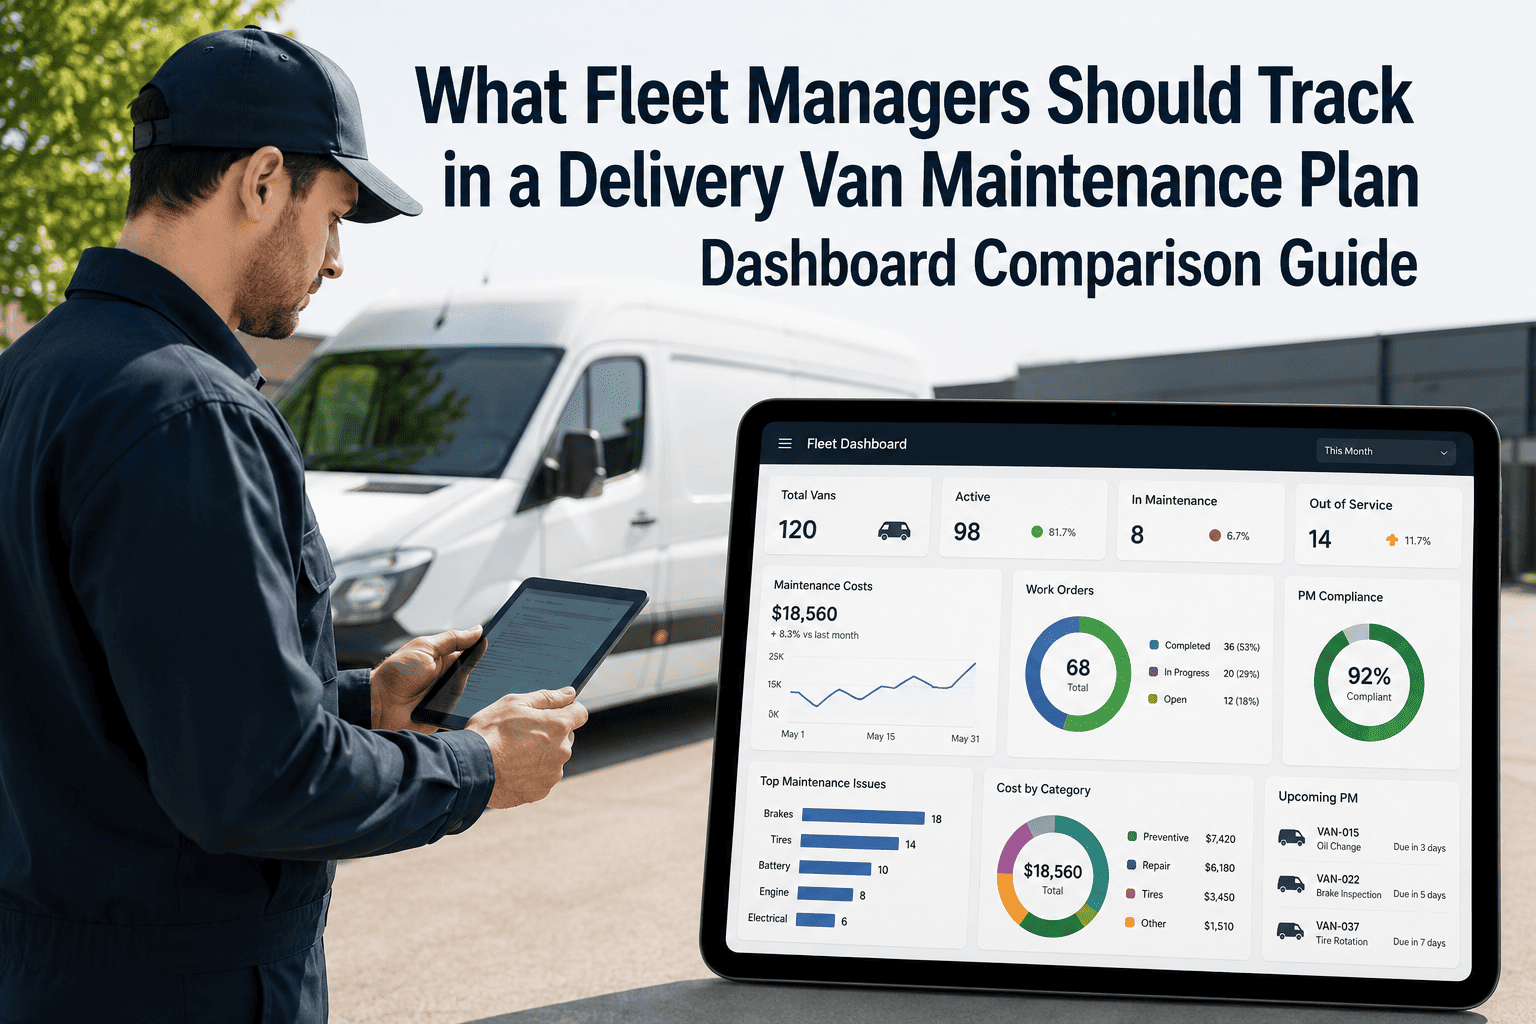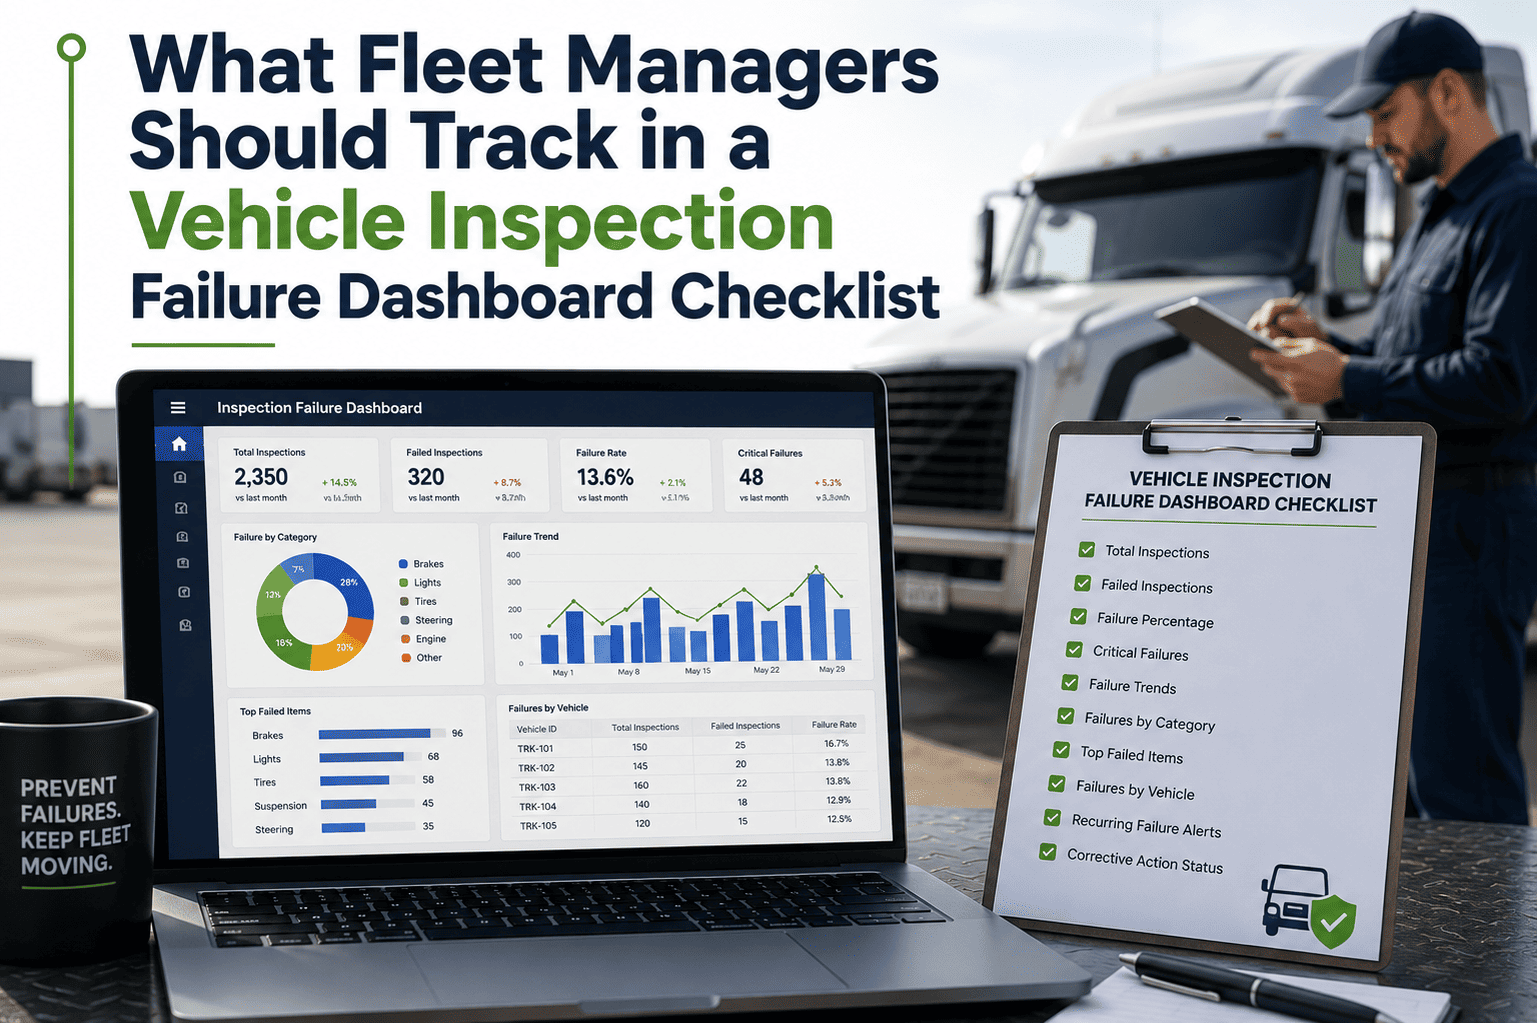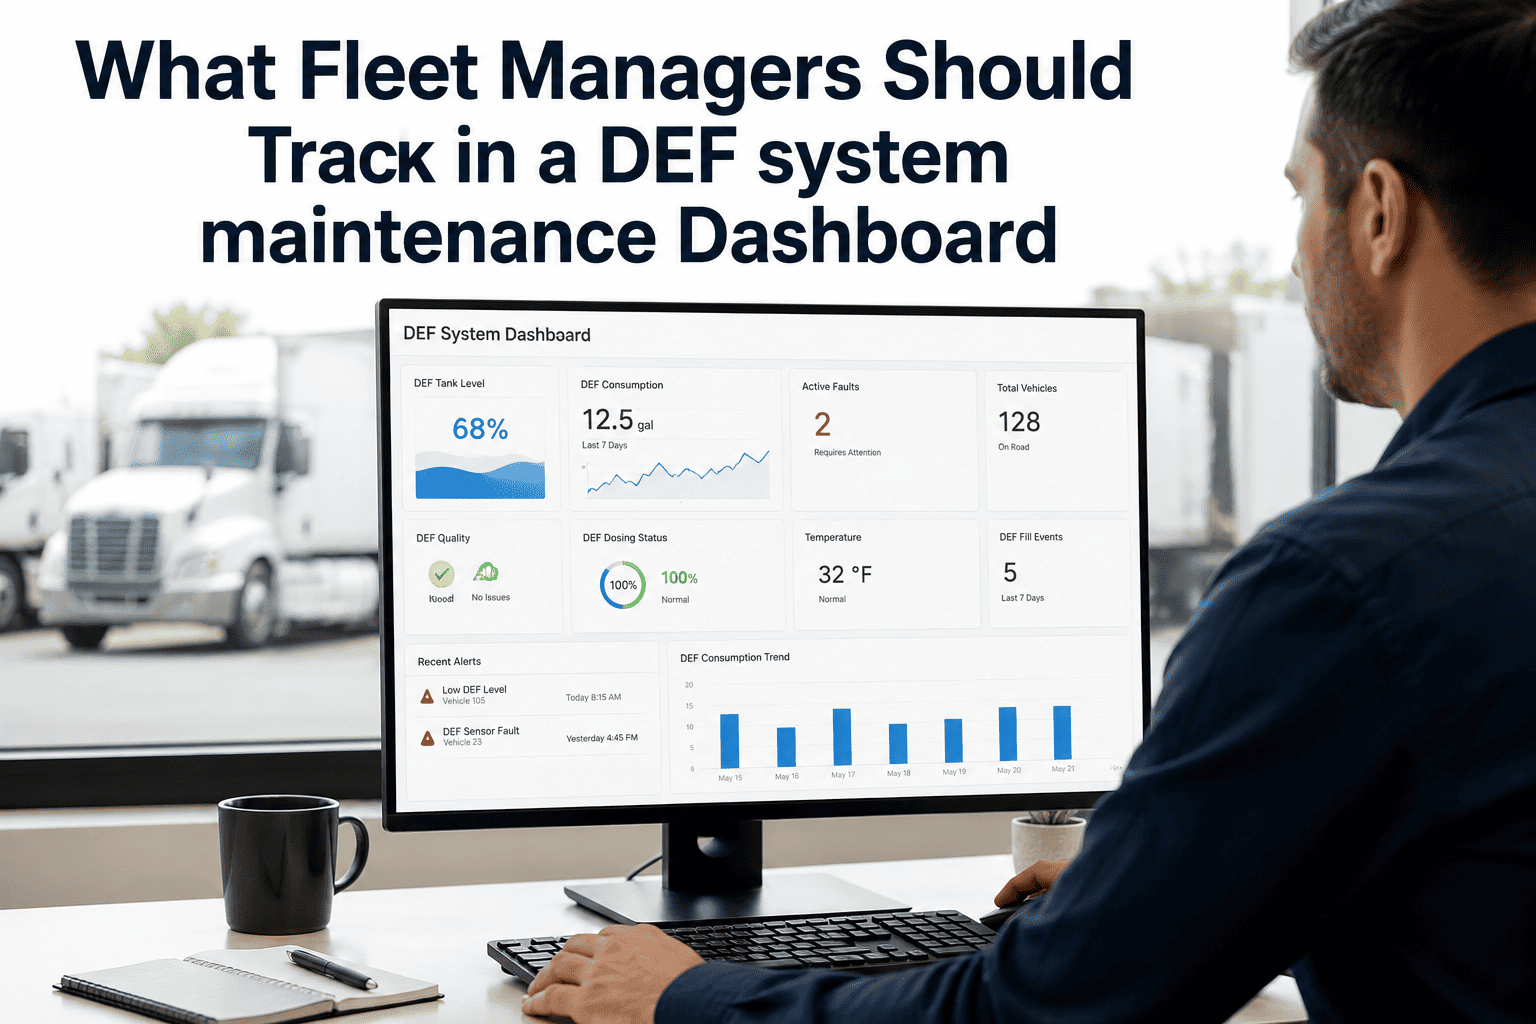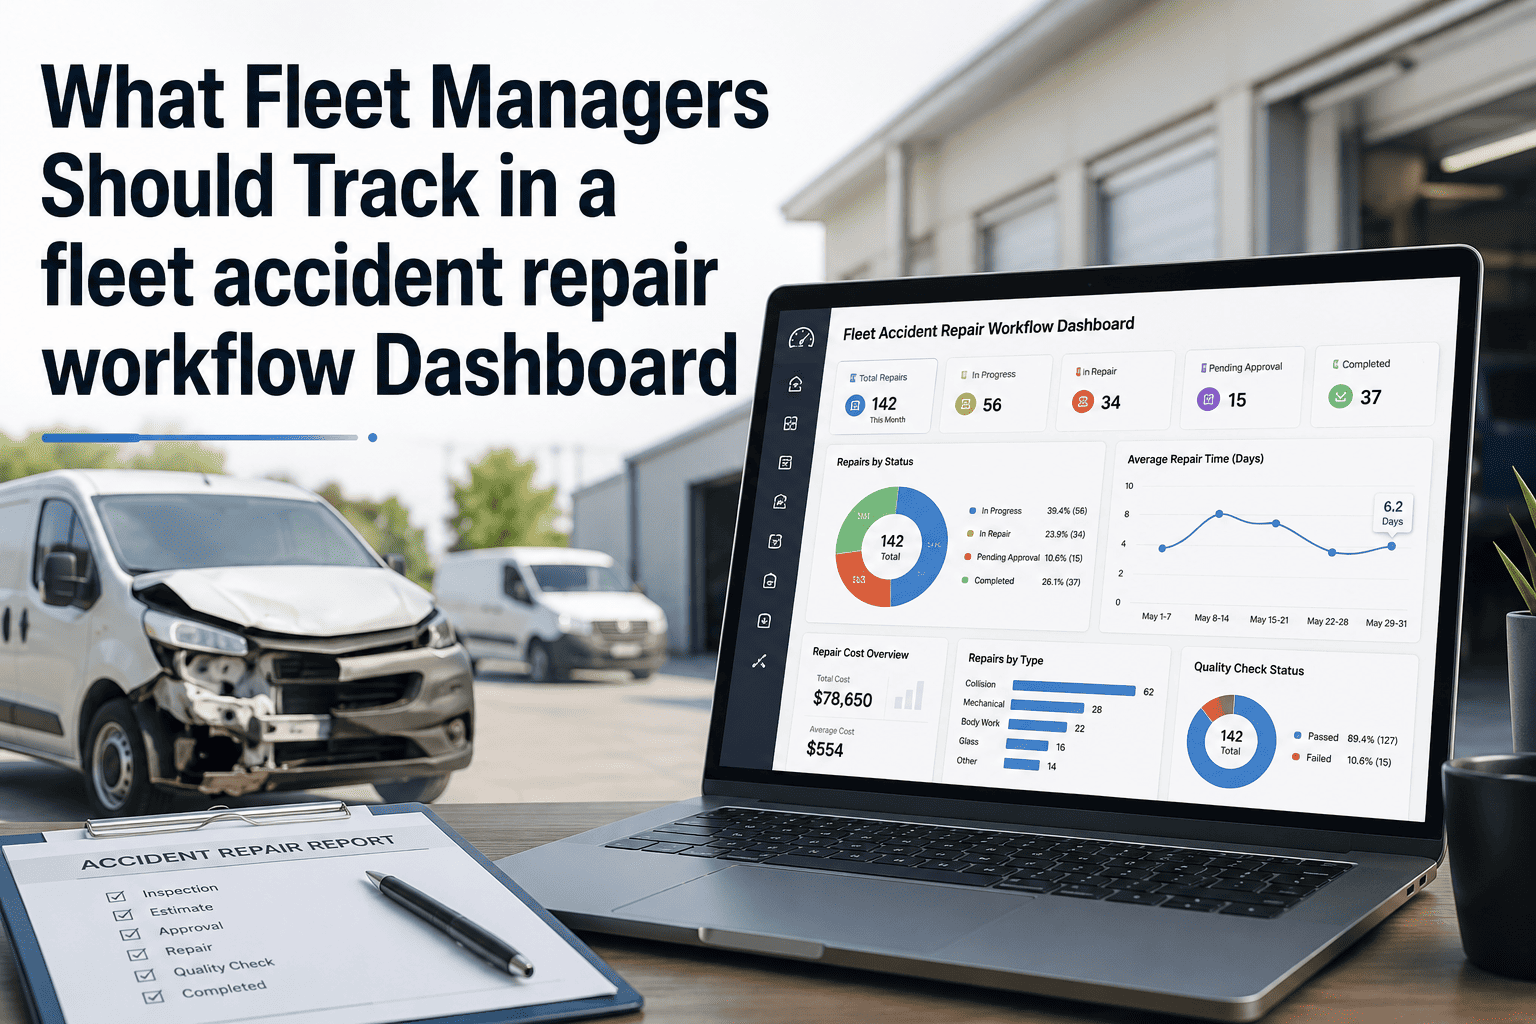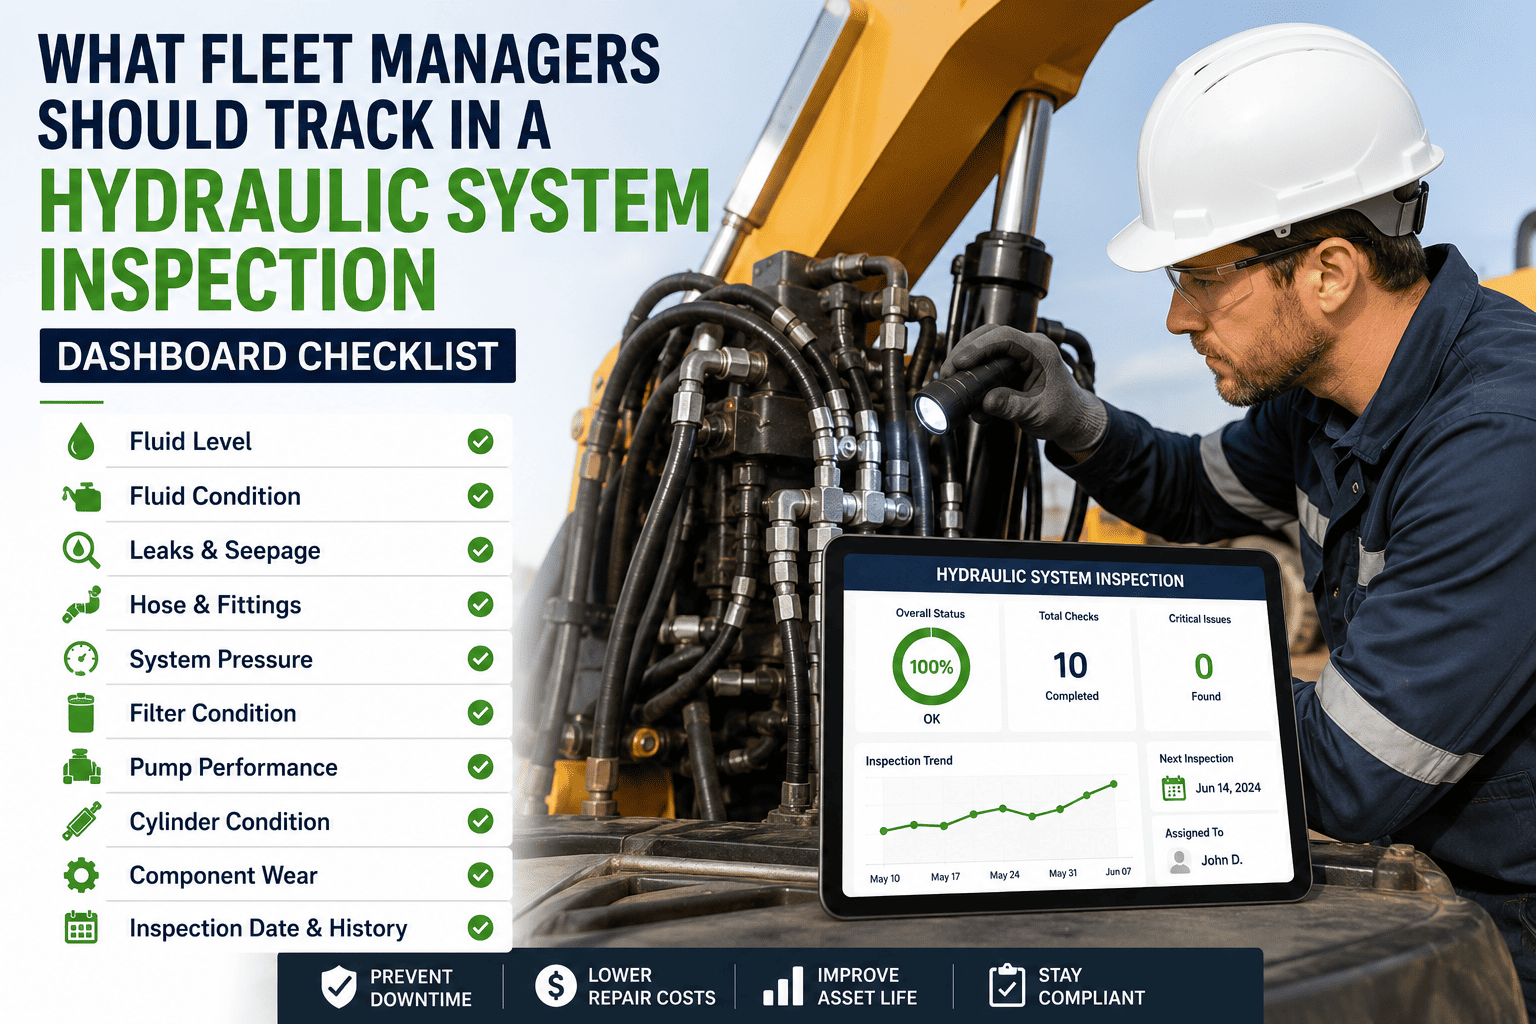
A hydraulic hose does not fail with a warning light — it fails at 2,500 psi during a live load drop, and the only reason you didn't see it coming is that nobody was watching the right number. Fleet managers track engine oil and mileage religiously, yet hydraulic fluid cleanliness, pressure drift, and hose age accumulate silently until a cavitating pump locks a body in the raised position mid-shift. The difference between a $150 fitting repair and a $25,000 pump replacement is whether the warning signs were on a dashboard or buried in a technician's memory. Oxmaint turns hydraulic health into live KPIs that flag risk before it becomes a breakdown.
The Six KPIs Every Hydraulic Dashboard Must Track
A dashboard showing forty metrics with equal weight creates fatigue — managers stop looking. The fleets that outperform track fewer numbers, well, with a clear target and an action trigger on each. These six are the north-star hydraulic KPIs: each one is a leading indicator of a specific failure mode, and each one is invisible until you measure it.
From Raw Signal to Dashboard Number
A KPI is only as good as the data feeding it. Most hydraulic dashboards fail because the numbers reflect what got logged on paper, not what actually happened on the vehicle. The flow below shows how Oxmaint pulls each signal directly from the source — so the metric on screen describes the real condition of the system, not a paperwork timeline.
Dashboard Tracking Checklist — What to Configure Per Vehicle
A dashboard that tracks the wrong things is worse than none — it creates false confidence. Use this checklist to set up each hydraulic asset so every metric on screen is fed by a real, current signal. Configure each item once in Oxmaint and it tracks automatically from then on.
Set the rated working pressure and drift alert threshold
Enter each circuit's rated pressure so the dashboard can flag any drift beyond 5%. Without a baseline, a pressure number is just a number. Required for drift KPI
Record the install date stamped on every hydraulic hose
Hose age drives the replacement alert at the 6-year mark — the most commonly missed hydraulic PM trigger across fleets. Required for hose KPI
Schedule fluid sampling at every 250-hour interval
Log the ISO cleanliness code each time so the contamination trend is visible — milky or black samples should trigger an immediate particle count. Required for cleanliness KPI
Tag every hydraulic work order as planned or reactive
This single field powers the reactive-vs-planned ratio — the KPI that proves whether your PM program is shrinking emergency spend. Required for cost KPI
Enable role-based dashboard views
Technicians see the repair queue, managers see cost trends, executives see uptime — one source, three views, no dashboard fatigue. Best practice
Set a weekly review cadence with an action owner per metric
Tracking a KPI without acting on it is the most expensive waste in maintenance — every off-target metric needs an owner and a due date. Best practice
We were running 55% planned, 39% unplanned on hydraulics — flying blind. After moving pressure and fluid data into Oxmaint dashboards, the reactive ratio dropped to 18% in two quarters. The dashboard caught a pump losing 9% pressure on a refuse vehicle six weeks before it would have failed mid-route.
Setting the Right Threshold for Each Metric
A KPI without a threshold is just a number scrolling past. The value comes from knowing the exact point where green becomes amber and amber becomes a work order. The reference below shows the watch and action levels Oxmaint applies by default — tune them to your operating environment, but never leave a metric without one. Each row maps to a checklist item you configure once per vehicle.
| Metric | Healthy | Watch — review | Act — work order |
|---|---|---|---|
| Fluid cleanliness | within ISO target | one code above target | two codes above — schedule flush |
| Pressure drift | under 5% | 5–8% drift | above 8% — pressure test pump |
| Hose age | under 5 years | year 5 | year 6 — replace regardless of look |
| PM completion | 95%+ on time | 85–95% | below 85% — staffing review |
| MTBF (hydraulic) | rising or stable | first decline | two declines — root-cause inspection |
| Reactive ratio | 20% or less | 20–35% | above 35% — PM program audit |
How Each Checklist Item Becomes a Decision
Configuring the dashboard is only half the work — the payoff is the decision each metric drives. Below is what each tracked item actually tells you and the move it prompts, so the dashboard becomes a daily operating tool rather than a wall display.
Common Dashboard Mistakes to Avoid
Most hydraulic dashboards fail for predictable reasons. Knowing them up front saves you from building a screen everyone quietly ignores within a month.
Why Dashboard-Driven Fleets Win
The fleets outperforming their peers in 2026 aren't working harder — they're seeing faster. Unplanned downtime runs $448–$760 per vehicle per day, and the average fleet wastes 5–10% of its budget on poor PM compliance alone. A hydraulic dashboard built on the right KPIs is what turns that waste into a managed, shrinking line item.
Frequently Asked Questions
Common questions from fleet managers building a hydraulic KPI dashboard and deciding which metrics actually move the needle.
Start with four north-star metrics: fluid cleanliness, pressure drift, PM completion rate, and reactive-vs-planned ratio. Add MTBF and hose-age tracking as your data matures. Fewer metrics tracked well beats many tracked poorly.
Review operational KPIs weekly, trend metrics like MTBF monthly, and cost ratios quarterly. The key is attaching an action owner and due date to every metric that drifts off target.
Incomplete data capture. If failures are reported by radio and logged hours later, MTBF and availability are describing paperwork, not reality. Oxmaint captures signals at the source to close that gap.
Yes. When any KPI breaches its threshold, Oxmaint fires an alert and auto-generates a work order with the inspection checklist pre-loaded for the assigned technician.
Most fleets have a populated KPI dashboard within hours of connecting their PM and inspection data, and identify their first actionable insight in the first week of use.